
マウスおよびラ䮊トの器官におけaSンパウ量の測定
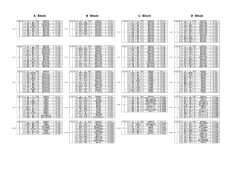
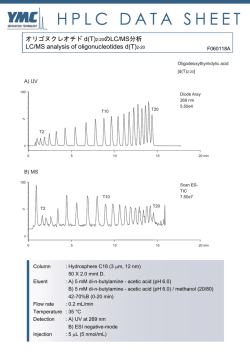
䮥䭭䮀䬙䭗䭂䮰䮊䮏䬽ེቭ䬺䬙䬠䭚䮆䮺䮘䭶㊂䬽᷹ቯ䎃 䎃 䧊 Ꮉἑᵏม 䎔䫺ኹፒ⌀᮸ 䎔䫺⮮ᄥ 䎔䫺⣻Ꮞ䭕䬚䭙 䎔䫺䎶䏗䏄䏓䏈䏏䏖䎃䎰䏄䏕䏗䏋䏄䎃䎧䎑䎕䫺䎯䏄䏑䏊䏕䏌䏇䏊䏈䎃䎭䏄䏐䏈䏖䎃䎬䎑䎖䫺䎳䏌䏓䏈䏕䎃䎦䏋䏈䏏䏖䏈䏄䎗䫺䎽䏋䏒䏘䎃䎤䏑䎗䎃 ᣣᧄ䭭䭰䯃䮆䯃䮁ᩣᑼળ␠ 䎔䫺䎺䏄䏗䏈䏕䏖䎃䎦䏒䏕䏓䏒䏕䏄䏗䏌䏒䏑䎏䎃䎰䏌䏏䏉䏒䏕䏇䎏䎃䎰䎤䎕䫺䎺䏄䏗䏈䏕䏖䎃䎦䏒䏕䏓䏒䏕䏄䏗䏌䏒䏑䎏䎃䎰䏄䏑䏆䏋䏈䏖䏗䏈䏕䎏䎃䎸䏑䏌䏗䏈䏇䎃䎮䏌䏑䏊䏇䏒䏐䎖䫺䎯䏈䏊䏄䏆䏜䎃䎵䏈䏖䏈䏄䏕䏆䏋䎏䎃䎳䏒䏕䏗䏏䏄䏑䏇䎏䎃䎲䎵䎖䎃 OVERVIEW RESULTS Brains ⋡⊛䎝䎃䮰䮊䮏䬙䭗䭂䮥䭭䮀䬽ฦེቭ䬺䬙䬠䭚䮆䮺䮘䭶㊂䬽᷹ቯ䎃 Hearts Kidneys Livers Spleens ᣇᴺ䎝䎃䮰䮠䮲䮜䮱䯃䎃LC/MSE ᷹ቯ䬺䭗䭚⛘ኻቯ㊂䎃 ⚿ᨐ䎝䎃ฦེቭ䬺․⇣⊛䬙䭗䭂ㅢ䬨䭚䮆䮺䮘䭶䭡หቯ䬦ቯ㊂䬦䬮䎃 Figure 4. ⢄⤳䬺䬙䬠䭚䭾䮏䭶䮴䮧䎃䎳䎗䎘䎓 䭡␜䬦䬮 䮙䯃䮏䮥䮊䮞䬽ᄢ࿑ INTRODUCTION Hemoglobin subunit alpha Hemoglobin subunit beta Actin cytoplasmic Glyceraldehyde 3 phosphate dh Serum albumin Hemoglobin subunit beta 2 Malate dehydrogenase Actin cytoplasmic 2 Malate dehydrogenase cytoplasmic Alpha globin ATP synthase subunit beta Tubulin alpha 4A chain Actin alpha skeletal muscle Peptidyl prolyl cis trans isomerase A ATP synthase subunit alpha Alpha enolase Calmodulin L lactate dehydrogenase B chain Tubulin alpha 1C chain Isocitrate dehydrogenase NADP Profilin 1 Fructose bisphosphate aldolase A Superoxide dismutase Cu Zn Beta glo Triosephosphate isomerase ⇣䬹䭚∔ᖚ⁁ᘒ䬺䬙䬠䭚䮞䮴䮍䭱䯃䮧⸃ᨆ䭡ⴕ䬕೨䬺䫺䮠䯃䮀䬷䬹䭚ᱜᏱ⁁ᘒ 䬺䬙䬠䭚䮆䮺䮘䭶㊂䬽᷹ቯ䬛ᔅⷐ䬶䬑䭚䫻䬢䭛䭘䬽᷹ቯ䬶䬾䫺䭼䮺䮞䮲䬽೨ಣℂ 䬺䭗䬲䬵↢䬧䭚ᄌേ䭑䬑䭚䬛䫺⇣䬹䭚䬚䭘↢䬧䭚ᄌേ䭡⍮䭚䬢䬷䬛䬶䬜䭚䫻 䬬䬢䬶ᚒ䫽䬾 䎗 䬽䮰䮊䮏䬙䭗䭂 䎖 䬽䮥䭭䮀䬽 䎘 ⒳㘃䬽ེቭ䯴⣖䫺ᔃ⤳䫺䎃 ⣢⤳䫺⢄⤳䫺⣛⤳䯵䬺䬙䬠䭚䮆䮺䮘䭶㊂䭡䫺ᒝᐲ䬽㜞䬓 䎖 䬽䮡䮞䮈䮐䎃 䬺䬙䬠䭚䮛䯃䭶㕙Ⓧ୯䭡ౝᮡ䬷Ყセ䬨䭚䬢䬷䬺䭗䭙▚䬦䬮䫻I Figure 2. 䮰䮊䮏⹜ᢱ䬺䬙䬓䬵หቯ䬤䭛䬮 䎔䎕䎕䎖 䬽䮆䮺䮘䭶㊂䭡 䏏䏒䏊䎃䏉䏐䏒䏏䎒䏷䏊 䬶␜䬦䬮䮙䯃䮏䮥䮊䮞䎃 䎃 䎃 䎃 䎃 The colors corresponding to decreasing abundance are in the order of red, black, and green. Four biological replicates of each organ and four technical replicates of each digest were performed. Proteins had to be identified in at least three of four technical replicates of one organ type. Two random proteins replicated, for a false positive rate of 0.16% at the protein level. Rat 1 Brains Hearts Kidneys Livers Spleens Aspartate aminotransferase Phosphoglycerate kinase 1 Zero beta globin Heat shock cognate 71 kDa protein Elongation factor 1 alpha 1 Cofilin 1 Tubulin alpha 3 chain Tubulin beta 2A chain Peroxiredoxin 1 Glutamate dehydrogenase 1 Electron transfer flavoprotein subunit alpha Phosphatidylethanolamine binding protein 1 L lactate dehydrogenase A chain Hydroxyacyl coenzyme A dehydrogenase Nucleoside diphosphate kinase B Pyruvate kinase isozymes M1 M2 Gamma enolase Tubulin beta 4 14 3 3 protein zeta delta Aldehyde dehydrogenase Peroxiredoxin 2 Cytochrome b c1 complex subunit 6 ADP ATP translocase 2 Phosphoglycerate mutase 1 Electron transfer flavoprotein subunit beta Table 1. ో 䎘 ེቭ䬶หቯ䬤䭛䬮䮆䮺䮘䭶䬽䮏䮊䮞 䎘䎓 䭡 䏉䏐䏒䏏䎒䏷䏊 䬽㒠㗅䬶 ␜䬦䬮䮱䮀䮏 Rat 2 A total of 130 proteins were identified in all of the rat organs. Many of these common proteins are the housekeeping enzymes that are present in all tissues. Rat 3 Rat 4 Figure 5. Hierarchical clustering of mouse organ data. Figure 1. 䮰䮊䮏䬽⢄⤳䬚䭘䬦䬮⹜ᢱ䭡᷹ቯ䬦䬮⚿ᨐ䬽䭶䮴䮥䮏䭷䮰䮧䎃 Four biological replicates are depicted. Figure 5. 䮥䭭䮀ེቭ䬽᷹ቯ⚿ᨐ䬺䬙䬠䭚㓏ጀ⊛䭶䮰䮀䮆䮱䮺䭷䎃 Despite the fact that only one technical replicate was performed, the data from the same organs clustered correctly. Figure 3. 䮥䭭䮀⹜ᢱ䬽੍ಽᨆ䬺䬙䬓䬵หቯ䬤䭛䬮 䎖䎛䎖 䬽䮆䮺䮘䭶㊂䭡 䏏䏒䏊䎃䏉䏐䏒䏏䎒䏷䏊 䬶␜䬦䬮䮙䯃䮏䮥䮊䮞 Three biological replicates of each organ were analyzed once. METHODS LC/MS Systems: 1D and 2D nanoACQUITY UPLC®/ SYNAPT™ HDMS™ 1D LC System: In 1D and 2D Column: 75 μm x 15 cm BEH C18 (1.7 μm) Gradient: 5-40% B for 90 min at 300 nL/min 100 log fmol/μg Eluent A: 0.1% formic acid in water Eluent B: 0.1% formic acid in acetonitrile 2D LC System: 10 In 2D only First Dimension: Column: 300 μm x 5 cm XBridge ™ C18 (5 μm) 1 Gradient: discontinuous step gradient at 2 μL/min Eluent A: 20 mM ammonium formate pH 10.0 0 Eluent B: acetonitrile Online dilution flow rate: 20 μL/min aqueous 200 400 Protein 600 800 Figure 9: 䎔䎧 䬙䭗䭂 䎕䎧 䭶䮴䮥䮏䭷䮰䮜䭪䬺䭗䭚䮰䮊䮏⣖⹜ᢱ䬽⛘ኻቯ㊂⚿ᨐ The higher abundance proteins were identified by both methods. Figure 6. 䮰䮊䮏⹜ᢱ᷹ቯ⚿ᨐ䬽㓏ጀ⊛䭶䮰䮀䮆䮱䮺䭷 Second Dimension: Column: 75 μm x 15 cm BEH C18 (1.7 μm) Gradient: 5-40% B for 90 min at 300 nL/min 45% ACN Eluent A: 0.1% formic acid in water CONCLUSIONS Eluent B: 0.1% formic acid in acetonitrile 20.8% ACN Sample Preparation: using RapiGest measure Proteins extracted from rat organs surfactant. protein Bradford concentration assay prior to was used reduction x 䮰䮊䮏䬽ེቭ䬚䭘 䎔䎕䎕䎓 એ䬽䮆䮺䮘䭶䬛㜞䬓ౣᕈ䬶หቯ䫺ቯ㊂䬤䭛䬮 to 17.4% ACN with dithiothreitol, alkylation with iodoacetamide, and in-solution 14.5% ACN x ో 䎘 ེቭ䬺䬙䬓䬵 䎔䎖䎓 䬽ㅢ䬨䭚䮆䮺䮘䭶䬛ᬌ䬤䭛䬮 digestion with trypsin. Yeast ADH (P00330) was added as an internal standard for absolute quantitation. 11.1% ACN Online Dilution with RP/RP: on the second dimension To maximize sample recovery trap column from the organic-containing fractions, an aqueous flow was delivered Figure 7. 䮰䮊䮏⣖䬚䭘䬦䬮⹜ᢱ䭡৻ᰴర⋡䬶 䎘 䮜䮰䭶䭾䮮䮺䬺 ಽ䬠䬵ಽᨆ䬦䬮ੑᰴర⋡䬽䭶䮴䮥䮏䭷䮰䮧 x 䭾䮏䭶䮴䮧䎃䎳䎗䎘䎓 䬽䭗䬕䬹ེቭ․⇣⊛䬹䮆䮺䮘䭶䬛ᄙ䬞หቯ䬤䭛ቯ㊂䬤䭛䬮 x ↢‛ቇ⊛ᄌേ䭑䭐䬮䮆䮺䮘䭶㊂䭡ᱜ⏕䬺᷹ቯ䬨䭚䬢䬷䬺䭗䭙↢‛ቇ⊛ᄌൻ䭡ᝒ 䬗䭚䬢䬷䬛น⢻ with the 2nd dimension pump, and mixed with the eluted fraction prior to trapping. x 䎕䎧 䭶䮴䮥䮏䭷䮰䮜䭪䭡↪䬓䭚䬢䬷䬶䭗䭙ᓸ㊂䬹䮆䮺䮘䭶䭡หቯ䬨䭚䬢䬷䬛น⢻䬶䬑䭚 MS Data processing: All data was processed with ProteinLynx Global Server (PLGS 2.4) with IdentityE informatics2. MSE data from the individual 2D chromatograms were processed 1D LC 383 Proteins 341 Proteins 2D LC 761 Proteins separately and then merged into one file prior to database References searching. A rat or mouse database with an equal number of random sequences concatenated onto it was used for the 1. Silva JC, Gorenstein MV, Li GZ, Vissers JP, Geromanos SJ. Absolute quantification of proteins by LCMSE: a virtue of parallel MS acquisition. Mol Cell Proteomics. 5 (2006) 144 2. Li GZ, Vissers JP, Silva JC, Golick D, Gorenstein MV, Geromanos SJ. Database searching and accounting of multiplexed precursor and product ion spectra from the data independent analysis of simple and complex peptide mixtures. Proteomics 9 (2009) 1696 searches to limit the false positive rate to 4%. Hierarchical clustering was performed in Spotfire. Figure 8. 䎔䎧 䬙䭗䭂 䎕䎧 䭶䮴䮥䮏䭷䮰䮜䭪䬺䭗䬲䬵หቯ䬤䭛䬮䮆䮺䮘䭶䬽㊀䬹䭙 䭡␜䬦䬮䮠䮺䮇䭫䭩䭷䮰䮧䎃 89% of the proteins identified by 1D were also found in the 2D analysis. Acknowledgements The authors would like to thank Dr. Keith Fadgen and Dr. Scott Geromanos for their assistance with this work.
© Copyright 2024