
(2014年(年間)・デリバティブ市場)
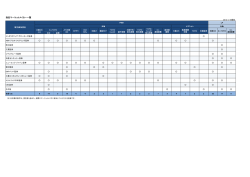
2014年売買状況(概算)
(立会日数244日)
Trading Overview in 2014(Preliminary Estimates)
(No. of Trading Days:244Days)
デリバティブ市場
Derivatives Markets
先物取引
Futures Trading
種
類
Contracts
日経225
Nikkei 225 Futures
日経225mini
Nikkei 225 mini
TOPIX
TOPIX Index Futures
ミニTOPIX
mini-TOPIX Index Futures
JPX日経インデックス400
JPX-Nikkei Index 400 Futures
東証銀行業株価指数
TOPIX Banks Stock Price Index
Futures
TOPIX Core30
TOPIX Core30 Index Futures
東証REIT
TSE REIT Index Futures
日経平均VI
Nikkei 225 VI Futures
日経平均配当指数
Nikkei 225 Dividend Index Futures
NYダウ
DJIA Futures
CNX Nifty
CNX Nifty Index Futures
区 分
Volume/Value
取 引 高 単位
Trading Volume
Units
取 引 金 額 100万円
Trading Value
mil.yen
取 引 高 単位
Trading Volume
Units
取 引 金 額 100万円
Trading Value
mil.yen
取 引 高 単位
Trading Volume
Units
取 引 金 額 100万円
Trading Value
mil.yen
取 引 高 単位
Trading Volume
Units
取 引 金 額 100万円
Trading Value
mil.yen
取 引 高 単位
Trading Volume
Units
取 引 金 額 100万円
Trading Value
mil.yen
取 引 高 単位
Trading Volume
Units
取 引 金 額 100万円
Trading Value
mil.yen
取 引 高 単位
Trading Volume
Units
取 引 金 額 100万円
Trading Value
mil.yen
取 引 高 単位
Trading Volume
Units
取 引 金 額 100万円
Trading Value
mil.yen
取 引 高 単位
Trading Volume
Units
取 引 金 額 100万円
Trading Value
mil.yen
取 引 高 単位
Trading Volume
Units
取 引 金 額 100万円
Trading Value
mil.yen
取 引 高 単位
Trading Volume
Units
取 引 金 額 100万円
Trading Value
mil.yen
取 引 高 単位
Trading Volume
Units
取 引 金 額 100万円
Trading Value
mil.yen
当 年
This Year
前年比(率)
Year-on-Year Change (percentage)
1日平均
Daily Average
25,917,773
-4,989,918 (
-16.1% )
106,220
404,272,275
-14,272,175 (
-3.4% )
1,656,854
199,121,967
-34,738,511 (
-14.9% )
816,074
309,527,801
-6,192,551 (
-2.0% )
1,268,557
20,877,250
-1,836,871 (
-8.1% )
85,563
266,204,472
+10,565,016 (
+4.1% )
1,091,002
4,743,111
+1,586,659 (
+50.3% )
19,439
6,034,205
+2,546,410 (
+73.0% )
24,730
1,606,338
-
(
-
)
64,254
2,067,886
-
(
-
)
82,715
28,700
+12,302 (
+75.0% )
118
52,133
+23,437 (
+81.7% )
214
3,896
-4,487 (
-53.5% )
16
2,592
-2,435 (
-48.4% )
11
132,531
+57,919 (
+77.6% )
543
215,516
+111,715 (
+107.6% )
883
206,536
+168,040 (
+436.5% )
846
45,358
+35,578 (
+363.8% )
186
7,840
-103,804 (
-93.0% )
32
1,927
-24,450 (
-92.7% )
8
70,190
+43,374 (
+161.7% )
288
117,217
+76,418 (
+187.3% )
480
1,188
-
(
-
)
6
916
-
(
-
)
5
1
種
類
Contracts
中期国債
5-year JGB Futures Futures
長期国債
10-year JGB Futures Futures
ミニ長期国債
mini 10-year JGB Futures Futures
超長期国債
SL-JGB(20-year) Futures Futures
オプション取引
Options Trading
種
類
Contracts
日経225オプション
Nikkei 225 Options
TOPIXオプション
TOPIX Options
有価証券オプション
Single Stock Options
長期国債先物オプション
Options on JGB(10-year) Futures
FX取引
Exchange FX Marging Trading
OSE-FX
OSE-FX
デリバティブ合計
Derivatives Total
区 分
Volume/Value
取 引 高 単位
Trading Volume
Units
取 引 金 額 100万円
Trading Value
mil.yen
取 引 高 単位
Trading Volume
Units
取 引 金 額 100万円
Trading Value
mil.yen
取 引 高 単位
Trading Volume
Units
取 引 金 額 100万円
Trading Value
mil.yen
取 引 高 単位
Trading Volume
Units
取 引 金 額 100万円
Trading Value
mil.yen
当 年
This Year
区 分
Volume/Value
取 引 高 単位
Trading Volume
Units
取 引 金 額 100万円
Trading Value
mil.yen
取 引 高 単位
Trading Volume
Units
取 引 金 額 100万円
Trading Value
mil.yen
取 引 高 単位
Trading Volume
Units
取 引 金 額 100万円
Trading Value
mil.yen
取 引 高 単位
Trading Volume
Units
取 引 金 額 100万円
Trading Value
mil.yen
当 年
This Year
前年比(率)
Year-on-Year Change (percentage)
1日平均
Daily Average
0
±0 (
-
)
0
0
±0 (
-
)
0
8,787,820
-353,200 (
-3.9%
)
36,016
1,280,145,326
-36,001,472 (
-2.7%
)
5,246,497
21,171
+3,340 (
+18.7%
)
87
308,596
+51,803 (
+20.2%
)
1,265
5,041
-
(
-
)
28
1,012,878
-
(
-
)
5,565
前年比(率)
Year-on-Year Change (percentage)
1日平均
Daily Average
43,958,283
-13,311,444 (
-23.2% )
180,157
7,112,971
-2,992,537 (
-29.6% )
29,152
320,313
-65,918 (
-17.1% )
1,313
66,719
-47,236 (
-41.5% )
273
1,062,389
-90,692 (
-7.9% )
4,354
10,161
+868 (
+9.3% )
42
1,133,723
-559,029 (
-33.0% )
4,646
119,052
-181,761 (
-60.4% )
488
(立会日数211日)
(No. of Trading Days:211Days)
区 分
Volume/Value
取 引 高 単位
Trading Volume
Units
取 引 金 額 100万円
Trading Value
mil.yen
当 年
This Year
区 分
Volume/Value
取 引 高 単位
Trading Volume
Units
取 引 金 額 100万円
Trading Value
mil.yen
当 年
This Year
前年比(率)
Year-on-Year Change (percentage)
1日平均
Daily Average
1,722,718
-3,935,361 (
-69.6% )
8,165
1,980,746
-4,016,597 (
-67.0% )
9,387
前年比(率)
Year-on-Year Change (percentage)
1日平均
Daily Average
309,728,778
-56,505,284 (
-15.4% )
1,269,380
2,279,298,755
-47,238,886 (
-2.0% )
9,341,388
大証FXを集計している。
2
年間取引高・取引金額
年
立会
日数
合計
取引高
日経225先物取引
取引金額
単位
452,553
取引高
百万円
日経225mini
取引金額
単位
百万円
取引高
TOPIX先物取引
取引金額
単位
百万円
取引高
ミニTOPIX先物取引
取引金額
単位
百万円
取引高
JPX日経インデックス400先物取引
取引金額
単位
百万円
57
1986
279
9,395,829
973,439,114
1987
274
18,462,114
1,976,636,490
1988
273
23,079,622
2,107,900,529
1,892,394
54,274,583
1,887,140
42,082,206
249
39,697,945
2,272,176,377
5,442,647
188,560,477
3,727,512
97,105,140
1990
246
45,456,142
1,997,360,936
13,588,779
394,871,134
3,091,014
71,774,700
1991
246
50,080,848
1,824,641,600
21,643,085
536,729,942
1,676,798
31,555,505
247
35,722,489
1,480,539,073
11,927,329
219,871,647
1,358,423
18,572,560
1993
246
33,531,325
1,882,282,689
8,461,458
162,367,264
2,156,960
33,016,141
1994
247
32,389,563
1,617,181,908
6,208,754
124,219,329
2,623,067
42,089,362
249
33,731,042
1,810,140,202
7,220,900
125,364,156
2,745,614
38,103,379
1996
247
30,477,116
1,733,495,878
7,043,977
148,306,040
2,857,272
45,808,336
1997
245
31,294,117
1,702,004,400
7,484,182
136,973,574
3,035,724
42,173,930
247
30,973,836
1,624,071,968
8,191,130
124,949,657
2,726,985
32,073,283
1999
245
31,353,622
1,497,119,492
9,067,883
153,083,926
3,157,441
44,046,761
2000
248
30,425,950
1,524,631,245
7,426,478
127,178,970
4,148,776
64,243,476
246
31,418,499
1,203,181,085
9,516,875
113,719,098
5,071,946
59,042,056
2002
246
35,648,929
1,066,305,479
10,841,300
109,131,976
7,131,178
69,902,108
2003
245
45,567,437
1,119,680,429
13,058,425
122,822,294
9,359,047
86,192,859
2004
246
52,412,809
1,382,413,046
14,415,884
161,276,227
10,305,017
115,874,760
2005
245
68,723,822
1,764,854,995
17,909,404
228,727,665
12,785,962
167,459,644
2006
248
89,873,993
2,274,834,826
25,151,924
403,287,317
6,348,382
10,334,760
14,907,723
241,403,587
245
142,010,596
2,688,033,134
30,084,781
507,374,982
49,107,059
82,386,064
16,578,731
273,287,971
2008
245
196,191,004
2,220,234,246
35,546,016
423,101,735
95,446,729
112,963,026
18,375,802
215,316,265
2009
243
192,286,792
1,407,250,090
25,368,919
234,274,807
104,738,309
98,303,401
15,190,781
131,286,034
681,248
608,045
1,616,536,946
22,483,722
224,053,361
125,113,769
124,253,355
14,541,751
128,210,374
1,044,343
937,153
1992
1995
1998
2001
2007
599,692
2010
245
2011
245
218,977,071
1,398,720,726
19,294,064
181,466,598
117,905,210
110,493,965
14,608,165
119,503,869
621,569
506,955
2012
248
234,305,669
1,699,336,029
19,523,347
178,390,355
130,443,680
119,147,186
15,192,439
116,687,825
2,148,039
1,654,849
245
366,234,062
2,326,537,641
30,907,691
418,544,451
233,860,478
315,720,353
22,714,121
255,639,456
3,156,452
3,487,794
244
309,728,778
2,279,298,755
25,917,773
404,272,275
199,121,967
309,527,801
20,877,250
266,204,472
4,743,111
6,034,205
2014
百万円
739,664
223,226,256
2013
取引金額
単位
44,551,524
1985
1989
取引高
1,606,338
2,067,886
3
年
立会
日数
東証銀行業株価指数先物取引
取引高
TOPIX Core30先物取引
取引金額
単位
取引高
百万円
東証REIT指数先物取引
取引金額
単位
百万円
取引高
日経平均VI先物取引
取引金額
単位
百万円
取引高
日経平均配当指数先物取引
取引金額
単位
百万円
取引高
取引金額
単位
百万円
NYダウ先物取引
取引高
CNX Nifty先物取引
取引金額
単位
百万円
1985
57
1986
279
1987
274
1988
273
1989
249
1990
246
1991
246
1992
247
1993
246
1994
247
1995
249
1996
247
1997
245
1998
247
1,127
4,686
1999
245
25,719
117,281
2000
248
50,545
192,752
246
13,298
39,379
2002
246
141,751
257,791
2003
245
140,331
204,472
246
601
1,517
2005
245
0
0
2006
248
0
0
245
0
0
2008
245
1,218
2,694
202,189
124,576
89,922
95,665
2009
243
0
0
362,882
172,809
52,799
46,803
245
5,808
8,338
242,105
122,040
46,696
44,428
19,553
3,225
2011
245
0
0
91,715
39,902
51,457
51,127
61,050
10,733
2012
248
3,500
3,987
10,150
4,009
60,388
58,141
12,959
2,654
123,512
24,475
19,154
24,588
2013
245
16,398
28,696
8,383
5,028
74,612
103,801
38,496
9,779
111,644
26,378
26,816
40,798
2014
244
28,700
52,133
3,896
2,592
132,531
215,516
206,536
45,358
7,840
1,927
70,190
117,217
2001
2004
2007
2010
取引高
取引金額
単位
1,188
百万円
916
4
年
立会
日数
中期国債先物取引
取引高
長期国債先物取引
取引金額
単位
取引高
百万円
ミニ長期国債先物取引
取引金額
単位
452,553
取引高
百万円
超長期国債先物取引
取引金額
単位
取引高
百万円
取引金額
単位
百万円
44,551,524
1985
57
1986
279
9,395,829
973,439,114
1987
274
18,261,634
1,963,988,066
1988
273
18,719,772
1,971,308,937
39,459
4,181,358
1,980,775,463
28,734
3,133,896
1,524,329,532
12,924
1,195,948
1989
249
18,941,890
1990
246
16,306,571
1991
246
12,822,430
1,249,431,976
6,575
610,896
1,237,060,934
3,972
394,329
1,683,854,689
3,106
336,427
1992
247
11,868,127
1993
246
15,162,159
1994
247
12,999,698
1,436,062,471
3,194
352,888
14,010,374
1,637,941,252
2,734
333,929
1995
249
1996
247
261,172
29,431,897
12,450,925
1,502,363,695
2,242
285,471
1997
245
118,447
13,546,808
11,873,549
1,502,887,181
2,167
301,682
247
195,207
22,559,134
10,784,966
1,438,908,296
123
18,039
1999
245
111,975
13,000,474
9,727,855
1,280,832,413
0
0
2000
248
112,226
12,198,013
9,909,127
1,314,859,552
0
0
241,733
7,377,641
1,026,241,484
0
0
4,304
6,356,612
885,046,684
0
0
5,041
1,012,878
1998
2001
246
2,198
2002
246
39
2003
245
0
0
6,465,073
908,107,752
2004
246
0
0
8,025,268
1,103,475,299
2005
245
0
0
9,844,617
1,366,287,273
2006
248
0
0
12,049,979
1,615,903,304
245
0
0
13,545,239
1,820,504,497
2008
245
0
0
10,639,934
1,461,996,405
2009
243
0
0
6,765,074
936,097,517
46
245
0
0
8,021,458
1,129,835,241
0
0
2011
245
0
0
6,883,210
971,088,504
7,734
110,072
2012
248
0
0
8,865,284
1,271,831,911
32,065
457,670
2013
245
0
0
9,141,020
1,316,146,799
17,831
256,793
2014
244
0
0
8,787,820
1,280,145,326
21,171
308,596
2007
2010
632
5
年
立会
日数
日経225オプション取引
取引高
TOPIXオプション取引
取引金額
単位
取引高
百万円
有価証券オプション取引
取引金額
単位
取引高
百万円
長期国債先物オプション取引
取引金額
単位
百万円
取引高
取引金額
単位
立会日数
百万円
1985
57
1986
279
1987
274
1988
273
1989
249
6,610,435
1,840,860
4,805,568
733,106
1990
246
9,187,741
3,561,037
462,627
222,941
1991
246
11,835,611
5,512,317
120,280
117,262
1,850,363
670,653
4,096,138
48,576
8,703
1,140,541
532,568
2,000,618
37,831
8,037
1,506,836
699,509
2,287,808
取引所外国為替証拠金取引
取引高
取引金額
単位
百万円
1,388,756
1992
247
9,256,981
1993
246
6,090,375
1994
247
4,273,641
1,175,591
20,078
3,396
1,691,834
836,686
1,432,335
16,742
8,963
2,017,031
964,065
928,845
13,444
3,112
1,975,274
755,581
1995
249
5,174,571
1996
247
3,924,543
1997
245
4,910,359
1,270,830
9,356
2,639
292,990
15,424
2,002,357
700,095
1,166,982
655
175
445,861
15,432
1,848,851
618,606
1,374,619
2,030
603
896,225
25,684
1,137,319
565,155
1998
247
5,230,046
1999
245
5,753,760
2000
248
5,715,856
1,372,094
2,630
1,008
484,402
31,457
1,271,874
312,413
1,294,636
7,623
3,756
430,228
13,638
1,062,235
259,244
1,141,787
93,249
23,551
325,682
5,437
1,036,395
201,591
2001
246
6,953,222
2002
246
9,428,235
2003
245
14,958,100
1,721,239
98,137
13,912
341,986
3,555
972,518
292,547
1,029,525
17,643
6,863
1,655,897
34,910
1,262,994
336,137
1,434,215
20,004
17,338
1,408,785
36,121
1,699,037
357,161
2004
246
16,560,874
2005
245
24,894,389
2006
248
28,230,767
2,795,411
18,354
13,544
944,813
24,121
2,060,624
500,929
3,328,362
19,555
11,864
589,598
14,397
2,804,811
634,373
4,997,450
62,045
57,296
623,210
14,208
2,442,598
735,479
2007
245
29,181,438
2008
245
32,126,060
2009
243
34,986,005
5,203,410
52,523
20,871
1,071,565
14,623
2,433,217
573,041
118
583,019
647,423
4,311,462
120,040
21,588
1,225,746
8,151
1,999,282
391,949
260
4,570,824
4,336,016
5,080,245
21,342
7,699
1,832,952
11,984
1,853,672
342,797
260
10,552,396
10,006,240
2010
245
43,791,011
2011
245
45,192,519
2012
248
48,763,723
4,923,130
22,683
6,171
554,147
4,247
2,283,839
306,360
260
6,246,760
5,808,463
245
57,269,727
10,105,509
386,231
113,956
1,153,081
9,292
1,692,752
300,814
260
5,658,079
5,997,343
244
43,958,283
7,112,971
320,313
66,719
1,062,389
10,161
1,133,723
119,052
211
1,722,718
1,980,746
2013
2014
6
© Copyright 2024