
シティグループ - 日本経済新聞
 下記は、1月15日(アメリカ時間)に発表されたプレスリリースの翻訳です。
シティグループ、2014年第4四半期の決算を発表
2014年第4四半期の一株当たり利益は0.06ドル
当期利益は350百万ドル
収益は178億ドル
法務関連費用及び事業再編費用は合計35億ドル
正味利息マージンは2.92%に増加
正味貸倒損失は22億ドル、前年同期から12%減少
繰延税金資産を約200百万ドル使用、
2014年通年で繰延税金資産を約31億ドル使用
バーゼルIII普通株式等Tier 1資本比率は10.5%1
バーゼルIIIにおける補完的指標としてのレバレッジ比率の試算は6.0%2
一株当たり純資産額は66.16ドル
一株当たり有形純資産額3は56.83ドル
シティ・ホールディングスの資産は 980 億ドル、前年同期から 16%減少
シティグループの当四半期末の総資産の 5%に相当
2015 年 1 月 15 日ニューヨーク発: シティグループ・インクは本日、2014 年第 4 四半期の収益は 178 億ド
ル、当期利益は 350 百万ドル、希薄化後株式一株当たり 0.06 ドルと発表しました。これに対し、2013 年第 4
四半期の収益は 178 億ドル、当期利益は 25 億ドル、希薄化後株式一株当たり 0.77 ドルでした。当四半期に
おける法務関連費用及び事業再編費用は合計 35 億ドルでした。これに対して、前年同期の法務関連費用及び
事業再編費用は 10 億ドルでした。
CVA/DVA4は 2014 年第 4 四半期において 7 百万ドル(税引後で 4 百万ドル)でした。これに対して、前年同期
の CVA/DVA はマイナス 164 百万ドル(税引後でマイナス 100 百万ドル)でした。2013 年第 4 四半期の業績に
は、ブラジルにおけるシティのクレディカード事業の売却に関連する 189 百万ドルの税引後効果及びメキシ
コにおける不正に係る正味損失に関する 235 百万ドルの税引後費用5も含まれていました。CVA/DVA 及び 2013
年第 4 四半期におけるこれらの項目の影響を除くと、希薄化後一株当たり利益は、0.06 ドルでした。これに
対し、前年同期の希薄化後一株当たり利益は、0.82 ドルでした。
「2014 年の全体的な業績は望んでいたほどではありませんでしたが、最優先事項を大きく進めることができ
ました。2014 年は、ターゲットとしていた法人顧客に係るマーケットシェアを増やし、コア貸出残高を積み
増し、純利息収益及び正味利息マージンの双方を 2013 年の水準より改善させました。シティ・ホールディン
グスは、これを設けて以来初めて通年で黒字となり、繰延税金資産の使用を加速させました。資本計画の策
定プロセスを強化し、シティはより安全で強靱な金融機関となりましたが、これは資本比率、レバレッジ比
率及び流動性比率の増加によって表れています。年間を通じていくつかの困難な決断をしましたが、これに
より、2015 年における成功を収めることができる事業基盤が整ったものと考えています。」とシティグループ
の最高経営責任者、マイケル・コルバットは述べています。
シティグループの2014年通年の収益は769億ドル、当期利益は73億ドルでした。これに対し、2013年通年の収
益は764億ドル、当期利益は137億ドルでした。2014年通年の業績にはマイナス390百万ドル(税引後でマイナ
ス240百万ドル)、2013年通年の業績にはマイナス342百万ドル(税引後でマイナス213百万ドル)のCVA/DVA
が含まれています。シティグループの2014年通年の業績には住宅ローン担保証券及び債務担保証券に関する
請求に係る和解費用638億ドル(税引後で37億ドル)が、2013年通年の業績にはクレディカード事業の売却に
関する利益及び不正に係る正味損失が、それぞれ含まれています。また、シティグループは、2014年第1四半
期において2つの州における法人税に関する税制改正による210百万ドルの税務費用を、2013年第3四半期にお
いて税務監査項目の処理に関連する176百万ドルの税効果を、それぞれ計上しました。CVA/DVAの影響を除く
と、2014年のシティグループの収益は773億ドルであり、前年から1%増加しました。CVA/DVA、2014年の住宅
ローン担保証券等に関する和解、2013年のクレディカード事業の売却及び不正に係る正味損失の影響、並び
に2014年及び2013年の税務項目7を除くと、2014年の当期利益は115億ドルであり、2013年から16%減少しま
した。これは、収益の増加及び正味貸倒損失の減少が、営業費用の増加、貸倒引当金の正味戻入額の減少及
び実効税率の上昇により相殺されたことによるものです。
第4四半期及び通年の決算
シティグループ
(単位:百万ドル、ただし1株当たり の金額を除き ます)
シティコープ
シティ・ホールディングス
収益合計
調整後収益
(a )
費用
調整後費用
(a )
正味貸倒損失
調整後与信費用
(a )
法人税等控除前の継続事業からの利益(損失)
法人税等
継続事業からの利益
非継続事業からの当期利益(損失)
非支配持分
シテ ィグ ル ープ当期利益
調整後当期利益
(a )
(c)
バ ーゼル III普通株式等T ie r 1 資本比率
(d )
バ ーゼル IIIにおける 補完的指標として のレバ レッジ 比率の試算
平均普通株式株主持分利益率
1株当たり 純資産
1株当たり 有形純資産額
(e )
変動率(%)
2014年度
vs
2013年度
2014年
第4四半期
2014年
第3四半期
2013年
第4四半期
2014年度
2013年度
16,504
1,308
18,016
1,588
16,472
1,307
-8%
-18%
-
71,067
5,815
71,853
4,566
-1%
27%
$17,812
$19,604
$17,779
-9%
-
$76,882
$76,419
1%
$17,805
$19,975
$17,943
-11%
-1%
$77,272
$76,761
1%
$14,426
$12,955
$12,292
11%
17%
$55,051
$48,408
14%
$14,426
$12,955
$11,932
11%
21%
$51,302
$48,048
7%
7%
20%
-12%
34%
2,248
(441)
(b)
貸倒引当金繰入額/(戻入額)
保険給付準備金繰入額
与信費用合計
変動率(%)
2014年
2014年
第4四半期
第4四半期
vs
vs
2014年
2013年
第3四半期
第4四半期
2,097
(552)
2,547
(670)
8,973
(2,307)
10,463
(2,779)
-14%
17%
206
205
195
-
6%
801
830
-3%
$2,013
$1,750
$2,072
15%
-3%
$7,467
$8,514
-12%
$2,013
$1,750
$2,072
15%
-3%
$7,412
$8,514
-13%
$1,373
991
$4,899
1,985
$3,415
1,090
-72%
-50%
-60%
-9%
$14,364
6,864
$19,497
5,867
-26%
17%
$382
(1)
31
$2,914
(16)
59
$2,325
181
50
-87%
94%
-47%
-84%
NM
-38%
$7,500
(2)
185
$13,630
270
227
-45%
NM
-19%
$350
$2,839
$2,456
-88%
-86%
$7,313
$13,673
-47%
$346
$3,067
$2,602
-89%
-87%
$11,489
$13,756
-16%
10.5%
6.0%
0.4%
$66.16
$56.83
10.7%
6.0%
5.3%
$67.11
$57.53
10.1%
5.4%
4.8%
$65.23
$55.31
-1%
-1%
1%
3%
注:詳細については、本プレスリリース末尾の付表及び脚注をご参照下さい。
(a) 全期についてCVA/DVAを、2014年第2四半期について住宅ローン担保証券等に関する和解の影響を、2013年第4四半期について不正に係る正味損失及びクレディカード事業の売却の影響を、2014年第1四半期及び2013年第3四半期に
ついて税務項目を、対象となる期に応じて除きます。詳細については、付表Bをご参照下さい。
(b) 未実行貸出約定に関する貸倒引当金を含みます。
(c) 詳細については、付表D及び脚注1をご参照下さい。
(d) 詳細については、脚注2をご参照下さい。
(e) 詳細については、付表E及び脚注3をご参照下さい。
シティグループ
シティグループの収益は、前年同期と横ばいで、2014 年第 4 四半期は 178 億ドルでした。CVA/DVA の影響を
除くと、収益は前年同期から 1%減少し、178 億ドルになりました。これは、シティコープにおける収益の
1%の減少が、シティ・ホールディングスにおける収益の微増により一部相殺されたことによるものです。
シティグループの当期利益は、前年同期の 25 億ドルから減少し、2014 年第 4 四半期は 350 百万ドルとなり
ました。前年同期と当四半期における CVA/DVA 並びに前年同期のクレディカード事業の売却及び不正に係る
正味損失の影響を除くと、シティグループの当期利益は、前年同期の 26 億ドルから、346 百万ドルになりま
した。これは、主として営業費用の増加及び実効税率の上昇によるものです。
2 シティグループの営業費用は、前年同期の 119 億ドルから 21%増加し、2014 年第 4 四半期は 144 億ドルでし
た(不正に係る正味損失の影響を除きます。)。これは、規制及び法令遵守に係る費用の増加並びに取引高の
増加に関連する費用の増加に加えて、法務関連費用及び事業再編費用が増加したことによるものですが、継
続的な効率性の向上及び外貨換算の影響により一部相殺されました。2014 年第 4 四半期の営業費用には、29
億ドルの法務関連費用及び 655 百万ドルの事業再編費用が含まれています。これに対して、前年同期の法務
関連費用は 809 百万ドル、事業再編費用は 234 百万ドルでした。
シティグループの与信費用は、2014 年第 4 四半期において、前年同期から 3%減少して 20 億ドルでした。こ
れは主として 299 百万ドルの正味貸倒損失の改善を反映したものですが、貸倒引当金の正味戻入額の減少に
より一部相殺されました。
シティグループの実効税率は、(CVA/DVA の影響を除くと)前年同期の 32%から上昇し、当四半期は 72%と
なりました。これは、当四半期において控除対象外の法務関連費用が大幅に増加したことによるものです。
シティグループの貸倒引当金は、当四半期末において 160 億ドルで、貸出金総額の 2.50%でした。これに対
して前年同期末は 196 億ドル(貸出金総額の 2.97%)でした。当四半期の貸倒引当金の正味戻入額は、441 百
万ドルでした(これに対して前年同期は 670 百万ドルでした。
)
。当四半期の不稼働資産の総額は 2013 年第 4
四半期から 22%減少して 74 億ドルとなり、シティグループの資産の質は引き続き改善しました。法人向け未
収利息非計上貸出金は 38%減少して 12 億ドル、個人向け未収利息非計上貸出金は 17%減少して 59 億ドルと
なりました。
シティグループの貸出金は、当四半期末において 6,450 億ドルであり、前年同期から 3%減少しました。実
質ドルベース8において、シティグループの貸出金は 1%減少しましたが、これは、主に北米の住宅ローン・
ポートフォリオの圧縮によりシティ・ホールディングスの貸出金が継続的に減少し、シティコープにおける
3%の貸出金の増加が相殺されたことによるものです。
シティグループの預金残高は、当四半期末において 8,990 億ドルであり、前年同期から 7%減少しました。
実質ドルベースにおいて、シティグループの預金残高は 4%減少しましたが、これは、主として、日本におけ
るリテールバンク事業売却の合意の結果として、アジアにおける 210 億ドルの預金残高を売却目的保有の取
扱いとすることを反映しその他負債に再区分したこと、及びシティ・ホールディングスの預金残高が継続的
に減少したことによるものです。
シティグループの一株当たり純資産額は、当四半期末において前年同期から 1%増加して 66.16 ドル、一株
当たり有形純資産額は、当四半期末において前年同期から 3%増加して 56.83 ドルでした。当四半期末におい
て、シティグループのバーゼル III 普通株式等 Tier 1 資本比率は、前年同期の 10.1%9から増加して 10.5%
となりました。シティグループの 2014 年第 4 四半期のバーゼル III における補完的指標としてのレバレッジ
比率の試算は、前年同期の 5.4%から増加して 6.0%でした。
3 シティコープ
(単位:百万ドル )
グローバル個人金融部門
インスティテューショナル・クライアント・グループ
本社事項、本社業務/その他
収益合計
調整後収益
(a )
費用
調整後費用
(a )
正味貸倒損失
(b)
貸倒引当金繰入額/(戻入額)
保険給付準備金繰入額
与信費用合計
当期利益
調整後当期利益
(a )
2014年
第4四半期
9,442
7,199
(137)
2014年
第3四半期
9,637
8,371
8
2013年
第4四半期
9,469
7,044
(41)
変動率(%)
2014年
2014年
第4四半期
第4四半期
vs
vs
2014年
2013年
第3四半期
第4四半期
-2%
-14%
2%
NM
NM
変動率(%)
2014年度
37,753
33,267
47
2013年度
38,165
33,567
121
2014年度
vs
2013年度
-1%
-1%
-61%
-1%
$16,504
$18,016
$16,472
-8%
-
$71,067
$71,853
$16,492
$18,332
$16,637
-10%
-1%
$71,410
$72,198
-1%
$13,661
$12,063
$10,799
13%
27%
$47,336
$42,438
12%
$13,661
$12,063
$10,439
13%
31%
$47,336
$42,078
12%
1,867
1,750
1,812
7%
3%
7,327
7,393
45%
6%
-74%
6%
(1,404)
199
22%
-2%
$6,122
(226)
55
$1,696
(408)
52
(130)
52
$1,394
$1,734
(736)
212
$6,869
-1%
-91%
-6%
-11%
$192
$2,601
$2,888
-93%
-93%
$10,683
$15,606
-32%
$185
$2,795
$3,034
-93%
-94%
$11,104
$15,690
-29%
7,490
2,363
3,236
3,540
(137)
8,150
2,887
3,395
3,892
8
7,199
2,411
3,550
3,518
(41)
-8%
-18%
-5%
-9%
NM
4%
-2%
-9%
1%
NM
31,940
11,145
13,486
14,792
47
31,512
11,514
13,997
15,054
121
1%
-3%
-4%
-2%
-61%
1,751
168
535
869
(3,105)
2,063
632
646
1,123
(1,598)
1,321
413
806
804
(256)
-15%
-73%
-17%
-23%
-94%
33%
-59%
-34%
8%
NM
8,286
2,145
2,569
3,670
(5,383)
7,214
2,497
3,194
3,721
(806)
15%
-14%
-20%
-1%
NM
1,745
572
889
1,780
576
928
1,763
573
932
-2%
-1%
-4%
-1%
-5%
1,745
572
889
1,763
573
932
-1%
-5%
(a )
調整後収益
北米
ヨーロッパ・中東・アフリカ
ラテンアメリカ
アジア
本社事項、本社業務/その他
(a )
継続事業からの調整後利益
北米
ヨーロッパ・中東・アフリカ
ラテンアメリカ
アジア
本社事項、本社業務/その他
期末資産 (単位:十億ドル)
期末貸出金 (単位:十億ドル)
期末預金 (単位:十億ドル)
注:詳細については、本プレスリリース末尾の付表及び脚注をご参照下さい。
(a) 全期についてCVA/DVAを、2013年第4四半期について不正に係る正味損失を、2013年第4四半期についてクレディカード事業の売却の影響を、2014年第1四半期及び2013年第3四半期について税務項目
を、対象となる期に応じて除きます。詳細については、付表Bをご参照下さい。
(b) 未実行貸出約定に関する貸倒引当金を含みます。
シティコープ
シティコープの収益は、2014 年第 4 四半期において、前年同期と横ばいの 165 億ドルでした。インスティ
テューショナル・クライアント・グループ(ICG)において計上された CVA/DVA は、前年同期はマイナス 165
百万ドル(税引後マイナス 100 百万ドル)でしたが、2014 年第 4 四半期においては 12 百万ドル(税引後 7 百
万ドル)でした。CVA/DVA の影響を除くと、シティコープの収益は、2013 年第 4 四半期から 1%減少しました。
これは、ICG 及びグローバル個人金融部門(GCB)における収益は概ね横ばいであったこと、並びに本社事項、
本社業務/その他の収益が減少したことによるものです。本社事項、本社業務/その他の収益は、主として
売却可能有価証券の売却益の減少及びヘッジ取引によりマイナス 137 百万ドルとなりましたが、これに対し、
前年同期は、マイナス 41 百万ドルでした。
シティコープの当期利益は、前年同期の 29 億ドルに対し、192 百万ドルとなりました。CVA/DVA 並びに前年
同期のクレディカード事業の売却及び不正に係る正味損失の影響を除くと、シティコープの当期利益は、前
年同期の 30 億ドルに対し、185 百万ドルとなりました。これは、主として営業費用の増加及び実効税率の上
昇によるものです。
シティコープの営業費用は、(不正に係る正味損失の影響を除くと)前年同期から 31%増加して 137 億ドル
となりました。これは、主として法務関連費用(主として本社事項、本社業務/その他において計上されて
います。)の増加、事業再編費用の増加、規制及び法令遵守に係る費用の増加、並びに取引高の増加に関連
する費用によるものですが、継続的な効率性の向上及び外貨換算の影響により一部相殺されました。2014 年
第 4 四半期の営業費用には、28 億ドルの法務関連費用及び 637 百万ドルの事業再編費用が含まれています。
これに対して、前年同期の法務関連費用は 159 百万ドル、事業再編費用は 204 百万ドルでした。
4 シティコープの与信費用は、2014 年第 4 四半期において、前年同期から 2%減少して 17 億ドルとなりました。
貸倒引当金の正味戻入額の増加及び北米 GCB における正味貸倒損失の減少は、ICG 及び米国外 GCB における正
味貸倒損失の増加によって一部相殺されました。シティコープの 90 日以上延滞個人向け貸出金は、前年同期
比で 10%減少して 27 億ドルとなり、90 日以上延滞率は貸出金の 0.90%に改善しました。
シティコープの期末貸出金は、前年同期と横ばいの 5,720 億ドルでした。法人向け貸出金は 1%増加して
2,740 億ドルとなり、個人向け貸出金は 2%減少して 2,970 億ドルとなりました。実質ドルベースで、シティ
コープの期末貸出金は前年同期比で 3%増加し、法人向け貸出金は 4%増加し、個人向け貸出金は 2%増加し
ました。
グローバル個人金融部門
(単位:百万ドル )
変動率(%)
5,091
4,989
4,874
2014年
第4四半期
vs
2014年
第3四半期
2%
305
347
358
-12%
ラテンアメリカ
2,255
2,357
2,403
アジア
1,791
1,944
収益合計
$9,442
費用
19,645
19,776
2014年度
vs
2013年度
-1%
-15%
1,358
1,449
-6%
-4%
-6%
9,204
9,316
-1%
1,834
-8%
-2%
7,546
7,624
-1%
$9,637
$9,469
-2%
-
$37,753
$38,165
-1%
$5,345
$5,281
$5,361
1%
-
$21,277
$21,187
-
1,746
1,738
1,787
-
-2%
7,051
7,211
29%
NM
(1,185)
2014年
第4四半期
北米
ヨーロッパ・中東・アフリカ
正味貸倒損失
(a)
貸倒引当金繰入額/(戻入額)
変動率(%)
2014年
第4四半期
vs
2013年
第4四半期
4%
(268)
2014年
第3四半期
2013年
第4四半期
(375)
(9)
2014年度
2013年度
(632)
-2%
-88%
55
52
52
6%
6%
199
212
-6%
与信費用合計
$1,533
$1,415
$1,830
8%
-16%
$6,065
$6,791
-11%
当期利益
$1,666
$1,928
$1,539
-14%
8%
$6,912
$6,746
2%
1,139
1,185
858
-4%
33%
4,421
3,910
13%
NM
NM
保険給付準備金繰入額
継続事業からの利益
北米
ヨーロッパ・中東・アフリカ
(38)
1
(1)
ラテンアメリカ
256
338
371
-24%
-31%
アジア
312
413
313
-24%
カード平均貸出金
141
142
145
リテール・バンキング平均貸出金
156
158
151
平均預金残高
327
333
329
24
30
100
94
(7)
35
NM
1,204
1,337
-10%
-
1,320
1,481
-11%
-
-3%
142
141
1%
-1%
3%
156
147
6%
-2%
-1%
331
327
1%
23
-19%
3%
108
103
5%
99
6%
1%
375
365
3%
(単位:十億ドル)
投資商品の販売高
カード取扱高
注:詳細については、本プレスリリース末尾の付表及び脚注をご参照下さい。
(a) 未実行貸出約定に関する貸倒引当金を含みます。
グローバル個人金融部門
GCB の収益は、北米における成長が報告値ベースの米国外収益の減少により相殺されたことから、前年同期
と横ばいの 94 億ドルとなりました。北米における成長及び米国外収益の 1%の増加により、実質ドルベース
では 3%増加しました。
GCB の当期利益は、前年同期から 8%増加して 17 億ドルとなりました。これは、与信費用の減少を反映して
います。営業費用は横ばいの 53 億ドルとなりましたが、実質ドルベースでは 3%増加しました。これは、主
に事業再編費用の増加の影響を反映していますが、継続的な経費削減により一部相殺されました。
北米 GCB の収益は、前年同期から 4%増加して 51 億ドルとなりました。これは、リテール・バンキングの収
益の増加を反映していますが、シティ・リテール・サービスの収益の減少により一部相殺されました。リ
テール・バンキングの収益は、2013 年第 4 四半期から 25%増加して 14 億ドルとなりました。これは、平均
貸出金が 10%増加したこと及び平均預金残高が 1%増加したこと、並びに当四半期における一定のオンバラ
ンスの住宅ローンの売却に関連する約 130 百万ドルの売却益を反映するものです。シティブランドのカード
の収益は前年同期と横ばいの 21 億ドルでした。これは、取扱高の 4%の増加及びスプレッドの改善が平均貸
出金減少の影響の大部分を相殺したことによるものです。シティ・リテール・サービスの収益は 3%減少して
5 16 億ドルとなりました。これは、主に利回りの上昇及び与信の改善による契約パートナーへの支払の増加を
反映したものです。
北米 GCB の当期利益は、2013 年第 4 四半期から 33%増加して 11 億ドルとなりました。これは、収益の増加
及び与信費用の減少によるものですが、営業費用の増加により一部相殺されました。営業費用は、前年同期
から 1%増加して 25 億ドルとなりました。これは、事業再編費用の増加及びマーケティング費用の増加が継
続的な効率性の向上により一部相殺されたことによります。
北米 GCB の与信の質は、引き続き改善し、正味貸倒損失は前年同期から 8%減少して 10 億ドルとなりました。
正味貸倒損失は、前年同期から、シティブランドのカード(13%減少して 514 百万ドル)及びシティ・リ
テール・サービス(2%減少して 463 百万ドル)において改善しました。各カード・ポートフォリオの継続的
な改善により、2014 年第 4 四半期の引当金戻入額は 2013 年第 4 四半期から 160 百万ドル増加して、244 百万
ドルでした。延滞率は、シティブランドのカード及びシティ・リテール・サービスの両方において前年同期
から改善しました。
米国外 GCB の収益は、2013 年第 4 四半期から 5%減少して 44 億ドルとなりました。実質ドルベースで、収益
は 2013 年第 4 四半期から 1%増加しました。ラテンアメリカにおける収益は、主としてメキシコにおける取
引高の増加により 1%増加して 23 億ドルとなりました。アジアにおける収益は、主として取引高の増加によ
り 1%増加して 18 億ドルとなりましたが、スプレッドの縮小及び一定の市場における規制の変更による影響
により一部相殺されました。ヨーロッパ・中東・アフリカにおける収益は、取引高の増加がスプレッドの縮
小により相殺されたため 2%減少して 305 百万ドルとなりました。
米国外 GCB の当期利益は、前年同期から 23%減少して 527 百万ドルとなり、実質ドルベースで 18%減少しま
した。これは、実質ドルベースで、若干増加した収益が営業費用の増加により相殺されたためです。2014 年
第 4 四半期における営業費用は、実質ドルベースで 5%増加(報告ベースで 1%減少)しました。これは、事
業再編費用の増加、並びに事業成長の影響及び法人税以外の税費用の増加によるものですが、継続的な効率
性の向上により一部相殺されました。実質ドルベースでは、与信費用はアジアにおける引当金の戻入れがラ
テンアメリカ及びヨーロッパ・中東・アフリカにおける与信費用の増加により相殺されたため、前年同期か
ら 1%増加しました。
米国外 GCB の与信の質は、安定しています。正味貸倒損失は、8%増加して 733 百万ドルとなりました。これ
にはメキシコの住宅建設業者に係るエクスポージャーに関連する約 70 百万ドルの償却が含まれますが、過去
に計上された貸倒引当金の関連する戻入れにより相殺されたため、当期の与信費用には影響しませんでした。
米国外における正味貸倒損失率は、2014 年第 4 四半期において平均貸出金の 2.09%でした。これに対し、前
年同期は 1.93%でした。メキシコの住宅建設業者に係るエクスポージャーに関連する償却を除いた場合、米
国外における正味貸倒損失率は 1.88%に改善しました。
6 インスティテューショナル・クライアント・ グループ
(単位:百万ドル )
トレジャリー・アンド・トレード・ソリューション
投資銀行業務
プライベートバンク
(a)
法人貸付業務
銀行業務合計
債券市場業務
株式市場業務
セキュリティーズ・サービス
その他
マーケッツ&セキュリティーズ・サービス合計
商品収益
(b )
2014年度
7,882
4,703
2013年度
7,819
4,411
11%
9%
1%
-16%
2,653
1,742
16,980
11,815
2,487
1,513
16,230
13,322
7%
15%
5%
-11%
-38%
-4%
18%
-30%
-3%
4%
62%
-9%
2,776
2,333
(410)
16,514
2,818
2,272
(443)
17,969
-1%
3%
7%
-8%
-17%
-3%
-5%
-17%
NM
NM
NM
2014年
第3四半期
1,965
1,248
2013年
第4四半期
1,938
1,146
666
431
4,122
1,988
663
442
4,318
2,981
599
395
4,078
2,375
-2%
-5%
-33%
471
574
(54)
2,979
763
600
(66)
4,278
484
554
(143)
3,270
86
7,187
12
$8,596
$7,348
91
8,687
(316)
(139)
7,209
(165)
変動率(%)
2014年度
vs
2013年度
1%
7%
2014年
第4四半期
1,960
1,065
$7,101
貸出金のヘッジに係る利益/(損失)
収益合計(CVA/DVAを除く )
CVA/DVA
変動率(%)
2014年
2014年
第4四半期
第4四半期
vs
vs
2014年
2013年
第3四半期
第4四半期
1%
-15%
-7%
$33,494
116
33,610
(343)
$34,199
(287)
33,192
(345)
-2%
NM
-1%
1%
収益合計
$7,199
$8,371
$7,044
-14%
2%
$33,267
$33,567
-1%
費用
$5,035
$5,040
$5,245
-
-4%
$19,960
$20,218
-1%
$5,035
$5,040
$4,885
-
3%
$19,960
$19,858
1%
調整後費用
(c )
正味貸倒損失
(d)
貸倒引当金繰入額/(戻入額)
与信費用合計
当期利益
調整後当期利益
(c )
121
42
12
(33)
25
(121)
NM
NM
NM
NM
276
(219)
182
(104)
52%
NM
$163
$(21)
$(96)
NM
NM
$57
$78
-27%
$1,637
$2,291
$1,450
-29%
13%
$9,410
$9,304
1%
$1,630
$2,485
$1,785
-34%
-9%
$9,621
$9,753
-1%
2,399
3,161
2,325
-24%
3%
12,295
11,736
5%
2,058
981
1,749
2,540
1,038
1,948
2,053
1,147
1,684
-19%
-5%
-10%
-14%
4%
9,787
4,282
7,246
10,065
4,681
7,430
-3%
-9%
-2%
612
206
279
878
631
308
463
414
435
-30%
-67%
-9%
32%
-50%
-36%
3,865
2,152
1,365
3,304
2,462
1,857
17%
-13%
-26%
557
710
491
-22%
13%
2,350
2,240
5%
(c )
調整後収益
北米
ヨーロッパ・中東・アフリカ
ラテンアメリカ
アジア
継続事業からの調整後利益
北米
(c )
ヨーロッパ・中東・アフリカ
ラテンアメリカ
アジア
注:詳細については、本プレスリリース末尾の付表及び脚注をご参照下さい。
(a) 貸出金のヘッジに係る利益/(損失)を除いています。詳細については、脚注10をご参照下さい。
(b) CVA/DVA及び貸出金のヘッジに係る利益/(損失)を除いています。
(c) 全期についてCVA/DVAを、2013年第4四半期について不正に係る正味損失を、対象となる期に応じて除いています。詳細については、付表Bをご参照下さい。
(d) 未実行貸出約定に関する貸倒引当金を含みます。
インスティテューショナル・クライアント・グループ ICG 収益は、前年同期から 2%増加して 72 億ドルとなりました。CVA/DVA の影響を除くと、収益は前年同期
と横ばいでした。これは、銀行業務における収益の増加、及び貸出金のヘッジに係る利益の増加がマーケッ
ツ&セキュリティーズ・サービスにおける収益の減少によって相殺されたことによります。
銀行業務の収益は、前年同期から 1%増加して 41 億ドル(各期における貸出金のヘッジに係る利益(損失)
を除きます。)となりました。これは主に、プライベートバンク及び法人貸付業務の収益の増加を反映して
います。トレジャリー・アンド・トレード・ソリューションの収益は、前年同期から 1%増加して 20 億ドル
となりました。これは、預金及び手数料の増加が債権残高及びスプレッドの減少を上回ったことによるもの
です。投資銀行業務の収益は、前年同期から 7%減少しました。これは、株式引受の収益が 19%減少して 252
百万ドルとなり、債券引受の収益が 4%減少して 550 百万ドルとなり、またアドバイザリー業務の収益が 1%
減少して 263 百万ドルとなったことによるものです。プライベートバンクの収益は、前年同期から 11%増加
して 666 百万ドル(CVA/DVA のマイナス 4 百万ドルを除きます。)となりましたが、これは、対顧客取引の増
加、並びに投資及びキャピタル・マーケット商品の増収によるものです。法人貸付業務の収益は、前年同期
から 9%増加して 431 百万ドル(各期における貸出金のヘッジに係る利益(損失)を除きます。)となりまし
た。これは、平均貸出金が増加したこと及び資金調達費用が減少したことを反映しています。
マーケッツ&セキュリティーズ・サービスの収益は、前年同期から 9%減少して 30 億ドル(CVA/DVA の 17 百
万ドル(2013 年第 4 四半期はマイナス 165 百万ドル)を除きます。)となりました。2014 年第 4 四半期の債
7 券市場業務の収益は、前年同期から 16%減少して 20 億ドル(CVA/DVA の 9 百万ドル(前年同期はマイナス
153 百万ドル)を除きます。)となりました。これは、スプレッド商品における取引状況が厳しかったこと、
そして厳しいマクロ経済環境が金利業務に影響を及ぼしたことによります。株式市場業務の収益は、前年同
期から 3%減少して 471 百万ドル(CVA/DVA の 7 百万ドルを除きます。)となりました。これは、ヨーロッ
パ・中東・アフリカにおける現物株式の取引収益が減少したことによります。セキュリティーズ・サービス
の収益は、前年同期から 4%増加して 574 百万ドルでした。これは、顧客残高及び顧客取引が増加したことを
反映しています。
ICG の当期利益は、2014 年第 4 四半期において 16 億ドルとなりました。CVA/DVA の影響及び 2013 年第 4 四
半期における不正に係る正味損失を除くと、当期利益は前年同期から 9%減少しました。これは、営業費用及
び与信費用の増加によります。営業費用(前年同期における不正に係る正味損失の影響を除きます。)は 3%
増加して 50 億ドルとなりました。これは、事業再編費用及び外部の法務・コンサルティング費用の増加が報
酬費用の減少及び外貨換算の影響を上回ったことによります。与信費用は前年同期から 259 百万ドル増加し
ました。これは、一時的な費用処理及び全体的な経済環境によって生じた貸倒引当金の繰入れに関連するも
のです。
ICG 平均貸出金は、前年同期から 3%増加して 2,770 億ドルとなった一方で、期末預金残高は 3%減少し、
5,590 億ドルでした。実質ドルベースでは、平均貸出金は前年同期から 5%増加した一方で、期末預金残高は
1%増加しました。
シティ・ ホールディングス
(単位:百万ドル )
収益合計
調整後収益
(a )
費用
調整後費用
(a )
正味貸倒損失
(b)
貸倒引当金繰入額/(戻入額)
保険給付準備金繰入額
与信費用合計
調整後与信費用
(a )
当期利益(損失)
調整後当期利益
(a )
期末資産(単位:十億ドル)
期末貸出金(単位:十億ドル)
期末預金(単位:十億ドル)
変動率(%)
2014年
2014年
第4四半期
第4四半期
vs
vs
2013年
2014年
第4四半期
第3四半期
-18%
-
変動率(%)
2014年度
vs
2013年度
27%
2014年
第4四半期
$1,308
2014年
第3四半期
$1,588
2013年
第4四半期
$1,307
$1,313
$1,643
$1,306
-20%
1%
$5,862
$4,563
28%
$765
$892
$1,493
-14%
-49%
$7,715
$5,970
29%
$765
$892
$1,493
-14%
-49%
$3,966
$5,970
-34%
381
(215)
151
347
(144)
153
735
(540)
143
10%
-49%
-1%
-48%
60%
6%
3,070
(2,043)
618
-46%
56%
-3%
$317
$356
$338
-11%
-6%
-6%
2014年度
$5,815
1,646
(903)
602
2013年度
$4,566
$1,645
-18%
$1,290
$1,645
-22%
$(3,370)
$(1,933)
-74%
$(1,934)
NM
$1,345
$317
$356
$338
-11%
$158
$238
$(432)
-34%
NM
$161
$272
$(432)
-41%
NM
$385
98
73
10
103
78
14
117
93
36
-5%
-6%
-31%
-16%
-21%
-72%
98
73
10
117
93
36
-16%
-21%
-72%
注:詳細については、本プレスリリース末尾の付表及び脚注をご参照下さい。
(a) 全期についてCVA/DVAを、2014年第2四半期について住宅ローン担保証券等の和解の影響を、対象となる期に応じて除いています。詳細については、付表Bをご参照下さい。
(b) 未実行貸出約定に関する貸倒引当金を含みます。
シティ・ホールディングス
シティ・ホールディングスの収益は、2014 年第 4 四半期において 13 億ドルとなり、この収益には、マイナ
ス 5 百万ドルの CVA/DVA(前年同期は 1 百万ドル)が含まれています。CVA/DVA の影響を除くと、シティ・
ホールディングスの収益は、前年同期から微増しました。これは、資産売却益の増加、及び資金調達費用の
減少によります。2014 年第 4 四半期末時点でのシティ・ホールディングスの資産は前年同期から 16%減少し
て 980 億ドルとなり、これは、シティグループの総資産の約 5%に相当します。
シティ・ホールディングスの当期利益は、CVA/DVA の影響を除くと、前年同期の損失 432 百万ドルから増加
して、161 百万ドルでした。これは、営業費用の減少及び正味貸倒損失の減少を反映していますが、貸倒引当
金の正味戻入額の減少により一部相殺されました。2014 年第 4 四半期における営業費用は前年同期から 49%
減少して 765 百万ドルとなりました。これは、シティ・ホールディングスの資産が引き続き圧縮されたこと、
及び法務関連費用の減少(前年同期における 650 百万ドルに対し、2014 年第 4 四半期では 61 百万ドル)によ
るものです。正味貸倒損失は、前年同期から 48%減少して 381 百万ドルとなりました。これは、主として、
8 北米における住宅ローン・ポートフォリオの与信が引き続き改善・縮小したことによるものです。貸倒引当
金の正味戻入額は、前年同期から 60%減少して 215 百万ドルとなりました。これは、主として、北米におけ
る住宅ローン・ポートフォリオに関連する戻入額が減少したことによるものです。
シティ・ホールディングスの貸倒引当金の 2014 年第 4 四半期末残高は、45 億ドル(貸出金の 6.20%)でし
た。これに対し、前年同期の残高は 65 億ドル(貸出金の 6.98%)でした。シティ・ホールディングスにおけ
る 90 日以上延滞個人向け貸出金は 28%減少して 20 億ドル(貸出金の 2.88%)となりました。
シティコープの地域別の業績 (a )
(単位:百万ドル)
収益
継続事業からの利益
2014年
第4四半期
2014年
第3四半期
2013年
第4四半期
2014年
第4四半期
2014年
第3四半期
2013年
第4四半期
グローバル個人金融部門
5,091
4,989
4,874
1,139
1,185
858
インスティテューショナル・クライアント・グループ
2,399
3,161
2,325
612
878
463
$7,490
$8,150
$7,199
$1,751
$2,063
$1,321
北米
北米合計
ヨーロッパ ・中東・ア フリカ
グローバル個人金融部門
インスティテューショナル・クライアント・グループ
ヨーロッパ ・中東・ア フリカ 合計
305
347
358
2,058
2,540
2,053
206
(38)
631
1
414
(1)
$2,363
$2,887
$2,411
$168
$632
$413
2,255
2,357
2,403
256
338
371
981
1,038
1,147
279
308
435
$3,236
$3,395
$3,550
$535
$646
$806
1,791
1,749
1,944
1,948
1,834
1,684
312
557
413
710
313
491
$3,540
$3,892
$3,518
ラテ ンア メリカ
グローバル個人金融部門
インスティテューショナル・クライアント・グループ
ラテ ンア メリカ 合計
アジア
グローバル個人金融部門
インスティテューショナル・クライアント・グループ
ア ジ ア 合計
本社事項、本社業務/その他
シテ ィコ ープ
$(137)
$8
$16,492
$18,332
$(41)
$16,637
$869
$(3,105)
$1,123
$804
$(1,598)
$(256)
$218
$2,866
$3,088
注:四捨五入により、合計が一致しない場合があります。詳細については、本プレスリリース末尾の付表及び脚注をご参照下さい。
(a) 全期についてCVA/DVAを、2013年第4四半期について不正に係る正味損失及び2013年第4四半期についてクレディカード事業の売却の影響を、対象となる期に応じて除きます。詳細につ
いては、付表Bをご参照下さい。
シティコープの地域別の業績 (a )
(単位:百万ドル )
収益
2014年
継続事業からの利益
2013年
2014年
2013年
北米
グローバル個人金融部門
インスティテューショナル・クライアント・グループ
北米合計
ヨーロッ パ ・中東・ア フリカ
グローバル個人金融部門
インスティテューショナル・クライアント・グループ
ヨーロッ パ ・中東・ア フリカ 合計
19,645
12,295
19,776
11,736
4,421
3,865
3,910
3,304
$31,940
$31,512
$8,286
$7,214
1,358
1,449
9,787
10,065
2,152
(7)
2,462
35
$11,145
$11,514
$2,145
$2,497
9,204
9,316
1,204
1,337
4,282
4,681
1,365
1,857
$13,486
$13,997
$2,569
$3,194
7,546
7,246
7,624
7,430
1,320
2,350
1,481
2,240
$14,792
$15,054
$3,670
$3,721
$47
$121
$71,410
$72,198
ラテ ンア メリカ
グローバル個人金融部門
インスティテューショナル・クライアント・グループ
ラテ ンア メリカ 合計
ア ジア
グローバル個人金融部門
インスティテューショナル・クライアント・グループ
ア ジア 合計
本社事項、本社業務/その他
シティコ ープ
$(5,383)
$11,287
$(806)
$15,820
注:四捨五入により、合計が一致しない場合があります。詳細については、本プレスリリース末尾の付表及び脚注をご参照下さい。
(a) 全期についてCVA/DVAを、2014年第1四半期及び2013年第3四半期について税務項目を、2013年第4四半期についてクレディカード事業の売却の影響を及び2013年第4四半期について
不正に係る正味損失を、対象となる期に応じて除きます。詳細については、付表Bをご参照下さい。
9 シティグループは、世界 160 以上の国と地域に約 2 億の顧客口座を有する世界有数のグローバルな銀行です。個人、法人、政府及び団
体を対象として、個人向け銀行業務やカードビジネス、法人・投資銀行業務、証券業務、トランザクション・サービス、資産管理の分
野において、幅広い金融商品やサービスを提供しています。
詳しくはこちらをご覧下さい。
www.citigroup.com | Twitter: @Citi | YouTube: www.youtube.com/citi | Blog: http://blog.citigroup.com | Facebook:
www.facebook.com/citi | LinkedIn: www.linkedin.com/company/citi
追加の財務、統計及び業務関連の情報並びに業務及びセグメントのトレンドに関してはフィナンシャル・データ・サプルメント
(Financial Data Supplement)に含まれており、抜粋の翻訳を添付しています。本発表及びフィナンシャル・データ・サプルメントは
シティグループのウェブサイト(www.citigroup.com)にて入手することができます。
本文書には、1995 年米国民事証券訴訟改革法に定める「将来の見通しに関する記述」が含まれています。こうした記述は、経営陣の現在
の予測に基づくものであり、不確実要素や状況の変化により影響を受けます。こうした記述は、将来の業績又は事象の発生を保証する
ものではありません。様々な要因により、実際の業績並びに資本及びその他の財務状況は、こうした記述に含まれる情報と大きく異な
る可能性があります。様々な要因には、本書に含まれる注意喚起のための記述及びシティグループが米国証券取引委員会に提出する文
書中に含まれる注意喚起のための記述(シティグループの 2013 年のフォーム 10-K による年次報告における「リスク・ファクター」を
含みますが、これらに限られません。)が含まれます。シティグループによって又はシティグループを代表してなされた将来の見通し
に関する記述は、こうした記述がなされた時点のみを基準としており、シティグループは、当該時点以降に生じた状況又は事象の影響
を反映するためにこうした記述を更新することを約束するものではありません。
本発表に関する日本国内の連絡先:
シティグループ・インク代理人
長島・大野・常松法律事務所
弁護士
杉 本
文 秀
電話:03-3511-6133(直通)
10 付表A: CVA/ DVA
CVA/DVA
(単位:百万ドル )
2014年
2014年
2013年
第4四半期
第3四半期
第4四半期
2014年度
2013年度
インスティテュ ーショナ ル ・クライア ント・グ ル ープ
取引先のCVA
資産のFVA
(1)
当社自身のCVA
負債のFVA
$(90)
(33)
(1)
デリバ ティブにおける CVA
(1 )
$(25)
(436)
$102
-
$(63)
(469)
$265
-
9
27
(108)
(43)
(208)
13
6
-
19
-
$(102)
$(427)
$(6)
$(556)
$57
114
111
(159)
214
(402)
$12
$(316)
$(165)
$(343)
$(345)
公正価値による シティの負債のDVA
インス ティテュ ーショナ ル ・クライア ント・グ ル ープ
CVA/DVA合計
シティ・ホ ール ディング ス
取引先のCVA
資産のFVA
(1)
当社自身のCVA
負債のFVA
(1)
デリバ ティブにおける CVA
1
(5)
(44)
15
-
20
(49)
27
-
(3)
(12)
(11)
(22)
(14)
(1 )
-
$(6)
公正価値による シティの負債のDVA
$(55)
1
シティ・ホ ール ディング スCVA/DVA合計
シティグ ル ープCVA/DVA合計
$4
1
$(5)
$(55)
$7
$(371)
$(51)
(2)
$1
$(164)
4
$13
(10)
$(47)
$(390)
$3
$(342)
注:四捨五入により、合計が一致しない場合があります。
(1) ヘッジを控除しています。
付表B :非GAAP財務指標-調整済項目
シ テ ィ グルー プ
(単位:百万ドル 、 ただし1株当たり の金額を除き ます)
収益の報告値(G AAP )
2014年
2014年
第4四半期
$17,812
2013年
第3四半期
$19,604
2014年度
第4四半期
$17,779
2013年度
$76,882
$76,419
以下の項目による影響:
CVA/DVA
7
(371)
(164)
(390)
(342)
調整後収益
$17,805
$19,975
$17,943
$77,272
$76,761
費用の報告値(G AAP )
$14,426
$12,955
$12,292
$55,051
$48,408
以下の項目による影響:
不正に係る正味損失
-
-
-
-
-
$14,426
$12,955
$11,932
$51,302
$48,048
$2,013
$1,750
$2,072
$7,467
$8,514
-
-
-
住宅ローン担保証券等に関する和解
調整後費用
与信費用の報告値(G AAP)
(360)
(3,749)
(360)
-
以下の項目による影響:
住宅ローン担保証券等に関する和解
調整後与信費用
当期利益の報告値(G AAP)
以下の項目による影響:
CVA/DVA
(55)
-
$2,013
$1,750
$2,072
$7,412
$8,514
$350
$2,839
$2,456
$7,313
$13,673
4
(228)
(100)
(240)
(213)
クレディカード
-
-
189
-
189
不正に係る正味損失
-
-
(235)
-
(235)
税務項目
住宅ローン担保証券等に関する和解
-
-
-
$346
159
$3,067
128
$2,602
71
$11,489
511
$13,756
194
普通株式に対する 調整後当期利益
$187
$2,939
$2,531
$10,978
$13,562
1株当たり 利益の報告値 ( G AAP)
以下の項目による影響:
$0.06
$0.88
$0.77
$2.20
$4.35
0.00
(0.08)
(0.03)
(0.07)
(0.07)
調整後当期利益
優先株式配当
CVA/DVA
クレディカード
-
-
0.06
不正に係る正味損失
税務項目
-
-
(0.08)
-
住宅ローン担保証券等に関する和解
調整後1株当たり 利益
-
-
-
$0.06
$0.95
$0.82
11 (210)
(3,726)
(0.07)
(1.21)
$3.55
176
-
0.06
(0.08)
0.06
$4.37
付表B: 非GAAP財務指標-調整済項目( 続き)
シテ ィコ ー プ
(単位:百万ドル )
収益の報告値(G AAP )
以下の項目による影響:
CVA/DVA
調整後収益
2014年
第4四半期
$16,504
2014年
第3四半期
$18,016
12
2013年
第4四半期
$16,472
(316)
2014年度
$71,067
(165)
2013年度
$71,853
(343)
(345)
$16,492
$18,332
$16,637
$71,410
$72,198
費用の報告値(G AAP )
以下の項目による影響:
不正に係る正味損失
$13,661
$12,063
$10,799
$47,336
$42,438
調整後費用
$13,661
$12,063
$10,439
$47,336
$42,078
$192
$2,601
$2,888
$10,683
$15,606
当期利益の報告値(G AAP )
以下の項目による影響:
CVA/DVA
クレディカード
不正に係る正味損失
税務項目
調整後当期利益
インス テ ィテ ュ ー ショ ナル・ク ラ イアント ・グ
ルー プ
(単位:百万ドル )
収益の報告値(G AAP )
以下の項目による影響:
CVA/DVA
調整後収益
費用の報告値(G AAP )
以下の項目による影響:
不正に係る正味損失
調整後費用
-
-
7
(194)
-
-
(360)
(100)
189
(235)
-
-
(211)
(210)
(360)
(214)
189
(235)
176
$185
$2,795
$3,034
$11,104
$15,690
2014年
第4四半期
$7,199
2014年
第3四半期
$8,371
2013年
第4四半期
$7,044
2014年度
$33,267
2013年度
$33,567
12
(316)
(165)
(343)
(345)
$7,187
$8,687
$7,209
$33,610
$33,912
$5,035
$5,040
$5,245
$19,960
$20,218
-
-
(360)
-
(360)
$5,035
$5,040
$4,885
$19,960
$19,858
当期利益の報告値(G AAP )
以下の項目による影響:
CVA/DVA
不正に係る正味損失
$1,637
$2,291
$1,450
$9,410
$9,304
調整後当期利益
$1,630
本社事項、本社業務/その他
(単位:百万ドル )
当期利益の報告値(G AAP )
以下の項目による影響:
クレディカード
税務項目
調整後当期利益
シテ ィ・ホー ルデ ィ ングス
(単位:百万ドル )
収益の報告値(G AAP )
以下の項目による影響:
CVA/DVA
調整後収益
費用の報告値(G AAP )
以下の項目による影響:
7
(194)
-
-
$2,485
$1,785
2014年
第4四半期
$(3,111)
2014年
第3四半期
$(1,618)
-
-
$(3,111)
$(1,618)
2014年
第4四半期
$1,308
2014年
第3四半期
$1,588
(5)
(100)
(235)
$9,621
2013年
第4四半期
$(101)
189
2014年度
$(5,639)
-
(210)
$(290)
$(5,429)
2013年
第4四半期
$1,307
(55)
(211)
-
2014年度
$5,815
1
(47)
(214)
(235)
$9,753
2013年度
$(444)
189
176
$(809)
2013年度
$4,566
3
$1,313
$1,643
$1,306
$5,862
$4,563
$765
$892
$1,493
$7,715
$5,970
住宅ローン担保証券等に関する和解
調整後費用
$765
$892
$1,493
$3,966
$5,970
与信費用の報告値( G AAP )
$317
$356
$338
$1,345
$1,645
以下の項目による影響:
住宅ローン担保証券等に関する和解
調整後与信費用
$317
$356
$338
$1,290
$1,645
当期利益の報告値( G AAP )
以下の項目による影響:
CVA/DVA
住宅ローン担保証券等に関する和解
$158
$238
$(432)
$(3,370)
$(1,933)
-
(29)
(3,726)
調整後当期利益
$161
-
-
-
-
-
(3)
-
(34)
$272
12 -
$(432)
(3,749)
-
(55)
$385
-
1
$(1,934)
付表C: 非GAAP財務指標-外貨換算の影響を除く
米国外個人金融部門
(単位:百万ドル )
2014年
第4四半期
2014年
第3四半期
2013年
第4四半期
2014年度
収益の報告値
外貨換算の影響
実質ドルによる 収益
$4,351
-
$4,648
(205)
$4,595
(278)
$18,108
$4,351
$4,443
$4,317
$18,108
費用の報告値
外貨換算の影響
$2,846
-
$2,877
(131)
$2,879
(163)
$11,601
実質ドルによる 費用
$2,846
$2,746
$2,716
$11,601
与信費用の報告値
$753
外貨換算の影響
$726
(42)
-
$792
(50)
2013年度
-
$18,389
(674)
$17,715
-
$11,337
(373)
$10,964
$3,070
-
$3,127
(122)
実質ドルによる 与信費用
$753
$684
$742
$3,070
$3,005
法人税等控除前の利益の報告値
$752
$1,045
$924
$3,437
$3,925
外貨換算の影響
-
実質ドルによる 法人税等控除前の利益
$752
当期利益の報告値
外貨換算の影響
実質ドルによる 当期利益
$527
(32)
$1,013
$527
(65)
-
(179)
$859
$3,437
$3,746
$742
(16)
$682
(36)
$2,490
-
$2,838
(120)
$726
$646
$2,490
$2,718
ヨーロッパ・ 中東・ アフリカ個人金融部門
(単位:百万ドル )
収益の報告値
外貨換算の影響
実質ドルによる 収益
費用の報告値
外貨換算の影響
実質ドルによる 費用
2014年
第4四半期
2014年
第3四半期
$305
2013年
第4四半期
2014年度
2013年度
$347
(25)
$358
(46)
$1,358
-
$1,449
(72)
$305
$322
$312
$1,358
$1,377
$329
$326
(28)
$349
(39)
$1,283
-
$1,359
(59)
$298
$310
$1,283
$1,300
-
$329
ラテンアメリカ個人金融部門
(単位:百万ドル )
2014年
第4四半期
2014年
第3四半期
2013年
第4四半期
2014年度
収益の報告値
外貨換算の影響
実質ドルによる 収益
$2,255
-
$2,357
(120)
$2,403
(175)
$9,204
$2,255
$2,237
$2,228
$9,204
費用の報告値
外貨換算の影響
$1,370
-
$1,378
(64)
$1,381
(86)
$5,422
実質ドルによる 費用
$1,370
$1,314
$1,295
$5,422
2013年度
-
$9,316
(446)
$8,870
-
$5,392
(232)
$5,160
アジア個人金融部門
(単位:百万ドル )
2014年
第4四半期
2014年
第3四半期
2013年
第4四半期
2014年度
収益の報告値
外貨換算の影響
実質ドルによる 収益
$1,791
-
$1,944
(60)
$1,834
(57)
$7,546
$1,791
$1,884
$1,777
$7,546
費用の報告値
外貨換算の影響
実質ドルによる 費用
$1,147
-
$1,173
(39)
$1,149
(38)
$4,896
$1,134
$1,111
$4,896
$1,147
13 2013年度
-
$7,624
(156)
$7,468
-
$4,586
(82)
$4,504
付表C: 非GAAP財務指標-外貨換算の影響を除く( 続き)
シティグループ
(単位:十億ドル )
2014年
第4四半期
2014年
第3四半期
2013年
第4四半期
2014年度
2013年度
期末貸出金の報告値
外貨換算の影響
$645
-
$654
(10)
$666
(17)
$645
-
$666
(17)
実質ドル による 期末貸出金
$645
$644
$649
$645
$649
期末預金の報告値
外貨換算の影響
実質ドル による 期末預金
$899
-
$943
(16)
$968
(30)
$899
-
$968
(30)
$899
$927
$939
$899
$939
シティコープ
(単位:十億ドル )
2014年
第4四半期
2014年
第3四半期
2013年
第4四半期
2014年度
2013年度
期末貸出金の報告値
外貨換算の影響
実質ドル による 期末貸出金
$572
-
$576
(10)
$573
(16)
$572
-
$573
(16)
$572
$566
$557
$572
$557
期末預金の報告値
外貨換算の影響
実質ドル による 期末預金
$889
-
$928
(16)
$932
(29)
$889
-
$932
(29)
$889
$913
$903
$889
$903
インスティテューショナル・ クライアント・ グループ
(単位:十億ドル )
2014年
第4四半期
2014年
第3四半期
2013年
第4四半期
2014年度
2013年度
平均貸出金の報告値
外貨換算の影響
$277
-
$278
(3)
$268
(5)
$277
-
$256
(2)
実質ドル による 平均貸出金
$277
$275
$263
$277
$253
期末預金の報告値
外貨換算の影響
実質ドル による 期末預金
$559
-
$567
(9)
$574
(19)
$559
-
$574
(19)
$559
$558
$555
$559
$555
14 付表D: 非GAAP財務指標-バーゼルIII 普通株式等Tie r 1 資本及び比率 (1 )
2014年
(単位 : 百万ドル)
12月31日
$200,190
165
2014年
9月30日
$203,421
172
2013年
12月31日
$197,694
182
(909)
(979)
(1,245)
279
193
177
22,792
23,678
24,518
4,305
4,307
4,950
936
1,179
1,125
36,411
36,453
42,754
$136,541
$138,762
$125,597
$1,299,000
$1,302,000
1,242,000
10.5%
10.7%
10.1%
(2 )
シ ティグ ル ープ普通株主持分
追加: 適格非支配持分
(3 )
規制資本に関する 調整及び控除:
控除:
(4)
キャッシュ・フロー・ヘッジに係る累積正味未実現損失(税引後)
(5)
自己の信用度の変化に起因する金融負債の公正価値の変動に関する累積正味未実現利益(税引後)
無形資産:
(6)
のれん(関連繰延税金負債控除後)
抵当貸付サービシング権(MSR)以外の識別可能無形資産(関連繰延税金負債控除後)
確定給付年金制度純資産
繰越欠損金、外国税額控除の繰越及び一般事業控除の繰越、他のDTAに関する10%/15%の制限
の超過分、一定の普通株主持分投資並びにMSRその他から発生する繰延税金資産(DTA)
(7)
バ ーゼル III普通株式等T ie r 1資本( CET 1)
バ ーゼル IIIリスク加重資産( RWA)
バ ーゼル III普通株式等T ie r 1資本比率( CET 1/RWA)
(8)
(8)
(1) シティのバーゼルIII普通株式等Tier 1資本比率及び関連する構成要素は、米国のバーゼルIIIに関する最終規則に基づき、これが資本の構成要素につき全面的に実施されたものと仮定
して計算されています。バーゼルIIIリスク加重資産は、リスク加重資産合計を決定するための先進的アプローチに基づいています。
(2) 暫定値。
(3) 連邦準備制度理事会の規制基準に従い、発行済の優先株式に関連する発行費用は除いています。
(4) シティのバーゼルIII普通株式等Tier 1資本は、貸借対照表において公正価格により認識されていない項目のヘッジに関するその他包括利益累計額に含まれるキャッシュフロー・ヘッジに
係る累積正味未実現利益(損失)に合わせて、調整されています。
(5) 公正価値オプションが選択される負債の評価におけるシティグループの自己の信用度の変化の累積的影響及びデリバティブにおける自己の信用評価調整は、米国のバーゼルIIIに関す
る最終規則に基づき、普通株式等Tier 1資本から除かれています。
(6) 非連結金融機関に対する重要な普通株式投資の評価に内在するのれんを含みます。
(7) MSRのほか、一時的な差異及び非連結金融機関に対する重要な普通株式投資から発生する他のDTAを反映しています。
(8) シティグループの2013年12月31日時点でのバーゼルIII普通株式等Tier 1資本の試算は、シティが承認された2014年度第2四半期のバーゼルIIIの並列的な財務報告の終了に関する約
560億ドルの追加オペレーショナル・リスク加重資産を、プロフォーマ・ベースにおいて含めるための修正を反映しています。
付表E: 非GAAP財務指標-1株当たり有形純資産額
暫定値
2014年
12月31日
(単位 : 百万ドル、ただし 1 株当たりの金額を除きます)
シティグ ループ株主持分合計
控除: 優先株式
$210,534
10,468
普通株式株主資本
$200,066
控除:
のれん
23,592
その他無形資産(MSRを除く)
4,566
売却目的保有資産に関するのれん
71
有形普通株式株主資本( T CE)
$171,837
四半期末発行済普通株式数(CSO)
3,024
1株当たり 有形純資産額( T CE/CSO)
$56.83
15 1
暫定的ですが、シティグループのバーゼル III 普通株式等 Tier 1 資本比率は、非 GAAP 財務指標です。シティグルー
プは、将来の規制資本の基準に対するシティグループの進捗を測定することによって、この指標及び関連する構成要素が
投資家等に対して有益な情報を提供するものと考えています。シティグループのバーゼル III 普通株式等 Tier 1 資本比
率及び関連する構成要素は、とりわけ、シティにおける信用リスク、市場リスク及びオペレーショナル・リスクのモデル、
(義務の有無にかかわらない)これらのモデルについての追加の改善、修正又は改良についての検討及び承認を含む、規
制当局の継続的な監督並びにその他の米国における実施のためのあらゆる指針に従うことになります。シティグループの
バーゼル III 普通株式等 Tier 1 資本及びその比率については、付表 D をご参照下さい。 2
暫定的ですが、シティグループのバーゼル III における補完的指標としてのレバレッジ比率(SLR)及び一定の関連す
る構成要素の試算は、非 GAAP 財務指標です。シティグループは、将来の規制資本の基準に対するシティグループの進捗
を測定することによって、この指標及びその構成要素が投資家等に対して有益な情報を提供するものと考えています。シ
ティグループのバーゼル III における SLR の試算は、2014 年 9 月に発表された米国のバーゼル III に関する最終規則の
修正版に基づいて計算されており、Tier 1 資本がレバレッジエクスポージャーの総額(TLE)に占める比率を示していま
す。TLE は、当四半期における貸借対照表上の資産の帳簿価額の 1 日ごとの平均値及び当四半期の各月の末日において計
算された一定のオフバランスのエクスポージャーの平均値の合計額から該当する Tier 1 資本控除を行った額です。シ
ティグループのバーゼル III における SLR 及び関連する構成要素の試算は、とりわけ、規制当局の継続的な監督及びその
他の米国における実施のためのあらゆる指針に従うことになります。 3
一株当たり有形純資産額は、非 GAAP 財務指標です。シティグループは、この資本指標が投資家や業界のアナリストに
使用されるものとして、有益な情報を提供するものと考えています。報告された業績へのこの指標の調整については付表
E をご参照下さい。 4
ヘッジ取引控除後のデリバティブにおける信用評価調整(CVA)(取引先及び当社自身)、デリバティブにおける資金調
達評価調整(FVA)及び公正価格オプションによるシティグループの負債の負債評価調整(DVA)(CVA/DVA)です。付表 A
をご参照下さい。CVA/DVA の影響を除くシティグループの業績は、非 GAAP 財務指標です。シティグループは、CVA/DVA の
影響を除いてシティグループの業績を示すことが、CVA/DVA の影響を受けたシティグループの事業の基礎に関するより有
益な情報を提供するものと考えています。報告された業績へのこの指標の調整については付表 B をご参照下さい。 5
2013 年第 2 四半期において、クレディカード事業(ブラジルにおけるシティバンクブランドではないカード事業及び
消費者金融事業)の売却に合意し、当該売却は 2013 年第 4 四半期に完了しました。2013 年第 4 四半期におけるメキシコ
での不正に係る正味損失に関するさらなる情報については、2014 年 2 月 28 日に米国証券取引委員会(SEC)に提出され
たシティグループのフォーム 8-K による報告書をご参照下さい。本項目を除くシティグループの業績の表示は、非 GAAP
財務指標です。シティグループは、本項目を除いた業績を示すことが、シティグループの事業の基礎に関するより有益な
情報を提供するものと考えています。報告された業績へのこれらの指標の調整については、付表 B をご参照下さい。
6
2014 年第 2 四半期の業績に含まれる過去の住宅ローン担保証券(RMBS)及び債務担保証券(CDOs)に関する請求に係
る和解の詳細については、2014 年 7 月 14 日に SEC に提出されたシティグループのフォーム 8-K による報告書をご参照下
さい。 7
住宅ローン担保証券等に関する和解の影響及び税務項目を除いたシティグループの業績の表示は、非 GAAP 財務指標で
す。シティグループは、これらの項目を除いた業績を示すことが、シティの事業の基礎に関するより有益な情報を提供す
るものと考えています。報告された業績へのこれらの指標の調整については、付表 B をご参照下さい。 8
外貨換算の影響を除いた業績(実質ドルベース)は、非 GAAP 財務指標です。シティグループは、外貨換算の影響を除
いた業績を示すことが、外貨換算の影響を受けるシティグループの事業の基礎に関するより有益な情報を提供するものと
考えています。報告された業績へのこれらの指標の調整については、付表 C をご参照下さい。 9
付表 D 脚注 8 をご参照下さい。 10
未収利息計上貸出金のヘッジは法人向け貸出金ポートフォリオをヘッジするために使用されるクレジット・デリバテ
ィブの時価評価を反映しています。これらのヘッジの固定プレミアムコストは、信用補完の費用を反映するために、中核
となる貸出業務の収益に含まれて(相殺されて)います。貸出金のヘッジに係る利益(損失)の影響を除いた業績は非
16 GAAP 財務指標です。シティグループは、貸出金のヘッジに係る利益(損失)の影響を除いた業績の表示がシティの事業
の基礎に関するより有益な情報を提供するものと考えています。
17 <添付資料>
シティグループ連結損益計算書
(単位:百万ドル)
2013 年
2014 年
2014 年
2014 年
2014 年
第 4 四半期 第 1 四半期 第 2 四半期 第 3 四半期 第 4 四半期
収益
受取利息
$15,707 $15,350 $15,561 $15,512 $15,260
支払利息
3,737 3,591 3,615 3,325 3,159
純利息収益
11,970 11,759 11,946 12,187 12,101
役務収益及び手数料
3,152 3,184 3,441 3,280 3,127
自己勘定取引
965 2,888 1,843 1,549
418
管理手数料及びその他信
託手数料
970 1,009 1,029 1,029
946
投資実現利益(損失)
(16)
128
84
136
222
投資及びその他資産の一
時的でない減損損失
(73)
(201)
(37)
(91)
(95)
受取保険料
552
545
538
530
497
その他収益
259
812
498
984
596
利息以外の収益合計
5,809 8,365 7,396 7,417 5,711
支払利息控除後収益合
計
17,779 20,124 19,342 19,604 17,812
貸倒引当金繰入額及び保険
給付準備金繰入額
正味貸倒損失
2,547 2,439 2,189 2,097 2,248
貸倒引当金繰入(戻入)額
(636)
(646)
(610)
(522)
(367)
貸倒引当金繰入額
1,911 1,793 1,579 1,575 1,881
保険給付準備金繰入額
195
208
182
205
206
未実行貸出約定に関する
貸倒引当金繰入額
(34)
(27)
(31)
(30)
(74)
貸倒引当金繰入額及び
保険給付準備金繰入
額合計
2,072 1,974 1,730 1,750 2,013
営業費用
報酬及び福利費
5,729 6,010 6,028 6,114 5,807
施設及び設備費
796
805
819
804
750
技術・通信費
1,552 1,530 1,619 1,630 1,657
広告及びマーケティング費
501
458
460
442
484
その他の営業費用
3,714 3,346 6,595 3,965 5,728
営業費用合計
12,292 12,149 15,521 12,955 14,426
法人税等控除前の継続事業
からの利益
3,415 6,001 2,091 4,899 1,373
法人税等(便益)
1,090 2,050 1,838 1,985
991
継続事業からの利益
2,325 3,951
253 2,914
382
非継続事業(1)
非継続事業からの利益(損
失)
(223)
40
(3)
(25)
(2)
売却(損)益
206
—
—
—
—
法人税等(便益)
(198)
3
19
(9)
(1)
非継続事業からの利益(損
失)(税引後)
181
37
(22)
(16)
(1)
非支配持分控除前当期利益
2,506 3,988
231 2,898
381
非支配持分に帰属する当期
利益
50
45
50
59
31
シティグループ当期利益
$ 2,456 $ 3,943 $ 181 $ 2,839 $ 350
1
増(減)率
2014 年
第 4 四半期
vs
2014 年
2013 年
第3
第4
四半期
四半期
(2)%
(5)%
(1)%
(5)%
(73)%
(8)%
63%
(4)%
(6)%
(39)%
(23)%
(9)%
7%
30%
19%
—
NM
2013 年
通年
(3)% $62,970
(15)% 16,177
1% 46,793
(1)% 12,941
(57)% 7,302
(2)%
NM
4,089
748
2014 年
通年
$61,683
13,690
47,993
13,032
6,698
(2)%
(15)%
3%
1%
(8)%
4,013
570
(2)%
(24)%
(30)%
(535)
(424)
(10)% 2,280 2,110
NM
2,801 2,890
(2)% 29,626 28,889
—
増(減)率
2014 年 vs
2013 年
76,419 76,882
21%
(7)%
3%
(2)%
1%
(12)% 10,463 8,973
42% (2,859) (2,145)
(2)% 7,604 6,828
6%
830
801
(14)%
25%
(10)%
(3)%
NM
NM
80
15%
(3)%
7,467
(12)%
(5)%
(7)%
2%
10%
44%
11%
1% 23,967 23,959
(6)% 3,165 3,178
7%
6,136 6,436
(3)% 1,888 1,844
54% 13,252 19,634
17% 48,408 55,051
—
—
5%
(2)%
48%
14%
(72)%
(50)%
(87)%
(60)% 19,497 14,364
(9)% 5,867 6,864
(84)% 13,630 7,500
(26)%
17%
(45)%
92%
—
89%
99%
(100)%
99%
8,514
(162)
(242)
268
(244)
10
—
12
94%
(87)%
NM
270
(85)% 13,900
(2)
7,498
(47)%
(88)%
(38)%
227
185
(86)%$13,673 $ 7,313
NM
(100)%
NM
NM
(46)%
(19)%
(47)%
(1) 非継続事業は主に以下を反映しています。
a) 2013 年第 4 四半期に、シティがクレディカード事業の売却を完了させたことにより発生した非継続事業に対する税
引後効果 189 百万ドル
b) 2014 年第 1 四半期において、クレディカード及びエッグ・クレジット・カード事業(エッグ)の売却に関連する残余金額
c) 2014 年第 2 四半期において、クレディカード、ドイツ個人向け事業及びエッグの売却に関連する残余金額
d) 2014 年第 3 四半期において、ドイツ個人向け事業及びエッグの売却に関連する残余金額
e) 2014 年第 4 四半期において、従前の非継続事業に関する残余金額
NM:重要ではありません。
当期の表示に一致するよう組み替えられています。
2
シティグループ連結貸借対照表
(単位:百万ドル)
2013 年
12 月 31 日
資産
現金及び銀行預け金(分別金及びその他預
金を含む)
銀行預け金
フェデラルファンド貸出金、借入有価証券及
び売戻条件付買入有価証券
ブローカレッジ債権
トレーディング勘定資産
投資
売却可能及び市場性のない持分有価証
券
満期保有目的
投資合計
貸出金(前受収益控除後)
個人向け貸出金
法人向け貸出金
貸出金(前受収益控除後)
貸倒引当金
貸出金合計(正味)
のれん
無形資産(MSR を除く)
抵当貸付サービシング権(MSR)
その他資産 (2)
売却目的保有非継続事業に関する資産
資産合計
負債
米国内無利子預金
米国内利付預金
米国内預金合計
米国外無利子預金
米国外利付預金
米国外預金合計
預金合計 (2)
フェデラルファンド借入金、貸付有価証券及
び買戻条件付売渡有価証券
ブローカレッジ債務
トレーディング勘定負債
短期借入金
長期債務
その他負債 (2) (3)
売却目的保有非継続事業に関する負債
負債合計
持分
株主持分
優先株式
普通株式
払込剰余金
利益剰余金
自己株式
その他包括利益(損失)累計額
普通株主持分合計
シティグループ株主持分合計
$
2014 年
3 月 31 日
2014 年
6 月 30 日
2014 年
9 月 30 日
増(減)率
2014 年第 4 四半期
vs
2014 年
2014 年第
2013 年第
12 月 31 日
3
4
(1)
四半期
四半期
29,885 $ 33,380 $ 35,268 $ 35,976 $ 32,108
169,005
171,020
153,817
143,068
128,089
(11)%
(10)%
7%
(24)%
257,037
25,674
285,928
263,398
32,484
278,180
250,353
41,864
290,776
245,462
39,298
290,822
242,570
28,419
296,786
(1)%
(28)%
2%
(6)%
11%
4%
298,381
10,599
308,980
302,300
10,600
312,900
303,293
22,330
325,623
309,009
24,038
333,047
309,522
23,921
333,443
—
—
—
4%
NM
8%
393,831
384,661
384,345
376,318
369,970
271,641
279,560
283,159
277,508
274,665
665,472
664,221
667,504
653,826
644,635
(19,648) (18,923)
(17,890) (16,915) (15,994)
645,824
645,298
649,614
636,911
628,641
25,009
25,008
25,087
24,500
23,592
5,056
4,891
4,702
4,525
4,566
2,718
2,586
2,282
2,093
1,845
125,266
125,591
130,329
127,147
122,471
—
—
—
—
—
$1,880,382 $1,894,736 $1,909,715 $1,882,849 $1,842,530
(2)%
(1)%
(1)%
5%
(1)%
(4)%
1%
(12)%
(4)%
—
(2)%
(6)%
1%
(3)%
19%
(3)%
(6)%
(10)%
(32)%
(2)%
—
(2)%
$ 128,399 $ 135,632 $ 130,653 $ 128,243 $ 128,958
284,164
280,549
289,035
285,604
284,978
412,563
416,181
419,688
413,847
413,936
69,406
69,263
73,991
71,228
70,925
486,304
480,819
472,046
457,580
414,471
555,710
550,082
546,037
528,808
485,396
968,273
966,263
965,725
942,655
899,332
1%
—
—
—
(9)%
(8)%
(5)%
—
—
—
2%
(15)%
(13)%
(7)%
203,512
190,676
183,912
175,732
173,438
53,707
59,407
62,323
59,428
52,180
108,762
124,040
123,370
137,272
139,036
58,944
58,903
59,534
64,838
58,335
221,116
222,747
226,984
223,842
223,080
59,935
62,458
74,768
65,191
85,084
—
—
—
—
—
$1,674,249 $1,684,494 $1,696,616 $1,668,958 $1,630,485
(1)%
(12)%
1%
(10)%
—
31%
—
(2)%
(15)%
(3)%
28%
(1)%
1%
42%
—
(3)%
$
17%
—
—
—
(11)%
(16)%
(2)%
(1)%
55%
—
1%
6%
(77)%
(21)%
1%
3%
6,738 $
31
107,193
111,168
(1,658)
(19,133)
$ 197,601 $
$ 204,339 $
7,218 $
31
107,505
115,091
(2,237)
(19,146)
201,244 $
208,462 $
3
8,968 $
31
107,669
115,361
(2,520)
(18,147)
202,394 $
211,362 $
8,968 $
31
107,839
118,041
(2,631)
(19,976)
203,304 $
212,272 $
10,468
31
107,979
118,201
(2,929)
(23,216)
200,066
210,534
非支配持分
持分合計
負債及び持分合計
1,794
1,780
1,737
1,619
1,511
206,133
210,242
213,099
213,891
212,045
$1,880,382 $1,894,736 $1,909,715 $1,882,849 $1,842,530
(7)%
(1)%
(2)%
(16)%
3%
(2)%
(1) 暫定値
(2) シティグループが日本におけるリテールバンク事業売却について合意したことにより、2014 年 12 月 31 日付で、約 206 億ド
ルの預金(及び同等の資産)が「その他負債」及び「その他資産」の売却目的保有にそれぞれ組み替えられました。
(3) 未実行貸出約定及び信用状に対する貸倒引当金を含みます。詳細については、フィナンシャル・データ・サプルメントの 34
頁をご参照下さい。
NM:重要ではありません。
当期の表示に一致するよう組み替えられています。
4
For Immediate Release
Citigroup Inc. (NYSE: C)
January 15, 2015
CITIGROUP REPORTS FOURTH QUARTER 2014 EARNINGS PER SHARE OF $0.06
NET INCOME OF $350 MILLION
REVENUES OF $17.8 BILLION
LEGAL AND RELATED EXPENSES AND REPOSITIONING CHARGES TOTALED $3.5 BILLION
NET INTEREST MARGIN INCREASED TO 2.92%
NET CREDIT LOSSES OF $2.2 BILLION DECLINED 12% VERSUS PRIOR YEAR PERIOD
UTILIZED APPROXIMATELY $200 MILLION OF DEFERRED TAX ASSETS;
DTA UTILIZATION OF APPROXIMATELY $3.1 BILLION IN 2014
BASEL III COMMON EQUITY TIER 1 CAPITAL RATIO OF 10.5%1
ESTIMATED BASEL III SUPPLEMENTARY LEVERAGE RATIO OF 6.0%2
BOOK VALUE PER SHARE OF $66.16
TANGIBLE BOOK VALUE PER SHARE3 OF $56.83
CITI HOLDINGS ASSETS OF $98 BILLION DECLINED 16% FROM PRIOR YEAR PERIOD
AND REPRESENTED 5% OF TOTAL CITIGROUP ASSETS AT QUARTER END
New York, January 15, 2015 – Citigroup Inc. today reported net income for the fourth quarter 2014 of
$350 million, or $0.06 per diluted share, on revenues of $17.8 billion. This compared to net income of $2.5 billion,
or $0.77 per diluted share, on revenues of $17.8 billion for the fourth quarter 2013. Legal and related expenses
and repositioning charges totaled $3.5 billion in the current quarter, compared to $1.0 billion in the prior year
period.
4
CVA/DVA was $7 million ($4 million after-tax) in the fourth quarter 2014, compared to negative $164 million
(negative $100 million after-tax) in the prior year period. Fourth quarter 2013 results also included a $189 million
after-tax benefit related to the divestiture of Citi’s Credicard business in Brazil and a $235 million after-tax charge
5
related to the net fraud loss in Mexico. Excluding CVA/DVA and the items in the fourth quarter 2013, earnings
were $0.06 per diluted share, compared to prior year earnings of $0.82 per diluted share.
Michael Corbat, Chief Executive Officer of Citigroup, said, "While the overall results for 2014 fell short of our
expectations, we did make significant progress on our top priorities. During the year, we increased our market
share among our target institutional clients, grew our core loan book, and improved both our net interest revenue
and margin from 2013 levels. For the first time since its establishment, Citi Holdings was profitable for the full
year and we accelerated the utilization of our deferred tax assets. We strengthened our capital planning process
and made Citi a safer and stronger institution, as evidenced by the increases to our capital, leverage and liquidity
ratios. Although we made some difficult decisions over the course of the year, I believe they allowed us to put our
franchise in a position to have a successful 2015."
1
Citigroup full year 2014 net income was $7.3 billion on revenues of $76.9 billion, compared to net income of
$13.7 billion on revenues of $76.4 billion for the full year 2013. Full year 2014 results included CVA/DVA of
negative $390 million (negative $240 million after-tax), compared to negative $342 million (negative $213 million
after-tax) in the prior year period. Citigroup full year 2014 results also included a charge of $3.8 billion ($3.7 billion
6
after-tax) to settle RMBS and CDO-related claims. Full year 2013 results also included the benefit related to the
impact of the Credicard divestiture and the net fraud loss. In addition, Citigroup recorded a tax charge of
$210 million in the first quarter of 2014 related to corporate tax reforms enacted in two states, and a tax benefit of
$176 million in the third quarter 2013 related to the resolution of certain tax audit items. Excluding CVA/DVA,
Citigroup revenues were $77.3 billion in 2014, up 1% compared to the prior year. Excluding CVA/DVA as well as
the impact of the mortgage settlement in 2014, Credicard divestiture and net fraud loss in 2013, and the tax items
7
in both years, net income was $11.5 billion in 2014, down 16% compared to 2013, as higher revenues and lower
net credit losses were offset by higher operating expenses, a lower net loan loss reserve release and a higher
effective tax rate.
Fourth Quarter and Full Year Financial Results
Citigroup
QoQ% YoY%
2014
2013
-
71,067
5,815
$76,882
71,853
4,566
$76,419
-1%
27%
1%
-11%
-1%
$77,272
$76,761
1%
$12,292
11%
17%
$55,051
$48,408
14%
$11,932
$51,302
$48,048
4Q'14
3Q'14
4Q'13
Citicorp
Citi Holdings
Total Revenues
16,504
1,308
$17,812
18,016
1,588
$19,604
16,472
1,307
$17,779
-8%
-18%
-9%
Adjusted Revenues(a)
$17,805
$19,975
$17,943
Expenses
$14,426
$12,955
$14,426
$12,955
($ in millions, except per share amounts)
Adjusted Expenses
(a)
%D
11%
21%
Net Credit Losses
(b)
Loan Loss Reserve Build/(Release)
Provision for Benefits and Claims
Total Cost of Credit
2,248
(441)
206
$2,013
2,097
(552)
205
$1,750
2,547
(670)
195
$2,072
7%
20%
15%
-12%
34%
6%
-3%
8,973
(2,307)
801
$7,467
10,463
(2,779)
830
$8,514
-14%
17%
-3%
-12%
Adjusted Cost of Credit(a)
$2,013
$1,750
$2,072
15%
-3%
$7,412
$8,514
-13%
Income (Loss) from Cont. Ops. Before Taxes
Provision for Income Taxes
Income from Continuing Operations
Net income (loss) from Disc. Ops.
Non-Controlling Interest
Citigroup Net Income
$1,373
991
$382
(1)
31
$350
$4,899
1,985
$2,914
(16)
59
$2,839
$3,415
1,090
$2,325
181
50
$2,456
-72%
-50%
-87%
94%
-47%
-88%
-60%
-9%
-84%
NM
-38%
-86%
$14,364
6,864
$7,500
(2)
185
$7,313
$19,497
5,867
$13,630
270
227
$13,673
-26%
17%
-45%
NM
-19%
-47%
$346
$3,067
$2,602
-89%
-87%
$11,489
$13,756
-16%
10.5%
6.0%
0.4%
$66.16
$56.83
10.7%
6.0%
5.3%
$67.11
$57.53
10.1%
5.4%
4.8%
$65.23
$55.31
-1%
-1%
1%
3%
Adjusted Net Income(a)
(c)
Basel III Common Equity Tier 1 Capital Ratio
Estimated Basel III Supplementary Leverage Ratio (d)
Return on Average Common Equity
Book Value per Share
Tangible Book Value per Share (e)
7%
Note: Please refer to the Appendices and Footnotes at the end of this press release for additional information.
(a) Excludes, as applicable, CVA / DVA in all periods, the impact of the mortgage settlement in 2Q'14, the net fraud loss in 4Q'13, the impact of the Credicard divestiture in 4Q'13
and the tax items in 1Q'14 and 3Q'13. For additional information, please refer to Appendix B.
(b) Includes provision for unfunded lending commitments.
(c) For additional information, please refer to Appendix D and Footnote 1.
(d) For additional information, please refer to Footnote 2.
(e) For additional information, please refer to Appendix E and Footnote 3.
Citigroup
Citigroup revenues of $17.8 billion in the fourth quarter 2014 were unchanged from the prior year period.
Excluding CVA/DVA, revenues of $17.8 billion decreased 1% from the prior year period, driven by a 1% decrease
in Citicorp revenues, partially offset by a slight increase in Citi Holdings revenues.
Citigroup’s net income declined to $350 million in the fourth quarter 2014 from $2.5 billion in the prior year
period. Excluding CVA/DVA in both periods and the impact of the Credicard divestiture and the net fraud loss in
the prior year period, Citigroup net income was $346 million versus $2.6 billion in the prior year period, primarily
driven by higher operating expenses and a higher effective tax rate.
2
Citigroup’s operating expenses were $14.4 billion in the fourth quarter 2014, 21% higher than the $11.9 billion
in the prior year period (excluding the impact of the net fraud loss), driven by higher legal and related expenses
and repositioning costs, as well as increased regulatory and compliance costs and higher volume-related
expenses, partially offset by continued efficiency savings and the impact of foreign exchange translation.
Operating expenses in the fourth quarter 2014 included legal and related expenses of $2.9 billion, compared to
$809 million in the prior year period, and $655 million of repositioning charges, compared to $234 million in the
prior year period.
Citigroup’s cost of credit in the fourth quarter 2014 was $2.0 billion, a decrease of 3% from the prior year
period, primarily reflecting a $299 million improvement in net credit losses, partially offset by a lower net release
of loan loss reserves.
Citigroup’s effective tax rate was 72% in the current quarter, an increase from 32% in the prior year period
(excluding CVA/DVA), driven by a significantly higher portion of non-tax-deductible legal and related expenses in
the current quarter.
Citigroup’s allowance for loan losses was $16.0 billion at quarter end, or 2.50% of total loans, compared to
$19.6 billion, or 2.97% of total loans, at the end of the prior year period. The $441 million net release of loan loss
reserves in the current quarter compared to a $670 million release in the prior year period. Citigroup asset quality
continued to improve as total non-accrual assets fell to $7.4 billion, a 22% reduction compared to the fourth
quarter 2013. Corporate non-accrual loans declined 38% to $1.2 billion, while consumer non-accrual loans
declined 17% to $5.9 billion.
Citigroup’s loans were $645 billion as of quarter end, down 3% from the prior year period. On a constant dollar
8
basis, Citigroup’s loans declined by 1%, as continued declines in Citi Holdings, driven primarily by reductions in
the North America mortgage portfolio, offset 3% growth in Citicorp.
Citigroup’s deposits were $899 billion as of quarter end, down 7% from the prior year period. In constant
dollars, Citigroup’s deposits were down 4%, primarily driven by the reclassification of $21 billion of deposits in
Asia to other liabilities reflecting held-for-sale treatment as a result of Citigroup entering into an agreement to sell
its retail banking business in Japan, as well as the continued reduction in Citi Holdings deposits.
Citigroup’s book value per share was $66.16 and its tangible book value per share was $56.83, each as of
quarter end, representing 1% and 3% increases, respectively, versus the prior year period. At quarter end,
9
Citigroup’s Basel III Common Equity Tier 1 Capital ratio was 10.5%, up from 10.1% in the prior year period.
Citigroup’s estimated Basel III Supplementary Leverage ratio for the fourth quarter 2014 was 6.0%, up from 5.4%
in the prior year period.
3
Citicorp
($ in millions)
Global Consumer Banking
Institutional Clients Group
Corporate/Other
Total Revenues
Adjusted Revenues
(a)
Expenses
Adjusted Expenses
(a)
Net Credit Losses
(b)
Loan Loss Reserve Build/(Release)
Provision for Benefits and Claims
Total Cost of Credit
QoQ% YoY%
2014
2013
2%
NM
-
37,753
33,267
47
$71,067
38,165
33,567
121
$71,853
-1%
-1%
-61%
-1%
-10%
-1%
$71,410
$72,198
-1%
$10,799
13%
27%
$47,336
$42,438
12%
$10,439
13%
31%
$47,336
$42,078
12%
4Q'14
3Q'14
4Q'13
9,442
7,199
(137)
$16,504
9,637
8,371
8
$18,016
9,469
7,044
(41)
$16,472
-2%
-14%
NM
-8%
$16,492
$18,332
$16,637
$13,661
$12,063
$13,661
$12,063
1,867
(226)
55
$1,696
1,750
(408)
52
$1,394
1,812
(130)
52
$1,734
7%
45%
6%
22%
3%
-74%
6%
-2%
Net Income
$192
$2,601
$2,888
-93%
-93%
$10,683
$15,606
-32%
Adjusted Net Income(a)
$185
$2,795
$3,034
-93%
-94%
$11,104
$15,690
-29%
Adjusted Revenues(a)
North America
EMEA
LATAM
Asia
Corporate/Other
7,490
2,363
3,236
3,540
(137)
8,150
2,887
3,395
3,892
8
7,199
2,411
3,550
3,518
(41)
-8%
-18%
-5%
-9%
NM
4%
-2%
-9%
1%
NM
31,940
11,145
13,486
14,792
47
31,512
11,514
13,997
15,054
121
1%
-3%
-4%
-2%
-61%
1,751
168
535
869
(3,105)
2,063
632
646
1,123
(1,598)
1,321
413
806
804
(256)
-15%
-73%
-17%
-23%
-94%
33%
-59%
-34%
8%
NM
8,286
2,145
2,569
3,670
(5,383)
7,214
2,497
3,194
3,721
(806)
15%
-14%
-20%
-1%
NM
1,745
572
889
1,780
576
928
1,763
573
932
-2%
-1%
-4%
-1%
-5%
1,745
572
889
1,763
573
932
-1%
-5%
Adjusted Income from Continuing Ops.(a)
North America
EMEA
LATAM
Asia
Corporate/Other
EOP Assets ($B)
EOP Loans ($B)
EOP Deposits ($B)
7,327
(1,404)
199
$6,122
7,393
(736)
212
$6,869
%D
-1%
-91%
-6%
-11%
Note: Please refer to the Appendices and Footnotes at the end of this press release for additional information.
(a) Excludes, as applicable, CVA / DVA in all periods, the net fraud loss in 4Q'13, the impact of the Credicard divestiture in 4Q'13 and the tax items in 1Q'14 and 3Q'13. For
additional information, please refer to Appendix B.
(b) Includes provision for unfunded lending commitments.
Citicorp
Citicorp revenues of $16.5 billion in the fourth quarter 2014 were unchanged from the prior year period.
CVA/DVA, reported within Institutional Clients Group (ICG), was $12 million in the fourth quarter 2014 ($7 million
after-tax), compared to negative $165 million (negative $100 million after-tax) in the prior year period. Excluding
CVA/DVA, revenues were down 1% from the fourth quarter 2013, as ICG and Global Consumer Banking (GCB)
revenues were largely unchanged, and Corporate/Other revenues decreased. Corporate/Other revenues were
negative $137 million, versus negative $41 million in the prior year period, primarily due to lower revenues from
sales of available-for-sale securities as well as hedging activities.
Citicorp net income was $192 million, versus $2.9 billion in the prior year period. Excluding CVA/DVA and the
impact of the Credicard divestiture and the net fraud loss in the prior year period, Citicorp’s net income was $185
million, versus $3.0 billion in the prior year period, primarily driven by higher operating expenses and a higher
effective tax rate.
Citicorp operating expenses were $13.7 billion, a 31% increase from the prior year period (excluding the impact
of the net fraud loss), primarily reflecting higher legal and related expenses (primarily recorded in
Corporate/Other), higher repositioning charges, increased regulatory and compliance costs, as well as volumerelated expenses, partially offset by ongoing efficiency savings and the impact of foreign exchange translation.
Operating expenses in the fourth quarter 2014 included legal and related expenses of $2.8 billion, compared to
$159 million in the prior year period, and $637 million of repositioning charges, compared to $204 million in the
prior year period.
4
Citicorp cost of credit of $1.7 billion in the fourth quarter 2014 declined 2% from the prior year period. A higher
net loan loss reserve release and lower net credit losses in North America GCB were partially offset by higher net
credit losses in ICG and international GCB. Citicorp’s consumer loans 90+ days delinquent decreased 10% from
the prior year period to $2.7 billion, and the 90+ days delinquency ratio improved to 0.90% of loans.
Citicorp end of period loans were unchanged versus the prior year period at $572 billion, with 1% growth in
corporate loans to $274 billion and a 2% decrease in consumer loans to $297 billion. On a constant dollar basis,
Citicorp end of period loans grew 3% versus the prior year period, with 4% growth in corporate loans and 2%
growth in consumer loans.
Global Consumer Banking
QoQ% YoY%
2014
2013
4%
-15%
-6%
-2%
-
19,645
1,358
9,204
7,546
$37,753
19,776
1,449
9,316
7,624
$38,165
1%
-
$21,277
$21,187
29%
6%
8%
-2%
NM
6%
-16%
-14%
8%
858
(1)
371
313
-4%
NM
-24%
-24%
33%
NM
-31%
-
4,421
(7)
1,204
1,320
145
151
329
23
99
-1%
-2%
-19%
6%
-3%
3%
-1%
3%
1%
142
156
331
108
375
4Q'14
3Q'14
4Q'13
North America
EMEA
LATAM
Asia
Total Revenues
5,091
305
2,255
1,791
$9,442
4,989
347
2,357
1,944
$9,637
4,874
358
2,403
1,834
$9,469
2%
-12%
-4%
-8%
-2%
Expenses
$5,345
$5,281
$5,361
Net Credit Losses
(a)
Loan Loss Reserve Build/(Release)
Provision for Benefits and Claims
Total Cost of Credit
1,746
(268)
55
$1,533
1,738
(375)
52
$1,415
1,787
(9)
52
$1,830
Net Income
$1,666
$1,928
$1,539
($ in millions)
Income from Continuing Operations
North America
EMEA
LATAM
Asia
(in billions of dollars)
Avg. Cards Loans
Avg. Retail Banking Loans
Avg. Deposits
Investment Sales
Cards Purchase Sales
1,139
(38)
256
312
141
156
327
24
100
1,185
1
338
413
142
158
333
30
94
%D
-1%
-6%
-1%
-1%
-1%
-
7,051
(1,185)
199
$6,065
7,211
(632)
212
$6,791
-2%
-88%
-6%
-11%
$6,912
$6,746
2%
3,910
35
1,337
1,481
13%
NM
-10%
-11%
141
147
327
103
365
1%
6%
1%
5%
3%
Note: Please refer to the Appendices and Footnotes at the end of this press release for additional information.
(a) Includes provision for unfunded lending commitments.
Global Consumer Banking
GCB revenues of $9.4 billion were unchanged from the prior year period, as growth in North America was offset
by a decline in international revenues on a reported basis. On a constant dollar basis, revenues increased 3%,
due to the growth in North America and 1% growth in international revenues.
GCB net income rose 8% versus the prior year period to $1.7 billion, reflecting a lower cost of credit. Operating
expenses were unchanged at $5.3 billion, but increased 3% in constant dollars, mostly reflecting higher
repositioning charges, partially offset by ongoing cost reduction initiatives.
North America GCB revenues rose 4% to $5.1 billion versus the prior year period, reflecting higher revenues in
retail banking, partially offset by lower revenues in Citi retail services. Retail banking revenues rose 25% to
$1.4 billion from the fourth quarter 2013, reflecting 10% growth in average loans and 1% growth in average
deposits, as well as a gain of approximately $130 million related to the sale of certain on-balance sheet mortgage
loans in the current quarter. Citi-branded cards revenues of $2.1 billion were unchanged versus the prior year
period, as purchase sales grew 4% and an improvement in spreads mostly offset the impact of lower average
loans. Citi retail services revenues decreased 3% to $1.6 billion, primarily reflecting higher contractual partner
payments driven by higher yields and improved credit.
5
North America GCB net income was $1.1 billion, up 33% versus the fourth quarter 2013, driven by the increase
in revenues and reduced credit costs, partially offset by higher operating expenses. Operating expenses were up
1% versus the prior year period to $2.5 billion, as higher repositioning charges and increased marketing costs
were partially offset by ongoing efficiency savings.
North America GCB credit quality continued to improve as net credit losses of $1.0 billion decreased 8% versus
the prior year period. Net credit losses improved versus the prior year period in Citi-branded cards (down 13% to
$514 million) and in Citi retail services (down 2% to $463 million). The reserve release in the fourth quarter 2014
was $244 million, $160 million higher than in the fourth quarter 2013, due to continued improvement in each of the
cards portfolios. Delinquency rates improved from the prior year period in both Citi-branded cards and Citi retail
services.
International GCB revenues decreased 5% versus the fourth quarter 2013 to $4.4 billion. In constant dollars,
revenues increased 1% versus the fourth quarter 2013. Revenues in Latin America increased 1% to $2.3 billion,
primarily driven by volume growth in Mexico. In Asia, revenues rose by 1% to $1.8 billion, primarily driven by
volume growth, partially offset by spread compression and the impact of regulatory changes in certain markets. In
EMEA, revenues declined 2% to $305 million as spread compression offset higher volumes.
International GCB net income decreased 23% from the prior year period to $527 million, and decreased 18% in
constant dollars. On a constant dollar basis, the slightly higher revenues were offset by higher operating
expenses. Operating expenses in the fourth quarter 2014 increased 5% in constant dollars (decreased 1% on a
reported basis) as higher repositioning charges as well as the impact of business growth and higher non-income
tax expenses were partially offset by ongoing efficiency savings. In constant dollars, credit costs increased 1%
versus the prior year period, as reserve releases in Asia were offset by higher credit costs in Latin America and
EMEA.
International GCB credit quality remained stable. Net credit losses rose 8% to $733 million, including a chargeoff of approximately $70 million related to Citi’s homebuilder exposure in Mexico, which was offset by a related
release of previously established loan loss reserves, and therefore neutral to the cost of credit in the current
period. The international net credit loss rate was 2.09% of average loans in the fourth quarter 2014, compared to
1.93% in the prior year period. Excluding the charge-off associated with homebuilder exposure in Mexico, the
international net credit loss rate would have improved to 1.88%.
6
Institutional Clients Group
($ in millions)
4Q'14
3Q'14
4Q'13
Treasury & Trade Solutions
Investment Banking
Private Bank
Corporate Lending(a)
Total Banking
Fixed Income Markets
Equity Markets
Securities Services
Other
Total Markets & Securities Services
Product Revenues(b)
Gain / (loss) on Loan Hedges
Total Revenues ex-CVA / DVA
CVA / DVA
Total Revenues
1,960
1,065
666
431
4,122
1,988
471
574
(54)
2,979
$7,101
86
7,187
12
$7,199
1,965
1,248
663
442
4,318
2,981
763
600
(66)
4,278
$8,596
91
8,687
(316)
$8,371
1,938
1,146
599
395
4,078
2,375
484
554
(143)
3,270
$7,348
(139)
7,209
(165)
$7,044
Expenses
$5,035
$5,040
Adjusted Expenses(c)
$5,035
$5,040
Net Credit Losses
(d)
Credit Reserve Build/(Release)
Total Cost of Credit
Net Income
Adjusted Net Income
Adjusted Revenues
North America
EMEA
LATAM
Asia
(c)
121
42
$163
12
(33)
$(21)
QoQ% YoY%
2014
2013
%D
-15%
-2%
-5%
-33%
-38%
-4%
18%
-30%
-17%
-5%
-17%
NM
-14%
1%
-7%
11%
9%
1%
-16%
-3%
4%
62%
-9%
-3%
NM
NM
2%
7,882
4,703
2,653
1,742
16,980
11,815
2,776
2,333
(410)
16,514
$33,494
116
33,610
(343)
$33,267
7,819
4,411
2,487
1,513
16,230
13,322
2,818
2,272
(443)
17,969
$34,199
(287)
33,912
(345)
$33,567
1%
7%
7%
15%
5%
-11%
-1%
3%
7%
-8%
-2%
NM
-1%
1%
-1%
$5,245
-
-4%
$19,960
$20,218
-1%
$4,885
-
3%
$19,960
$19,858
1%
NM
NM
NM
NM
NM
NM
25
(121)
$(96)
276
(219)
$57
182
(104)
$78
52%
NM
-27%
$1,637
$2,291
$1,450
-29%
13%
$9,410
$9,304
1%
$1,630
$2,485
$1,785
-34%
-9%
$9,621
$9,753
-1%
2,399
2,058
981
1,749
3,161
2,540
1,038
1,948
2,325
2,053
1,147
1,684
-24%
-19%
-5%
-10%
3%
-14%
4%
12,295
9,787
4,282
7,246
11,736
10,065
4,681
7,430
5%
-3%
-9%
-2%
612
206
279
557
878
631
308
710
463
414
435
491
-30%
-67%
-9%
-22%
32%
-50%
-36%
13%
3,865
2,152
1,365
2,350
3,304
2,462
1,857
2,240
17%
-13%
-26%
5%
(c)
Adjusted Income from Continuing Ops.(c)
North America
EMEA
LATAM
Asia
Note: Please refer to the Appendices and Footnotes at the end of this press release for additional information.
(a) Excludes gain / (loss) on loan hedges. For additional information, please refer to Footnote 10.
(b) Excludes CVA / DVA and gain / (loss) on loan hedges.
(c) Excludes, as applicable, CVA / DVA in all periods and the net fraud loss in 4Q'13. For additional information, please refer to Appendix B.
(d) Includes provision for unfunded lending commitments.
Institutional Clients Group
ICG revenues rose 2% from the prior year period to $7.2 billion. Excluding the impact of CVA/DVA, revenues
were unchanged from the prior year period, as higher revenues in Banking and increased gains on loan hedges
were offset by lower revenues in Markets and Securities Services.
Banking revenues of $4.1 billion increased 1% from the prior year period (excluding gain / (loss) on loan hedges
in each period), primarily reflecting growth in Private Bank and Corporate Lending revenues. Treasury and Trade
Solutions revenues of $2.0 billion were up 1% versus the prior year period as growth in deposits and fees more
than offset a decline in trade balances and spreads. Investment Banking revenues decreased 7% versus the prior
year period, driven by a 19% decrease in equity underwriting revenues to $252 million, a 4% decrease in debt
underwriting revenues to $550 million and a 1% decrease in advisory revenues to $263 million. Private Bank
revenues increased 11% to $666 million from the prior year period (excluding negative $4 million of CVA/DVA)
driven by increased client volumes and growth in investment and capital markets products. Corporate Lending
revenues rose 9% versus the prior year period to $431 million (excluding gain / (loss) on loan hedges in each
period) reflecting growth in average loans and lower funding costs.
Markets and Securities Services revenues of $3.0 billion (excluding $17 million of CVA/DVA, versus negative
$165 million in the fourth quarter 2013) fell 9% from the prior year period. Fixed Income Markets revenues of
7
$2.0 billion in the fourth quarter 2014 (excluding $9 million of CVA/DVA, compared to negative $153 million in the
prior year period) decreased 16% from the prior year period, driven by difficult trading conditions in spread
products as well as a challenging macroeconomic environment that impacted the rates business. Equity Markets
revenues of $471 million (excluding $7 million of CVA/DVA) were down 3% versus the prior year period, driven by
lower trading revenues in cash equities in EMEA. Securities Services revenues of $574 million grew 4% versus
the prior year period, reflecting increased client balances and activity.
ICG net income was $1.6 billion in the fourth quarter 2014. Excluding CVA/DVA and the net fraud loss in the
fourth quarter 2013, net income decreased 9% from the prior year period, driven by higher operating expenses
and an increase in the cost of credit. Operating expenses (excluding the impact of the net fraud loss in the prior
year period) grew 3% to $5.0 billion as lower compensation expenses and the impact of foreign exchange
translation were more than offset by higher repositioning costs as well as higher external legal and consulting
fees. Credit costs increased by $259 million over the prior year period related to an episodic charge-off as well as
a loan loss reserve build driven by the overall economic environment.
ICG average loans grew 3% versus the prior year period to $277 billion while end of period deposits declined 3%
to $559 billion. In constant dollars, average loans were up 5% versus the prior year period, while end of period
deposits increased 1%.
Citi Holdings
($ in millions)
Total Revenues
Adjusted Revenues
(a)
Expenses
Adjusted Expenses
(a)
Net Credit Losses
Loan Loss Reserve Build/(Release)(b)
Provision for Benefits and Claims
Total Cost of Credit
Adjusted Cost of Credit
(a)
Net Income (Loss)
Adjusted Net Income
(a)
EOP Assets ($ in billions)
EOP Loans ($B)
EOP Deposits ($B)
QoQ% YoY%
4Q'14
3Q'14
4Q'13
$1,308
$1,588
$1,307
-18%
$1,313
$1,643
$1,306
-20%
$765
$892
$1,493
-14%
$765
$892
$1,493
381
(215)
151
$317
347
(144)
153
$356
$317
$158
2014
2013
-
$5,815
$4,566
27%
1%
$5,862
$4,563
28%
-49%
$7,715
$5,970
29%
%D
-14%
-49%
$3,966
$5,970
-34%
735
(540)
143
$338
10%
-49%
-1%
-11%
-48%
60%
6%
-6%
1,646
(903)
602
$1,345
3,070
(2,043)
618
$1,645
-46%
56%
-3%
-18%
$356
$338
-11%
-6%
$1,290
$1,645
-22%
$238
$(432)
-34%
NM
$(3,370)
$(1,933)
-74%
$161
$272
$(432)
-41%
NM
$385
$(1,934)
NM
98
73
10
103
78
14
117
93
36
-5%
-6%
-31%
-16%
-21%
-72%
98
73
10
117
93
36
-16%
-21%
-72%
Note: Please refer to the Appendices and Footnotes at the end of this press release for additional information.
(a) Excludes, as applicable, CVA / DVA in all periods and the impact of the mortgage settlement in 2Q'14. For additional information, please refer to Appendix B.
(b) Includes provision for unfunded lending commitments.
Citi Holdings
Citi Holdings revenues of $1.3 billion in the fourth quarter 2014 included CVA/DVA of negative $5 million,
compared to $1 million in the prior year period. Excluding CVA/DVA, Citi Holdings revenues increased slightly
from the prior year period driven by higher gains on asset sales and lower cost of funds. As of the end of the
quarter, Citi Holdings assets were $98 billion, 16% below the prior year period, and represented approximately
5% of total Citigroup assets.
Citi Holdings net income, excluding CVA/DVA, was $161 million, up from a loss of $432 million in the prior year
period, reflecting lower operating expenses and lower net credit losses, partially offset by a lower net loan loss
reserve release. Operating expenses in the fourth quarter 2014 declined 49% from the prior year period to $765
million, driven by the ongoing decline in Citi Holdings assets as well as lower legal and related expenses
($61 million in the fourth quarter 2014, compared to $650 million in the prior year period). Net credit losses
decreased 48% from the prior year period to $381 million, primarily driven by continued credit improvements and
reductions in the North America mortgage portfolio. The net loan loss reserve release decreased 60% from the
prior year period to $215 million, primarily due to lower releases related to the North America mortgage portfolio.
8
Citi Holdings allowance for credit losses was $4.5 billion at the end of the fourth quarter 2014, or 6.20% of
loans, compared to $6.5 billion, or 6.98% of loans, in the prior year period. 90+ days delinquent consumer loans in
Citi Holdings decreased 28% to $2.0 billion, or 2.88% of loans.
Citicorp Results by Region (a)
($ in millions)
Revenues
3Q'14
4Q'14
4Q'13
Income from Continuing Ops.
4Q'14
3Q'14
4Q'13
North America
Global Consumer Banking
Institutional Clients Group
Total North America
5,091
2,399
$7,490
4,989
3,161
$8,150
4,874
2,325
$7,199
EMEA
Global Consumer Banking
Institutional Clients Group
Total EMEA
305
2,058
$2,363
347
2,540
$2,887
358
2,053
$2,411
(38)
206
$168
1
631
$632
(1)
414
$413
Latin America
Global Consumer Banking
Institutional Clients Group
Total Latin America
2,255
981
$3,236
2,357
1,038
$3,395
2,403
1,147
$3,550
256
279
$535
338
308
$646
371
435
$806
Asia
Global Consumer Banking
Institutional Clients Group
Total Asia
1,791
1,749
$3,540
1,944
1,948
$3,892
1,834
1,684
$3,518
312
557
$869
413
710
$1,123
313
491
$804
$(1,598)
$(256)
Corporate/Other
Citicorp
$(137)
$16,492
$8
$18,332
$(41)
$16,637
1,139
612
$1,751
1,185
878
$2,063
$(3,105)
$218
$2,866
858
463
$1,321
$3,088
Note: Totals may not sum due to rounding. Please refer to the Appendices and Footnotes at the end of this press release for additional information.
(a) Excludes, as applicable, CVA / DVA in all periods, the net fraud loss in 4Q'13 and the impact of the Credicard divestiture in 4Q'13. For additional information, please
refer to Appendix B.
Citicorp Results by Region (a)
($ in millions)
Revenues
2014
Income from Continuing Ops.
2014
2013
2013
North America
Global Consumer Banking
Institutional Clients Group
Total North America
19,645
12,295
$31,940
19,776
11,736
$31,512
4,421
3,865
$8,286
3,910
3,304
$7,214
EMEA
Global Consumer Banking
Institutional Clients Group
Total EMEA
1,358
9,787
$11,145
1,449
10,065
$11,514
(7)
2,152
$2,145
35
2,462
$2,497
Latin America
Global Consumer Banking
Institutional Clients Group
Total Latin America
9,204
4,282
$13,486
9,316
4,681
$13,997
1,204
1,365
$2,569
1,337
1,857
$3,194
Asia
Global Consumer Banking
Institutional Clients Group
Total Asia
7,546
7,246
$14,792
7,624
7,430
$15,054
1,320
2,350
$3,670
1,481
2,240
$3,721
Corporate/Other
Citicorp
$47
$121
$71,410
$72,198
$(5,383)
$11,287
$(806)
$15,820
Note: Totals may not sum due to rounding. Please refer to the Appendices and Footnotes at the end of this press release for additional information.
(a) Excludes, as applicable, CVA / DVA in all periods, the tax items in 1Q'14 and 3Q'13, the impact of the Credicard divestiture in 4Q'13 and the net fraud loss in 4Q'13. For
additional information, please refer to Appendix B.
Citigroup will host a conference call today at 11:00 AM (ET). A live webcast of the presentation, as well as
financial results and presentation materials, will be available at http://www.citigroup.com/citi/investor. Dial-in
numbers for the conference call are as follows: (866) 516-9582 in the U.S. and Canada; (973) 409-9210 outside
of the U.S. and Canada. The conference code for both numbers is 40654645.
Citigroup, the leading global bank, has approximately 200 million customer accounts and does business in more
than 160 countries and jurisdictions. Citigroup provides consumers, corporations, governments and institutions
9
with a broad range of financial products and services, including consumer banking and credit, corporate and
investment banking, securities brokerage, transaction services, and wealth management.
Additional information may be found at www.citigroup.com | Twitter: @Citi | YouTube: www.youtube.com/citi |
Blog: http://blog.citigroup.com | Facebook: www.facebook.com/citi | LinkedIn: www.linkedin.com/company/citi
Additional financial, statistical, and business-related information, as well as business and segment trends, is
included in a Quarterly Financial Data Supplement. Both this earnings release and Citigroup’s Fourth Quarter
2014 Quarterly Financial Data Supplement are available on Citigroup’s website at www.citigroup.com.
Certain statements in this release are “forward-looking statements” within the meaning of the U.S. Private
Securities Litigation Reform Act of 1995. These statements are based on management’s current expectations and
are subject to uncertainty and changes in circumstances. These statements are not guarantees of future results
or occurrences. Actual results and capital and other financial condition may differ materially from those included in
these statements due to a variety of factors, including the precautionary statements included in this release and
those contained in Citigroup’s filings with the U.S. Securities and Exchange Commission, including without
limitation the “Risk Factors” section of Citigroup’s 2013 Annual Report on Form 10-K. Any forward-looking
statements made by or on behalf of Citigroup speak only as to the date they are made, and Citigroup does not
undertake to update forward-looking statements to reflect the impact of circumstances or events that arise after
the date the forward-looking statements were made.
Contacts:
Press: Mark Costiglio
Kamran Mumtaz
(212) 559-4114
(212) 793-7682
Investors:
Fixed Income Investors:
Susan Kendall
Peter Kapp
(212) 559-2718
(212) 559-5091
10
Appendix A: CVA / DVA
CVA / DVA
4Q'14
3Q'14
4Q'13
2014
2013
($ in millions)
Institutional Clients Group
Counterparty CVA (1)
Asset FVA
Own-Credit CVA (1)
Liability FVA
(1)
Derivatives CVA
DVA on Citi Liabilities at Fair Value
Total Institutional Clients Group CVA / DVA
Citi Holdings
Counterparty CVA (1)
Asset FVA
(1)
Own-Credit CVA
Liability FVA
Derivatives CVA(1)
DVA on Citi Liabilities at Fair Value
Total Citi Holdings CVA / DVA
Total Citigroup CVA / DVA
$(90)
(33)
9
13
$(102)
114
$12
$(25)
(436)
27
6
$(427)
111
$(316)
$102
(108)
$(6)
(159)
$(165)
$(63)
(469)
(43)
19
$(556)
214
$(343)
$265
(208)
$57
(402)
$(345)
1
(5)
(3)
$(6)
1
$(5)
$7
(44)
(12)
$(55)
1
$(55)
$(371)
15
(11)
$4
(2)
$1
$(164)
20
(49)
(22)
$(51)
4
$(47)
$(390)
27
(14)
$13
(10)
$3
$(342)
Note: Totals may not sum due to rounding.
(1) Net of hedges.
Appendix B: Non-GAAP Financial Measures - Adjusted Items
Citigroup
4Q'14
3Q'14
4Q'13
2014
2013
Reported Revenues (GAAP)
Impact of:
CVA / DVA
Adjusted Revenues
$17,812
$19,604
$17,779
$76,882
$76,419
7
$17,805
(371)
$19,975
(164)
$17,943
(390)
$77,272
(342)
$76,761
Reported Expenses (GAAP)
Impact of:
Net Fraud Loss
Mortgage Settlement
Adjusted Expenses
$14,426
$12,955
$12,292
$55,051
$48,408
$14,426
$12,955
(360)
$11,932
(3,749)
$51,302
(360)
$48,048
$2,013
$1,750
$2,072
$7,467
$8,514
$2,013
$1,750
$2,072
(55)
$7,412
$8,514
$350
$2,839
$2,456
$7,313
$13,673
4
$346
159
$187
$0.06
(228)
$3,067
128
$2,939
$0.88
(100)
189
(235)
$2,602
71
$2,531
$0.77
(240)
(210)
(3,726)
$11,489
511
$10,978
$2.20
(213)
189
(235)
176
$13,756
194
$13,562
$4.35
0.00
$0.06
(0.08)
$0.95
(0.03)
0.06
(0.08)
$0.82
(0.07)
(0.07)
(1.21)
$3.55
(0.07)
0.06
(0.08)
0.06
$4.37
($ in millions, except per share amounts)
Reported Cost of Credit (GAAP)
Impact of:
Mortgage Settlement
Adjusted Cost of Credit
Reported Net Income (GAAP)
Impact of:
CVA / DVA
Credicard
Net Fraud Loss
Tax Item
Mortgage Settlement
Adjusted Net Income
Preferred Dividends
Adjusted Net Income to Common
Reported EPS (GAAP)
Impact of:
CVA / DVA
Credicard
Net Fraud Loss
Tax Item
Mortgage Settlement
Adjusted EPS
11
Appendix B: Non-GAAP Financial Measures - Adjusted Items (Cont.)
Citicorp
4Q'14
3Q'14
4Q'13
2014
2013
Reported Revenues (GAAP)
Impact of:
CVA / DVA
Adjusted Revenues
$16,504
$18,016
$16,472
$71,067
$71,853
12
$16,492
(316)
$18,332
(165)
$16,637
(343)
$71,410
(345)
$72,198
Reported Expenses (GAAP)
Impact of:
Net Fraud Loss
Adjusted Expenses
$13,661
$12,063
$10,799
$47,336
$42,438
$13,661
$12,063
(360)
$10,439
$47,336
(360)
$42,078
$192
$2,601
$2,888
$10,683
$15,606
7
$185
(194)
$2,795
(100)
189
(235)
$3,034
(211)
(210)
$11,104
(214)
189
(235)
176
$15,690
($ in millions)
Reported Net Income (GAAP)
Impact of:
CVA / DVA
Credicard
Net Fraud Loss
Tax Item
Adjusted Net Income
Institutional Clients Group
4Q'14
3Q'14
4Q'13
2014
2013
Reported Revenues (GAAP)
Impact of:
CVA / DVA
Adjusted Revenues
$7,199
$8,371
$7,044
$33,267
$33,567
12
$7,187
(316)
$8,687
(165)
$7,209
(343)
$33,610
(345)
$33,912
Reported Expenses (GAAP)
Impact of:
Net Fraud Loss
Adjusted Expenses
$5,035
$5,040
$5,245
$19,960
$20,218
$5,035
$5,040
(360)
$4,885
$19,960
(360)
$19,858
Reported Net Income (GAAP)
Impact of:
CVA / DVA
Net Fraud Loss
Adjusted Net Income
$1,637
$2,291
$1,450
$9,410
$9,304
7
$1,630
(194)
$2,485
(100)
(235)
$1,785
(211)
$9,621
(214)
(235)
$9,753
2014
2013
($ in millions)
Corp / Other
4Q'14
3Q'14
4Q'13
Reported Net Income (GAAP)
Impact of:
Credicard
Tax Item
Adjusted Net Income
$(3,111)
$(1,618)
$(101)
$(5,639)
$(444)
$(3,111)
$(1,618)
189
$(290)
(210)
$(5,429)
189
176
$(809)
Citi Holdings
4Q'14
3Q'14
4Q'13
2014
2013
Reported Revenues (GAAP)
Impact of:
CVA / DVA
Adjusted Revenues
$1,308
$1,588
$1,307
$5,815
$4,566
(5)
$1,313
(55)
$1,643
1
$1,306
(47)
$5,862
3
$4,563
Reported Expenses (GAAP)
Impact of:
Mortgage Settlement
Adjusted Expenses
$765
$892
$1,493
$7,715
$5,970
$765
$892
$1,493
(3,749)
$3,966
$5,970
Reported Cost of Credit (GAAP)
Impact of:
Mortgage Settlement
Adjusted Cost of Credit
$317
$356
$338
$1,345
$1,645
$317
$356
$338
(55)
$1,290
$1,645
Reported Net Income (GAAP)
Impact of:
CVA / DVA
Mortgage Settlement
Adjusted Net Income
$158
$238
$(432)
$(3,370)
$(1,933)
(3)
$161
(34)
$272
$(432)
(29)
(3,726)
$385
1
$(1,934)
($ in millions)
($ in millions)
12
Appendix C: Non-GAAP Financial Measures - Excluding Impact of FX Translation
Int'l Consumer Banking
4Q'14
3Q'14
4Q'13
2014
2013
($ in millions)
Reported Revenues
Impact of FX Translation
Revenues in Constant Dollars
$4,351
$4,351
$4,648
(205)
$4,443
$4,595
(278)
$4,317
$18,108
$18,108
$18,389
(674)
$17,715
Reported Expenses
Impact of FX Translation
Expenses in Constant Dollars
$2,846
$2,846
$2,877
(131)
$2,746
$2,879
(163)
$2,716
$11,601
$11,601
$11,337
(373)
$10,964
Reported Credit Costs
Impact of FX Translation
Credit Costs in Constant Dollars
$753
$753
$726
(42)
$684
$792
(50)
$742
$3,070
$3,070
$3,127
(122)
$3,005
Reported EBT
Impact of FX Translation
EBT in Constant Dollars
$752
$752
$1,045
(32)
$1,013
$924
(65)
$859
$3,437
$3,437
$3,925
(179)
$3,746
Reported Net Income
Impact of FX Translation
Net Income in Constant Dollars
$527
$527
$742
(16)
$726
$682
(36)
$646
$2,490
$2,490
$2,838
(120)
$2,718
EMEA Consumer Banking
4Q'14
2014
2013
3Q'14
4Q'13
($ in millions)
Reported Revenues
Impact of FX Translation
Revenues in Constant Dollars
$305
$305
$347
(25)
$322
$358
(46)
$312
$1,358
$1,358
$1,449
(72)
$1,377
Reported Expenses
Impact of FX Translation
Expenses in Constant Dollars
$329
$329
$326
(28)
$298
$349
(39)
$310
$1,283
$1,283
$1,359
(59)
$1,300
2014
2013
Latam Consumer Banking
4Q'14
3Q'14
4Q'13
($ in millions)
Reported Revenues
Impact of FX Translation
Revenues in Constant Dollars
$2,255
$2,255
$2,357
(120)
$2,237
$2,403
(175)
$2,228
$9,204
$9,204
$9,316
(446)
$8,870
Reported Expenses
Impact of FX Translation
Expenses in Constant Dollars
$1,370
$1,370
$1,378
(64)
$1,314
$1,381
(86)
$1,295
$5,422
$5,422
$5,392
(232)
$5,160
Asia Consumer Banking
4Q'14
2014
2013
3Q'14
4Q'13
($ in millions)
Reported Revenues
Impact of FX Translation
Revenues in Constant Dollars
$1,791
$1,791
$1,944
(60)
$1,884
$1,834
(57)
$1,777
$7,546
$7,546
$7,624
(156)
$7,468
Reported Expenses
Impact of FX Translation
Expenses in Constant Dollars
$1,147
$1,147
$1,173
(39)
$1,134
$1,149
(38)
$1,111
$4,896
$4,896
$4,586
(82)
$4,504
13
Appendix C: Non-GAAP Financial Measures - Excluding Impact of FX Translation (Cont.)
Citigroup
4Q'14
3Q'14
4Q'13
2014
2013
($ in Billions)
Reported EOP Loans
Impact of FX Translation
EOP Loans in Constant Dollars
$645
$645
$654
(10)
$644
$666
(17)
$649
$645
$645
$666
(17)
$649
Reported EOP Deposits
Impact of FX Translation
EOP Deposits in Constant Dollars
$899
$899
$943
(16)
$927
$968
(30)
$939
$899
$899
$968
(30)
$939
Citicorp
4Q'14
3Q'14
4Q'13
2014
2013
($ in Billions)
Reported EOP Loans
Impact of FX Translation
EOP Loans in Constant Dollars
$572
$572
$576
(10)
$566
$573
(16)
$557
$572
$572
$573
(16)
$557
Reported EOP Deposits
Impact of FX Translation
EOP Deposits in Constant Dollars
$889
$889
$928
(16)
$913
$932
(29)
$903
$889
$889
$932
(29)
$903
Institutional Clients Group
4Q'14
3Q'14
4Q'13
2014
2013
($ in Billions)
Reported Average Loans
Impact of FX Translation
Average Loans in Constant Dollars
$277
$277
$278
(3)
$275
$268
(5)
$263
$277
$277
$256
(2)
$253
Reported EOP Deposits
Impact of FX Translation
EOP Deposits in Constant Dollars
$559
$559
$567
(9)
$558
$574
(19)
$555
$559
$559
$574
(19)
$555
14
Appendix D: Non-GAAP Financial Measures - Basel III Common Equity Tier 1 Capital and Ratio (1)
($ in millions)
(3)
Citigroup Common Stockholders' Equity
Add: Qualifying noncontrolling interests
Regulatory Capital Adjustments and Deductions:
Less:
Accumulated net unrealized losses on cash flow hedges, net of tax(4)
Cumulative unrealized net gain related to changes in fair value of financial
liabilities attributable to own creditworthiness, net of tax(5)
12/31/2014(2)
9/30/2014
12/31/2013
$200,190
165
$203,421
172
$197,694
182
(909)
(979)
(1,245)
279
193
177
22,792
23,678
24,518
4,305
4,307
4,950
936
1,179
1,125
36,411
36,453
42,754
$136,541
$138,762
$125,597
$1,299,000
$1,302,000
$1,242,000(8)
10.5%
10.7%
10.1% (8)
Intangible Assets:
Goodwill, net of related deferred tax liabilities (6)
Identifiable intangible assets other than mortgage servicing rights (MSRs),
net of related deferred tax liabilities
Defined benefit pension plan net assets
Deferred tax assets (DTAs) arising from net operating loss, foreign tax credit
and general business credit carry-forwards, and excess over 10% / 15%
limitations for other DTAs, certain common stock investments and MSRs (7)
Basel III Common Equity Tier 1 Capital (CET1)
Basel III Risk-Weighted Assets (RWA)
Basel III Common Equity Tier 1 Capital Ratio (CET1 / RWA)
(1) Citi's Basel III Common Equity Tier 1 Capital Ratio and related components are based on the final U.S. Basel III rules, with full implementation assumed
for capital components. Basel III risk-weighted assets are based on the Advanced Approaches for determining total risk-weighted assets.
(2) Preliminary.
(3) Excludes issuance costs related to preferred stock outstanding in accordance with Federal Reserve Board regulatory reporting requirements.
(4) Citi's Basel III Common Equity Tier 1 Capital is adjusted for accumulated net unrealized gains (losses) on cash flow hedges included in accumulated
other comprehensive income that relate to the hedging of items not recognized at fair value on the balance sheet.
(5) The cumulative impact of changes in Citigroup’s own creditworthiness in valuing liabilities for which the fair value option has been elected and owncredit valuation adjustments on derivatives are excluded from Common Equity Tier 1 Capital, in accordance with the final U.S. Basel III rules.
(6) Includes goodwill "embedded" in the valuation of significant common stock investments in unconsolidated financial institutions.
(7) Aside from MSRs, reflects other DTAs arising from temporary differences and significant common stock investments in unconsolidated financial
institutions.
(8) Citigroup's estimated Basel III Common Equity Tier 1 Capital ratio at December 31, 2013 reflects an adjustment to include, on a pro forma basis,
approximately $56 billion of additional operational risk-weighted assets related to its approved exit from Basel III parallel reporting, effective with 2Q'14.
Appendix E: Non-GAAP Financial Measures - Tangible Book Value Per Share
(in millions, except per share amounts)
Total Citigroup Stockholders' Equity
Less: Preferred Stock
Common Equity
Preliminary
12/31/2014
$210,534
10,468
$200,066
Less:
Goodwill
Intangible Assets (other than MSRs)
Goodwill related to Assets Held-for-Sale
Tangible Common Equity (TCE)
Common Shares Outstanding at Quarter-end (CSO)
Tangible Book Value Per Share (TCE / CSO)
23,592
4,566
71
$171,837
3,024
$56.83
15
1
Preliminary. Citigroup’s Basel III Common Equity Tier 1 Capital ratio is a non-GAAP financial measure. Citigroup believes
this ratio and its related components provide useful information to investors and others by measuring Citigroup’s progress
against future regulatory capital standards. Citigroup’s Basel III Common Equity Tier 1 Capital ratio and its related components
are subject to, among other things, ongoing regulatory supervision, including review and approval of Citi’s credit, market and
operational risk models, additional refinements, modifications or enhancements (whether required or otherwise) to these
models and any further implementation guidance in the U.S. For the composition of Citigroup’s Basel III Common Equity Tier 1
Capital and ratio, see Appendix D.
2
Preliminary. Citigroup's estimated Basel III Supplementary Leverage ratio (SLR) and certain related components are nonGAAP financial measures. Citigroup believes this ratio and its components provide useful information to investors and others
by measuring Citigroup's progress against future regulatory capital standards. Citigroup's estimated Basel III SLR is based on
the revised final U.S. Basel III rules issued in September 2014 and represents the ratio of Tier 1 Capital to Total Leverage
Exposure (TLE). TLE is the sum of the daily average of on-balance sheet assets for the quarter and the average of certain offbalance sheet exposures calculated as of the last day of each month in the quarter, less applicable Tier 1 Capital deductions.
Citigroup's estimated Basel III SLR and related components are subject to, among other things, ongoing regulatory
supervision and any further implementation guidance in the U.S.
3
Tangible book value per share is a non-GAAP financial measure. Citigroup believes this capital metric provides useful
information, as it is used by investors and industry analysts. For a reconciliation of this measure to reported results, see
Appendix E.
4
Credit valuation adjustments (CVA) on derivatives (counterparty and own-credit), net of hedges; funding valuation
adjustments (FVA) on derivatives; and debt valuation adjustments (DVA) on Citigroup’s fair value option liabilities (collectively
referred to as CVA/DVA). See Appendix A. Citigroup’s results of operations excluding the impact of CVA/DVA are non-GAAP
financial measures. Citigroup believes the presentation of its results of operations excluding the impact of CVA/DVA provides
a more meaningful depiction of the underlying fundamentals of its businesses impacted by CVA/DVA. For a reconciliation of
these measures to reported results, see Appendix B.
5
In the second quarter 2013, Citi entered into an agreement to sell Credicard, its non-Citibank branded cards and consumer
finance business in Brazil, which was completed in the fourth quarter 2013. For additional information on the net fraud loss in
Mexico in the fourth quarter 2013, please see Citigroup’s Form 8-K filed with the U.S. Securities and Exchange Commission
(SEC) on February 28, 2014. Presentations of Citigroup’s results of operations excluding these items are non-GAAP financial
measures. Citigroup believes the presentation of its results of operations excluding these items provides a more meaningful
depiction of the underlying fundamentals of its businesses. For a reconciliation of these measures to reported results, see
Appendix B.
6
For additional information on the mortgage settlement to resolve claims related to legacy residential mortgage-backed
securities (RMBS) and collateralized debt obligations (CDOs) included in second quarter 2014 results, please see Citigroup’s
Form 8-K filed with the SEC on July 14, 2014.
7
Citigroup’s results of operations excluding the mortgage settlement and tax items are non-GAAP financial measures.
Citigroup believes the presentation of its results of operations excluding these items provides a more meaningful depiction of
the underlying fundamentals of its businesses. For a reconciliation of these measures to reported results, see Appendix B.
8
Results of operations excluding the impact of FX translation (constant dollar basis) are non-GAAP financial measures.
Citigroup believes the presentation of its results of operations excluding the impact of FX translation is a more meaningful
depiction of the underlying fundamentals of its businesses impacted by FX translation. For a reconciliation of these measures
to reported results, see Appendix C.
9
See footnote 8 of Appendix D.
10
Hedges on accrual loans reflect the mark-to-market on credit derivatives used to hedge the corporate loan portfolio. The
fixed premium cost of these hedges is included (netted against) the core lending revenues to reflect the cost of the credit
protection. Results of operations excluding the impact of gain/(loss) on loan hedges are non-GAAP financial measures.
Citigroup believes the presentation of its results of operations excluding the impact of gain/(loss) on loan hedges is a more
meaningful depiction of the underlying fundamentals of its businesses.
16
CITIGROUP CONSOLIDATED STATEMENT OF INCOME
(In millions of dollars)
4Q
2013
Revenues
Interest revenue
Interest expense
Net interest revenue
Commissions and fees
Principal transactions
Administrative and other
fiduciary fees
Realized gains (losses) on
investments
Other-than-temporary
impairment losses on
investments and other assets
Insurance premiums
Other revenue
Total non-interest revenues
Total revenues, net of
interest expense
1Q
2014
2Q
2014
3Q
2014
4Q
2014
$15,707 $15,350 $15,561 $15,512 $15,260
3,737 3,591 3,615 3,325 3,159
11,970 11,759 11,946 12,187 12,101
4Q14 Increase
(Decrease) from
3Q14
4Q13
(2)%
(15)%
3%
(1)% 12,941 13,032
(57)% 7,302 6,698
1%
(8)%
3,441
1,843
3,280
1,549
3,127
418
(5)%
(73)%
970
1,009
1,029
1,029
946
(8)%
128
84
136
222
63%
(201)
545
812
8,365
(37)
538
498
7,396
(91)
530
984
7,417
FY 2014 vs.
FY 2013 Increase/
(Decrease)
(3)% $62,970 $61,683
(15)% 16,177 13,690
1% 46,793 47,993
3,184
2,888
(73)
552
259
5,809
Full
Year
2014
(2)%
(5)%
(1)%
3,152
965
(16)
Full
Year
2013
(2)%
NM
4,089
4,013
(2)%
748
570
(24)%
(95) (4)% (30)%
(535) (424)
497
(6)% (10)% 2,280 2,110
596 (39)% NM
2,801 2,890
5,711 (23)%
(2)% 29,626 28,889
17,779 20,124 19,342 19,604 17,812
(9)%
—
76,419 76,882
21%
(7)%
3%
(2)%
1%
Provisions for Credit Losses
and for Benefits and Claims
Net credit losses
Credit reserve build / (release)
Provision for loan losses
Policyholder benefits and
claims
Provision for unfunded lending
commitments
Total provisions for credit
losses and for benefits and
claims
Operating Expenses
Compensation and benefits
Premises and Equipment
Technology / communication
expense
Advertising and marketing
expense
Other operating
Total operating expenses
Income from Continuing
Operations before Income
Taxes
Provision (benefits) for income
taxes
Income from Continuing
Operations
Discontinued Operations (1)
Income (Loss) from
Discontinued Operations
Gain (Loss) on Sale
Provision (benefits) for income
taxes
Income (Loss) from
Discontinued Operations, net
of taxes
2,547
(636)
1,911
2,439
(646)
1,793
2,189
(610)
1,579
2,097
(522)
1,575
2,248
(367)
1,881
195
208
182
205
206
(34)
(27)
(31)
(30)
(74) NM
7%
30%
19%
—
(12)% 10,463 8,973
42% (2,859) (2,145)
(2)% 7,604 6,828
6%
NM
830
801
80
(162)
(3)%
NM
2,072
1,974
1,730
1,750
2,013
15%
(3)%
5,729
796
6,010
805
6,028
819
6,114
804
5,807
750
(5)%
(7)%
1% 23,967 23,959
(6)% 3,165 3,178
1,552
1,530
1,619
1,630
1,657
2%
501
458
460
442
484
3,714 3,346 6,595 3,965 5,728
12,292 12,149 15,521 12,955 14,426
10%
44%
11%
(3)% 1,888 1,844
54% 13,252 19,634
17% 48,408 55,051
(2)%
48%
14%
(60)% 19,497 14,364
(26)%
7%
8,514
6,136
7,467
(14)%
25%
(10)%
6,436
(12)%
—
—
5%
3,415
6,001
2,091
4,899
1,373
(72)%
1,090
2,050
1,838
1,985
991
(50)%
5,867
6,864
17%
2,325
3,951
253
2,914
382
(87)% (84)% 13,630
7,500
(45)%
(9)%
(223)
206
40
—
(3)
—
(25)
—
(2)
—
92%
99%
—
(100)%
(242)
268
10
—
NM
(100)%
(198)
3
19
(9)
(1)
89%
(244)
12
NM
181
37
(22)
(16)
(1)
94%
270
(2)
NM
99%
NM
Net Income before
Noncontrolling Interests
Net Income attributable to
noncontrolling interests
Citigroup’s Net Income
(1)
2,506
3,988
45
50
$ 2,456 $ 3,943 $
231
2,898
50
59
181 $ 2,839 $
381
(87)% (85)% 13,900
7,498
(46)%
31
350
185
227
(47)% (38)%
(88)% (86)%$13,673 $ 7,313
(19)%
(47)%
Discontinued operations primarily reflect the following:
a)
In the fourth quarter of 2013, Citi completed the sale of Credicard resulting in a $189 million after-tax benefit to
discontinued operations.
b)
In the first quarter of 2014, residual amounts related to the sale of Credicard and the Egg credit card business (Egg).
c)
In the second quarter of 2014, residual amounts related to the sale of Credicard, German consumer business and Egg.
d)
In the third quarter of 2014, residual amounts related to the sale of the German consumer business and Egg.
e)
In the fourth quarter of 2014, residual amounts related to previous discontinued operations.
NM Not meaningful
Reclassified to conform to the current period’s presentation.
2
CITIGROUP CONSOLIDATED BALANCE SHEET
(In millions of dollars)
December 31,
2013
March 31,
2014
June 30,
2014
4Q14 Increase
September 30, December 31, (Decrease) from
2014
2014 (1)
3Q14
4Q13
Assets
Cash and due from banks (including segregated
35,976 $ 32,108
cash and other deposits)
$ 29,885 $ 33,380 $ 35,268 $
Deposits with banks
169,005
171,020
153,817
143,068
128,089
Fed funds sold and securities borr’d or purch
263,398
250,353
245,462
242,570
under agree. to resell
257,037
Brokerage receivables
25,674
32,484
41,864
39,298
28,419
Trading account assets
285,928
278,180
290,776
290,822
296,786
Investments
Available-for-sale and non-marketable equity
303,293
309,009
309,522
securities
298,381
302,300
Held-to-maturity
10,599
10,600
22,330
24,038
23,921
Total Investments
308,980
312,900
325,623
333,047
333,443
Loans, net of unearned income
393,831
384,661
384,345
376,318
369,970
Consumer
Corporate
271,641
279,560
283,159
277,508
274,665
Loans, net of unearned income
665,472
664,221
667,504
653,826
644,635
Allowance for loan losses
(19,648) (18,923) (17,890)
(16,915)
(15,994)
Total loans, net
645,824
645,298
649,614
636,911
628,641
25,008
25,087
24,500
23,592
Goodwill
25,009
Intangible assets (other than MSRs)
5,056
4,891
4,702
4,525
4,566
Mortgage servicing rights (MSRs)
2,718
2,586
2,282
2,093
1,845
125,591
130,329
127,147
122,471
Other assets (2)
125,266
Assets related to discontinued operations held for
—
—
—
—
—
sale
Total assets
$ 1,880,382 $1,894,736 $1,909,715 $ 1,882,849 $ 1,842,530
Liabilities
Non-interest-bearing deposits in U.S. offices $ 128,399 $ 135,632 $ 130,653 $
Interest-bearing deposits in U.S. offices
284,164
280,549
289,035
Total U.S. Deposits
412,563
416,181
419,688
Non-interest-bearing deposits in offices
outside the U.S.
69,406
69,263
73,991
Interest-bearing deposits in offices outside the
480,819
472,046
486,304
U.S.
Total International Deposits
555,710
550,082
546,037
Total deposits (2)
Fed funds purch and securities loaned or sold
under agree. to repurch.
Brokerage payables
Trading account liabilities
Short-term borrowings
Long-term debt
Other liabilities (2) (3)
Liabilities related to discontinued operations held
for sale
Total liabilities
Equity
Stockholders’ equity
Preferred stock
Common stock
Additional paid-in capital
Retained earnings
Treasury stock
Accumulated other comprehensive income (loss)
Total common equity
Total Citigroup stockholders’ equity
Noncontrolling interests
Total equity
128,243 $ 128,958
285,604
284,978
413,847
413,936
(11)%
(10)%
7%
(24)%
(1)%
(28)%
2%
(6)%
11%
4%
—
—
—
4%
NM
8%
(2)%
(1)%
(1)%
5%
(1)%
(4)%
1%
(12)%
(4)%
(6)%
1%
(3)%
19%
(3)%
(6)%
(10)%
(32)%
(2)%
—
(2)%
—
(2)%
1%
—
—
—
—
—
71,228
70,925
—
2%
457,580
528,808
414,471
485,396
(9)%
(8)%
(15)%
(13)%
968,273
966,263
965,725
942,655
899,332
(5)%
(7)%
203,512
53,707
108,762
58,944
221,116
59,935
190,676
59,407
124,040
58,903
222,747
62,458
183,912
62,323
123,370
59,534
226,984
74,768
175,732
59,428
137,272
64,838
223,842
65,191
173,438
52,180
139,036
58,335
223,080
85,084
(1)%
(12)%
1%
(10)%
—
31%
(15)%
(3)%
28%
(1)%
1%
42%
—
—
—
—
—
$ 1,674,249 $1,684,494 $1,696,616 $ 1,668,958 $ 1,630,485
—
(2)%
—
(3)%
8,968 $ 10,468
31
31
107,839
107,979
118,041
118,201
(2,631)
(2,929)
(19,976)
(23,216)
203,304 $ 200,066
17%
—
—
—
(11)%
(16)%
(2)%
55%
—
1%
6%
(77)%
(21)%
1%
212,272 $ 210,534
1,619
1,511
213,891
212,045
(1)%
(7)%
(1)%
3%
(16)%
3%
$
6,738 $
31
107,193
111,168
(1,658)
(19,133)
$ 197,601 $
7,218 $
31
107,505
115,091
(2,237)
(19,146)
201,244 $
8,968 $
31
107,669
115,361
(2,520)
(18,147)
202,394 $
$ 204,339 $ 208,462 $ 211,362 $
1,794
1,780
1,737
206,133
210,242
213,099
Total liabilities and equity
$ 1,880,382 $1,894,736 $1,909,715 $ 1,882,849 $ 1,842,530
(2)%
(2)%
(1)
Preliminary
(2)
See footnote 4 on page 1.
(3)
Includes allowance for credit losses for letters of credit and unfunded lending commitments. See page 34 for amounts by
period.
NM Not meaningful
Reclassified to conform to the current period’s presentation.
3
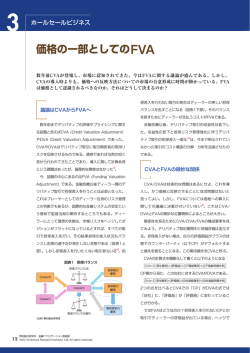
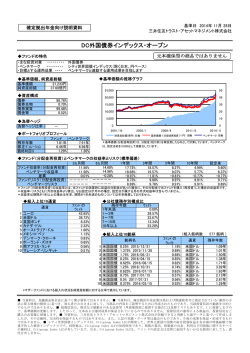
© Copyright 2026