
2015年3月期 第3四半期決算付属資料
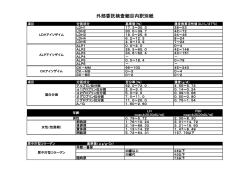
2015年3月期 第3四半期決算付属資料
Additional Information on the Financial Results
for the Third Quarter Ending March 31, 2015
2015年2月5日
February 5, 2015
.
株式会社SRAホールディングス
SRA Holdings, Inc.
http://www.sra-hd.co.jp/
Page
目次
INDEX
P. 1
1. 要約損益計算書 (連結/㈱SRA単体)
Condensed Statements of Income (Consolidated/SRA, Inc. Non-consolidated)
P. 2
2. セグメント情報 (連結/㈱SRA単体)
Segment Information (Consolidated/SRA, Inc. Non-consolidated)
P. 3
3. 業種別売上高 (連結/㈱SRA単体)
Sales by Industrial Classification (Consolidated/SRA, Inc. Non-consolidated)
P. 4
4. 主な顧客と受注内容 (㈱SRA単体)
Main Clients and Order Details (SRA, Inc. Non-consolidated)
P. 5-6
5. 要約貸借対照表 (連結)
Summary of Consolidated Financial Statements
P. 7
要約貸借対照表 (㈱SRA単体)
Summary of Financial Statements of SRA, Inc.
P. 8
6. 要約キャッシュフロー計算書 (連結)
Summary of Consolidated Statements of Cash Flows
P. 9
7. 受注単価・外注単価の推移 (㈱SRA単体)
Order Unit Price, Subcontract Unit Price (SRA, Inc. Non-cosolidated)
P. 9
8. 販管比率・営業利益率の推移 (連結/㈱SRA単体)
Ratio of SG&A Expenses to Net Sales, Ratio of Operating Income to Net Sales
(Consolidated/SRA, Inc. Non-consolidated)
1.要約損益計算書 Condensed Statements of Income (Consolidated/SRA, Inc. Non-consolidated)
≪連結 Consolidated≫
(百万円/In millions of yen)
2011/3 第3四半期 3rd Quarter
金額
前期比(%) 百分率(%)
Amount
YoY (%)
Ratio
2012/3 第3四半期 3rd Quarter
金額
前期比(%) 百分率(%)
Amount
YoY (%)
Ratio
2013/3 第3四半期 3rd Quarter
金額
前期比(%) 百分率(%)
Amount
YoY (%)
Ratio
2014/3 第3四半期 3rd Quarter
金額
前期比(%) 百分率(%)
Amount
YoY (%)
Ratio
2015/3 第3四半期 3rd Quarter
金額
前期比(額) 前期比(%) 百分率(%)
YoY
(Amount)
25,867
1,101
Amount
売上高
Net sales
23,635
△2.9
100.0
23,631
△0.0
100.0
22,663
△4.1
100.0
24,765
9.3
100.0
売上原価
Cost of sales
19,706
△3.6
83.4
19,684
△0.1
83.3
18,758
△4.7
82.8
20,440
9.0
82.5
21,293
売上総利益
Gross profit on sales
3,928
0.8
16.6
3,947
0.5
16.7
3,904
△1.1
17.2
4,325
10.8
17.5
販売費及び一般管理費
Selling, general and administrative expenses
2,843
1.4
12.0
2,712
△4.6
11.5
2,720
0.3
12.0
2,782
2.3
11.2
営業利益
Operating income
1,085
△0.8
4.6
1,234
13.7
5.2
1,183
△4.1
5.2
1,543
30.4
営業外収益
Non-operating income
149
76.7
0.6
167
11.7
0.7
327
96.0
1.4
513
営業外費用
Non-operating expences
60
29.4
0.3
60
△0.3
0.3
51
△15.6
0.2
経常利益
Ordinary profit
1,174
3.7
5.0
1,341
14.2
5.7
1,460
8.9
6.4
特別利益
Extraordinary income
-
-
-
172
-
0.7
16
△90.7
0.1
14
△7.6
0.1
特別損失
Extraordinary loss
198
375.7
0.8
58
△70.3
0.2
0
△98.6
0.0
7
786.7
0.0
税金等調整前四半期純利益
Income before income taxes
976
△10.5
4.1
1,454
49.0
6.2
1,475
1.4
6.5
2,022
37.1
8.2
法人税、住民税及び事業税
Income taxes
397
△24.5
1.7
508
28.0
2.2
582
14.5
2.6
835
43.4
3.4
法人税調整額
Deferred income taxes
12
△249.0
0.1
279
2,079.3
1.2
88
△68.3
0.4
48
△45.1
0.2
四半期純損益
Net income
566
△1.1
2.4
666
17.6
2.8
804
20.7
3.5
1,139
41.6
1株当たり四半期純損益
Net income per share
40.94
-
-
-
-
-
-
-
48.81
61.23
100.0
852
4.2
82.3
4,574
248
5.7
17.7
2,804
21
0.8
10.8
6.2
1,770
226
14.7
6.8
56.5
2.1
692
179
35.0
2.7
41
△19.5
0.2
40
△0
△1.2
0.2
2,015
38.0
8.1
2,422
406
20.2
9.4
41
26
179.3
0.2
871
863
-
3.4
1,592
△ 430
△21.3
6.2
792
△ 43
△5.2
3.1
△ 145
△ 194
△398.5
△ 0.6
4.6
945
△ 193
△17.0
3.7
-
78.74
-
-
-
87.86
(百万円/In millions of yen)
2011/3 第3四半期 3rd Quarter
金額
前期比(%) 百分率(%)
Amount
YoY (%)
売上高
Net sales
12,029
売上原価
Cost of sales
売上総利益
Gross profit
販売費及び一般管理費
Selling, general and administrative expenses
営業利益
営業外収益
Ratio
2012/3 第3四半期 3rd Quarter
金額
前期比(%) 百分率(%)
Amount
YoY (%)
Ratio
2013/3 第3四半期 3rd Quarter
金額
前期比(%) 百分率(%)
Amount
YoY (%)
Ratio
2014/3 第3四半期 3rd Quarter
金額
前期比(%) 百分率(%)
Amount
YoY (%)
Ratio
前期比(額) 前期比(%) 百分率(%)
金額
YoY
(Amount)
12,076
632
Amount
100.0
11,157
△ 7.2
100.0
11,440
2.5
100.0
11,444
0.0
10,048
0.0
83.5
9,149
△ 9.0
82.0
9,417
2.9
82.3
9,325
△ 1.0
81.5
9,676
1,980
△ 16.1
16.5
2,008
1.4
18.0
2,022
0.7
17.7
2,118
4.7
18.5
2,399
1,781
8.1
14.8
1,650
△ 7.3
14.8
1,672
1.3
14.6
1,683
0.6
14.7
Operating income
199
△ 72.0
1.7
358
79.5
3.2
349
△ 2.4
3.1
434
24.3
Non-operating income
323
16.3
2.7
764
135.9
6.8
410
△ 46.3
3.6
748
82.3
48
107.7
0.4
37
△ 23.8
0.3
26
△ 29.7
0.2
12
△ 51.6
0.1
474
△ 51.0
3.9
1,085
128.6
9.7
734
△ 32.4
6.4
1,170
59.4
10.2
Non-operating expences
Ordinary profit
100.0
2015/3 第3四半期 3rd Quarter
△ 3.1
営業外費用
Ratio
4.4
≪㈱SRA単体 SRA, Inc. Non-Consolidated≫
経常利益
YoY (%)
YoY (%)
Ratio
5.5
100.0
351
3.8
80.1
281
13.3
19.9
1,542
△ 140
△ 8.3
12.8
3.8
857
422
97.1
7.1
6.5
1,041
292
39.1
8.6
15
3
24.0
0.1
1,882
711
60.8
15.6
0.0
特別利益
Extraordinary income
2
-
0.0
142
6,102.1
1.3
15
△ 89.1
0.1
11
△ 27.7
0.1
2
△9
△ 82.1
特別損失
Extraordinary loss
182
372.9
1.5
14
△ 91.8
0.1
0
△ 97.2
0.0
1
365.3
0.0
374
372
-
3.1
税引前四半期純利益
Income before income taxes
294
△ 68.3
2.4
1,213
311.9
10.9
749
△ 38.2
6.6
1,179
57.4
10.3
1,510
330
28.0
12.5
法人税、住民税及び事業税
Income taxes
80
△ 75.5
0.7
200
148.7
1.8
268
34.5
2.4
443
64.9
3.9
418
△ 24
△ 5.6
3.5
法人税調整額
Deferred income taxes
△ 39
128.4
△ 0.3
202
-
1.8
60
△ 70.3
0.5
△ 42
-
△ 0.4
8
51
-
0.1
四半期純損益
Net income
253
△ 59.0
2.1
811
219.5
7.3
420
△ 48.2
3.7
779
85.4
6.8
1,082
302
38.9
9.0
1
2.セグメント情報 Segment Information (Consolidated/SRA, Inc. Non-consolidated)
≪連結 Consolidated≫
(百万円/In millions of yen)
2011/3 第3四半期 3rd Quarter
金額
Amount
受注高
前期比(%) 百分率(%)
YoY (%)
2012/3 第3四半期 3rd Quarter
金額
Amount
Ratio
前期比(%) 百分率(%)
YoY (%)
2013/3 第3四半期 3rd Quarter
金額
Amount
Ratio
前期比(%) 百分率(%)
YoY (%)
2014/3 第3四半期 3rd Quarter
金額
Amount
Ratio
前期比(%) 百分率(%)
YoY (%)
2015/3 第3四半期 3rd Quarter
金額
Amount
Ratio
前期比(%) 百分率(%)
YoY (%)
Ratio
New Orders Received
23,829
△ 4.9
100.0
24,731
3.8
100.0
22,733
△ 8.1
100.0
26,641
17.2
100.0
26,757
0.4
100.0
開発
Systems Development
13,063
△ 7.9
54.8
12,764
△ 2.3
51.6
12,357
△ 3.2
54.4
13,777
11.5
51.7
14,251
3.4
53.2
運用・構築
System Operations and Infrastructure Development
2,126
△ 6.6
8.9
1,882
△ 11.5
7.6
1,931
2.6
8.5
2,045
5.9
7.7
2,186
6.9
8.2
販売
Product Sales
8,639
0.6
36.3
10,084
16.7
40.8
8,444
△ 16.3
37.1
10,818
28.1
40.6
10,318
△ 4.6
38.6
New Orders Received Backlog
8,504
△ 0.7
100.0
9,047
6.4
100.0
8,886
△ 1.8
100.0
10,332
16.3
100.0
9,649
△ 6.6
100.0
開発
Systems Development
4,396
△ 19.0
51.7
4,575
4.1
50.6
4,468
△ 2.3
50.3
4,751
6.3
46.0
5,181
9.1
53.7
運用・構築
System Operations and Infrastructure Development
881
△ 8.8
10.4
773
△ 12.2
8.5
848
9.6
9.5
881
3.9
8.5
955
8.4
9.9
販売
Product Sales
3,226
48.8
37.9
3,697
14.6
40.9
3,569
△ 3.5
40.2
4,700
31.7
45.5
3,513
△ 25.3
36.4
Net Sales
23,635
△ 2.9
100.0
23,631
△ 0.0
100.0
22,663
△ 4.1
100.0
24,765
9.3
100.0
25,867
4.4
100.0
開発
Systems Development
12,785
4.8
54.1
11,706
△ 8.4
49.6
11,752
0.4
51.9
12,814
9.0
51.7
13,479
5.2
52.1
運用・構築
System Operations and Infrastructure Development
2,798
△ 9.7
11.8
2,535
△ 9.4
10.7
2,485
△ 2.0
11.0
2,627
5.7
10.6
2,854
8.6
11.0
販売
Product Sales
8,051
△ 11.0
34.1
9,389
16.6
39.7
8,425
△ 10.3
37.2
9,324
10.7
37.6
9,533
2.2
36.9
受注残高
売上高
(百万円/In millions of yen)
2011/3 第3四半期 3rd Quarter
金額
Amount
営業利益
前期比(%) 利益率(%)
YoY (%)
Ratio to
Net Sales
2012/3 第3四半期 3rd Quarter
金額
Amount
前期比(%) 利益率(%)
YoY (%)
Ratio to
Net Sales
2013/3 第3四半期 3rd Quarter
金額
Amount
前期比(%) 利益率(%)
YoY (%)
Ratio to
Net Sales
2014/3 第3四半期 3rd Quarter
金額
Amount
前期比(%) 利益率(%)
YoY (%)
Ratio to
Net Sales
2015/3 第3四半期 3rd Quarter
金額
Amount
前期比(%) 利益率(%)
YoY (%)
Ratio to
Net Sales
Operating Income
1,085
△ 0.8
4.6
1,234
13.7
5.2
1,183
△ 4.1
5.2
1,543
30.4
6.2
1,770
14.7
6.8
開発
Systems Development
1,375
12.7
10.8
1,422
3.4
12.1
1,294
△ 9.0
11.0
1,342
3.8
10.5
1,308
△ 2.6
9.7
運用・構築
System Operations and Infrastructure Development
548
△ 21.7
19.6
410
△ 25.2
16.2
462
12.7
18.6
537
16.4
20.5
630
17.2
22.1
販売
Product Sales
565
18.0
7.0
387
△ 31.5
4.1
367
△ 5.2
4.4
602
64.0
6.5
745
23.7
7.8
消去
Eliminations/Corporate
1,403
7.5
-
985
△ 29.8
-
940
△ 4.5
-
939
△ 0.0
-
913
△ 2.8
-
≪㈱SRA単体 SRA, Inc. Non-Consolidated≫
(百万円/In millions of yen)
2011/3 第3四半期 3rd Quarter
金額
Amount
売上高
前期比(%) 百分率(%)
YoY (%)
Ratio
2012/3 第3四半期 3rd Quarter
金額
Amount
前期比(%) 百分率(%)
YoY (%)
Ratio
2013/3 第3四半期 3rd Quarter
金額
Amount
前期比(%) 百分率(%)
YoY (%)
Ratio
2014/3 第3四半期 3rd Quarter
金額
Amount
前期比(%) 百分率(%)
YoY (%)
Ratio
2015/3 第3四半期 3rd Quarter
金額
Amount
前期比(%) 百分率(%)
YoY (%)
Ratio
12,029
△ 3.1
100.0
11,157
△ 7.2
100.0
11,440
2.5
100.0
11,444
0.0
100.0
12,076
5.5
100.0
開発
Systems Development
7,621
△ 1.8
63.4
7,086
△ 7.0
63.5
7,470
5.4
65.3
7,429
△ 0.5
64.9
7,617
2.5
63.1
運用・構築
System Operations and Infrastructure Development
2,957
△ 8.4
24.6
2,735
△ 7.5
24.5
2,725
△ 0.4
23.8
2,828
3.8
24.7
3,043
7.6
25.2
販売
Product Sales
1,450
2.0
12.1
1,335
△ 7.9
12.0
1,245
△ 6.8
10.9
1,185
△ 4.8
10.4
1,415
19.4
11.7
Net Sales
2
3.業種別売上高 Sales by Industrial Classification(Consolidated/SRA, Inc. Non-consolidated)
≪連結 Consolidated≫
(百万円/In millions of yen)
開発 Systems Development
2014/3 第3四半期 3Q
製造業
Manufacturing
通信
2015/3 第3四半期 3Q
運用・構築 System Operations and Infrastructure Development
2014/3 第3四半期 3Q
対前年 YoY
2015/3 第3四半期 3Q
対前年 YoY
金額
百分率(%)
金額
百分率(%)
対前年額
前年比(%)
金額
百分率(%)
金額
百分率(%)
対前年額
前年比(%)
Amount
Ratio
Amount
Ratio
Amount
Rate(%)
Amount
Ratio
Amount
Ratio
Amount
Rate(%)
4,076
32
4,269
31.7
193
4.8
111
4
132
4.6
21
19.7
Telecom
462
7
392
2.9
△ 70
△ 15.2
341
13
444
15.6
103
30.5
電力・ガス
EP/gas industry
401
3
423
3.1
22
5.5
-
-
1
0.1
1
-
銀行・証券
Bank/securities
3,183
25
4,418
32.8
1,235
38.8
492
19
730
25.6
238
48.4
生損保
Insurance
668
5
315
2.3
△ 352
△ 52.8
161
6
159
5.6
△1
△ 0.6
流通
Distribution
555
4
427
3.2
△ 127
△ 22.9
20
1
-
-
△ 20
△ 100.0
大学等
Academic, etc.
445
3
727
5.4
282
63.4
617
23
620
21.7
3
0.6
ハードメーカー(SIer)
SIer
633
5
242
1.8
△ 390
△ 61.7
234
9
331
11.6
97
41.5
情報サービス
Information services
928
7
375
2.8
△ 552
△ 59.6
326
12
290
10.2
△ 35
△ 10.9
サービス他
Services and others
1,463
8
1,888
14.0
424
29.0
327
12
142
5.0
△ 184
△ 56.5
合計
Total
12,814
100
13,479
100.0
665
5.2
2,627
100
2,854
100.0
226
8.6
業種別の区分について、一部見直しを行いました
(百万円/In millions of yen)
≪㈱SRA単体 SRA, Inc. Non-Consolidated≫
開発 Systems Development
2014/3 第3四半期 3Q
金額
百分率(%)
Amount
2,328
Ratio
2015/3 第3四半期 3Q
金額
百分率(%)
31
Amount
2,496
Ratio
32.8
運用・構築 System Operations and Infrastructure Development
対前年 YoY
対前年額
2015/3 第3四半期 3Q
2014/3 第3四半期 3Q
前年比(%)
金額
百分率(%)
Amount
168
Rate(%)
7.2
Amount
111
Ratio
金額
対前年 YoY
百分率(%)
対前年額
前年比(%)
4
Amount
132
Ratio
4.4
Amount
21
Rate(%)
19.7
製造業
Manufacturing
通信
Telecom
432
6
370
4.9
△ 61
△ 14.2
341
12
444
14.6
103
30.4
電力・ガス
EP/gas industry
339
5
188
2.5
△ 150
△ 44.4
-
-
1
0.1
1
-
銀行・証券
Bank/securities
2,275
31
2,671
35.1
396
17.4
611
22
641
21.1
30
4.9
生損保
Insurance
485
7
252
3.3
△ 232
△ 47.9
158
6
159
5.2
1
1.2
流通
Distribution
186
3
41
0.5
△ 144
△ 77.6
20
1
-
-
△ 20
△ 100.0
大学等
Academic, etc.
347
5
428
5.6
81
23.4
617
22
620
20.4
3
0.6
ハードメーカー(SIer)
SIer
26
0
37
0.5
11
43.4
306
11
573
18.8
267
87.3
情報サービス
Information services
333
4
109
1.4
△ 223
△ 67.1
338
12
315
10.3
△ 22
△ 6.8
サービス他
Services and others
678
9
1,021
13.4
343
50.7
327
12
153
5.1
△ 173
△ 52.9
合計
Total
7,429
100
7,617
100.0
187
2.5
2,828
100
3,043
100.0
214
7.6
3
4.主な顧客と受注内容 Main Clients and Order Details(SRA, Inc. Non-consolidated)
≪㈱SRA単体 SRA, Inc. Non-Consolidated≫
社名
Client
受注内容
Order details
三菱UFJフィナンシャルグループ
Mitsubishi UFJ Financial Group
基幹・業務系システム、情報系システムの構築・保守
Development and maintenance of mission-critical systems, business application systems and information systems
野村総合研究所
Nomura Research Institute
証券会社向け資産運用系システム、オンライントレードシステムの構築
Development of asset management systems and online trading systems for securities companies
第一生命グループ
Dai-ichi Life Group
基幹・業務系システムの構築・保守、汎用機およびオープン系システム、ネットワークの運用管理
Development and maintenance of mission-critical systems and business application systems. Operational management of mainframe host systems, open systems and networks
農林中金グループ
The Norinchukin Bank Group
汎用機およびオープン系システムの運用管理
Operational management of mainframe host systems and open systems
パナソニックグループ
Panasonic Group
製品開発系システムの構築
Development of product development systems
ソニーグループ
Sony Group
組込製品開発(AV、ホームエレクトロニクス)
Software development for embedded products (AV, home electronics,etc.)
東京電力グループ
TEPCO Group
基幹・業務系システムの構築
Development and operational management of mission-critical systems and business application systems
NTTグループ
NTT Group
業務系システムの構築・保守、オープン系システム、ネットワークの運用管理
Development and maintenance of business application systems. Operational management of open systems and networks
キヤノングループ
Canon Group
システム設計、開発、運用、コンサルティング、基幹システムの運用管理
Design, development, operation, and consulting for various systems. Operational management of mission-critical systems
日本IBMグループ
IBM Group
システム構築、開発環境構築、教育トレーニング、汎用機およびオープン系システムの運用管理
System development, building of development environment, educational training. Operational management of mainframe host systems and open systems
日本ユニシスグループ
Nihon Unisys Group
ネットワークの運用管理、ネットワーク構築、汎用機およびオープン系システムの運用管理
Build, configuration and operational management of networks. Operational management of mainframe host systems and open systems
4
5.要約貸借対照表 Summary of Consolidated Financial Statements(Consolidated/SRA, Inc. Non-consolidated)
≪連結 Consolidated≫
(百万円/In millions of yen)
2011/3 第3四半期 3rd Quarter
金額
前期比(%)
Amount
資産の部
ASSETS
流動資産
Current assets
YoY (%)
百分率(%)
Ratio
2012/3 第3四半期 3rd Quarter
金額
前期比(%)
Amount
YoY (%)
百分率(%)
Ratio
2013/3 第3四半期 3rd Quarter
金額
前期比(%)
Amount
YoY (%)
2014/3 第3四半期 3rd Quarter
百分率(%)
Ratio
金額
前期比(%)
Amount
YoY (%)
2015/3 第3四半期 3rd Quarter
百分率(%)
Ratio
前期比(額) 前期比(%)
金額
YoY
(Amount)
Amount
YoY (%)
百分率(%)
Ratio
17,435
△ 9.7
67.0
17,462
0.2
67.4
15,820
△ 9.4
59.7
20,774
31.3
72.9
22,819
2,045
9.8
75.6
現金及び預金
Cash and deposits
7,547
△ 18.6
29.0
6,043
△ 19.9
23.3
5,948
△ 1.6
22.4
7,796
31.1
27.4
8,106
309
4.0
26.8
受取手形及び売掛金
Notes and accounts receivable-trade
4,726
△ 20.7
18.2
4,817
1.9
18.6
5,045
4.7
19.0
4,568
△ 9.5
16.0
5,550
982
21.5
18.4
有価証券
Short-term investment securities
1,504
198.5
5.8
1,778
18.2
6.9
1,104
△ 37.9
4.2
3,113
181.8
10.9
3,393
279
9.0
11.2
2,139
△ 10.7
8.2
2,230
4.3
8.6
2,000
△ 10.3
7.5
2,797
39.8
9.8
2,600
△ 196
△ 7.0
8.6
472
6.3
1.8
444
△ 6.0
1.7
401
△ 9.6
1.5
439
9.5
1.5
699
259
59.1
2.3
たな卸資産
Inventories
繰延税金資産
Deferred tax assets
その他
Other
貸倒引当金
Allowance for doubtful accounts
42.0
4.0
2,162
106.3
8.3
1,345
△ 37.8
5.1
2,090
55.4
7.3
2,504
414
19.8
8.3
△2
△ 44.3
△ 0.0
△ 14
-
△ 0.1
△ 25
74.0
△ 0.1
△ 31
22.3
△ 0.1
△ 35
△4
13.7
△ 0.1
8,582
20.3
33.0
8,459
△ 1.4
32.6
10,689
26.3
40.3
7,723
△ 27.7
27.1
7,380
△ 343
△ 4.4
24.4
Property, plant and equipment
226
23.4
0.9
196
△ 13.5
0.8
188
△ 4.1
0.7
193
3.0
0.7
186
△7
△ 4.0
0.6
建物及び構築物
Buildings and structures
130
51.8
0.5
122
△ 6.8
0.5
98
△ 18.9
0.4
99
0.1
0.3
89
△9
△ 9.7
0.3
機械装置及び運搬具
Machinery,equipment snd vehicles
59
△ 6.8
0.2
41
△ 30.0
0.2
59
41.8
0.2
55
△ 6.7
0.2
61
6
10.9
0.2
土地
Land
0
-
0.0
0
-
0.0
-
△ 100.0
-
-
-
-
-
-
-
-
その他
Other
35
8.4
0.1
31
△ 10.4
0.1
29
△ 5.4
0.1
39
32.0
0.1
35
△4
△ 10.5
0.1
固定資産
Noncurrent assets
有形固定資産
Intangible assets
636
12.5
2.4
1,137
78.8
4.4
965
△ 15.1
3.6
718
△ 25.5
2.5
555
△ 163
△ 22.8
1.8
ソフトウェア
Software
403
9.5
1.6
895
121.7
3.5
826
△ 7.6
3.1
624
△ 24.4
2.2
437
△ 187
△ 30.0
1.4
その他
Other
無形固定資産
232
18.1
0.9
242
4.3
0.9
138
△ 42.9
0.5
93
△ 32.0
0.3
117
24
25.5
0.4
Investments and other assets
7,719
20.9
29.7
7,126
△ 7.7
27.5
9,535
33.8
36.0
6,810
△ 28.6
23.9
6,639
△ 171
△ 2.5
22.0
投資有価証券
Investment securities
4,838
38.9
18.6
4,333
△ 10.4
16.7
6,813
57.2
25.7
3,885
△ 43.0
13.6
3,833
△ 52
△ 1.3
12.7
繰延税金資産
Deferred tax assets
1,540
△ 6.3
5.9
1,334
△ 13.3
5.1
1,274
△ 4.5
4.8
1,196
△ 6.1
4.2
1,164
△ 31
△ 2.7
3.9
その他
Other
1,475
2.8
5.7
1,551
5.1
6.0
1,541
△ 0.6
5.8
1,840
19.4
6.5
1,763
△ 77
△ 4.2
5.8
貸倒引当金
Allowance for doubtful accounts
△ 55
△ 71.5
△ 0.2
△ 14
△ 74.2
△ 0.1
△ 14
△ 0.5
△ 0.1
△ 15
7.9
△ 0.1
△ 14
1
△ 9.1
0.0
投資損失引当金
Allowance for investment loss
△ 79
△ 21.4
△ 0.3
△ 78
△ 1.1
△ 0.3
△ 78
0.9
△ 0.3
△ 96
22.0
△ 0.3
△ 108
△ 11
12.3
△ 0.4
26,018
△ 1.6
100.0
25,922
△ 0.4
100.0
26,509
2.3
100.0
28,498
7.5
100.0
30,199
1,701
6.0
100.0
投資その他資産
資産合計
1,048
Total assets
5
≪連結 Consolidated≫
(百万円/In millions of yen)
2011/3 第3四半期 3rd Quarter
金額
前期比(%) 百分率(%)
Amount
負債の部
LIABILITIES
流動負債
YoY (%)
2012/3 第3四半期 3rd Quarter
金額
前期比(%) 百分率(%)
Amount
Ratio
YoY (%)
2013/3 第3四半期 3rd Quarter
金額
前期比(%) 百分率(%)
Amount
Ratio
YoY (%)
2014/3 第3四半期 3rd Quarter
金額
前期比(%) 百分率(%)
Amount
Ratio
YoY (%)
2015/3 第3四半期 3rd Quarter
金額
前期比(額) 前期比(%) 百分率(%)
YoY
(Amount)
Amount
Ratio
YoY (%)
Ratio
Current liabilities
6,927
△ 5.7
26.6
7,032
1.5
27.1
6,547
△ 6.9
24.7
8,218
25.5
28.8
7,997
△ 221
△ 2.7
26.5
買掛金
Accounts payable-trade
2,118
△ 21.0
8.1
2,437
15.0
9.4
2,326
△ 4.5
8.8
3,497
50.3
12.3
3,324
△ 173
△ 5.0
11.0
短期借入金
Short-term loans payable
1,954
△ 16.5
7.5
1,674
△ 14.3
6.5
1,674
-
6.3
1,544
△ 7.8
5.4
1,179
△ 365
△ 23.6
3.9
一年内償還予定社債
Current portion of bonds
300
-
1.2
-
△ 100.0
-
-
-
-
-
-
-
-
-
-
-
未払費用
Accued expenses
731
△ 0.6
2.8
710
△ 3.0
2.7
681
△ 4.0
2.6
704
3.4
2.5
725
20
2.9
2.4
未払法人税等
Income taxes payable
124
△ 20.5
0.5
108
△ 12.7
0.4
92
△ 14.9
0.3
302
227.1
1.1
272
△ 30
△ 10.1
0.9
未払消費税等
Accrued consumption taxes
234
15.3
0.9
199
△ 14.6
0.8
178
△ 10.6
0.7
176
△ 1.4
0.6
474
298
169.3
1.6
賞与引当金
Provision for bonuses
404
21.1
1.6
458
13.4
1.8
401
△ 12.5
1.5
351
△ 12.3
1.2
381
30
8.5
1.3
役員賞与引当金
Provision for directors' bonuses
70
-
0.3
70
△ 0.3
0.3
71
1.3
0.3
63
△ 11.3
0.2
71
8
14.0
0.2
工事損失引当金
Provision for loss on construction contracts
226
1.9
0.9
268
18.8
1.0
167
△ 37.6
0.6
387
130.8
1.4
553
166
43.1
1.8
その他
Other
763
13.8
2.9
1,104
44.7
4.3
954
△ 13.6
3.6
1,191
24.8
4.2
1,013
△ 177
△ 14.9
3.4
固定負債
4,173
△ 5.6
16.0
4,105
△ 1.6
15.8
4,127
0.5
15.6
3,819
△ 7.5
13.4
4,148
329
8.6
13.7
社債
Bonds payable
-
-
-
-
-
-
-
-
-
-
-
-
-
-
-
-
長期借入金
Long-term loans payable
-
-
-
300
-
1.2
300
-
1.1
-
△ 100.0
-
-
-
-
-
退職給付引当金
Provision for retirement benefits
3,649
△ 0.6
14.0
3,653
0.1
14.1
3,663
0.3
13.8
3,641
△ 0.6
12.8
-
△ 3,641
△ 100.0
-
退職給付に係る負債
Net defined benefit liability
-
-
-
-
-
-
-
-
-
-
-
-
3,997
3,997
-
13.2
役員退職慰労引当金
Provision for directors' retirement benefits
438
△ 0.7
1.7
438
△ 0.7
1.7
158
7.3
0.6
155
△ 2.1
0.5
135
△ 20
△ 13.0
0.4
負ののれん
Negative goodwill
4
△ 57.1
0.0
4
△ 57.1
0.0
-
-
-
-
-
-
-
-
-
-
その他
Others
80
-
0.3
80
-
0.3
5
21.5
0.0
22
321.3
0.1
16
△5
△ 26.7
0.1
11,100
△ 5.7
42.7
11,100
△ 5.7
42.7
10,675
△ 4.2
40.3
12,038
12.8
42.2
12,146
107
0.9
40.2
57.4
Noncurrent liabilities
負債合計
Total liabilities
純資産の部
NET ASSETS
株主資本
Shareholders' equity
14,806
4.8
56.9
14,806
4.8
56.9
16,011
5.6
60.4
15,890
△ 0.8
55.8
17,337
1,447
9.1
資本金
Capital stock
1,000
-
3.8
1,000
-
3.8
1,000
-
3.8
1,000
-
3.5
1,000
-
-
3.3
資本剰余金
Capital surplus
4,483
-
17.2
4,483
-
17.2
4,483
-
16.9
4,483
0.0
15.7
4,468
△ 14
△ 0.3
14.8
利益剰余金
Retained earnings
10,216
7.1
39.3
10,216
7.1
39.3
11,921
7.6
45.0
13,337
11.9
46.8
14,596
1,258
9.4
48.3
自己株式
Treasury stock
△ 894
-
△ 3.4
△ 894
-
△ 3.4
△ 1,393
-
△ 5.3
△ 2,930
-
△ 10.3
△ 2,727
203
△ 6.9
△ 9.0
80
△ 80.8
0.3
80
△ 80.8
0.3
△ 215
-
△ 0.8
526
-
1.8
698
172
32.8
2.3
375
△ 34.1
1.4
375
△ 34.1
1.4
131
246136.1
0.5
402
206.8
1.4
668
265
66.1
2.2
Foreign currency translation adjustments
△ 294
-
△ 1.1
△ 294
-
△ 1.1
△ 346
-
△ 1.3
124
-
0.4
420
296
238.7
1.4
退職給付に係る調整累計額 Remeasurements of defined benefit plans
-
-
-
-
-
-
-
-
-
-
-
-
△ 389
△ 389
-
△ 1.3
31
△ 66.0
0.1
23
△ 23.9
0.1
37
60.4
0.1
43
13.9
0.2
17
△ 25
△ 59.6
0.1
-
-
-
-
-
-
-
-
-
-
-
-
-
-
-
-
その他包括利益累計額
Accumulated other comprehensive income
その他有価証券評価差額金 Valuation difference on available-for-sale securities
為替換算調整勘定
新株予約権
Subscription rights to shares
少数株主持分
Minority interests
純資産合計
Total net assets
14,917
1.7
57.3
14,784
△ 0.9
57.0
15,834
7.1
59.7
16,459
3.9
57.8
18,053
1,594
9.7
59.8
負債・純資産合計
Total liabilities and net assets
26,018
△ 1.6
100.0
25,922
△ 0.4
100.0
26,509
2.3
100.0
28,498
7.5
100.0
30,199
1,701
6.0
100.0
6
≪㈱SRA単体 SRA, Inc. Non-Consolidated≫
(百万円/In millions of yen)
2011/3 第3四半期 3rd Quarter
金額
前期比(%) 百分率(%)
Amount
資産の部
ASSETS
流動資産
Current assets
YoY (%)
Ratio
2012/3 第3四半期 3rd Quarter
金額
前期比(%) 百分率(%)
Amount
YoY (%)
Ratio
2013/3 第3四半期 3rd Quarter
金額
前期比(%) 百分率(%)
Amount
YoY (%)
Ratio
2014/3 第3四半期 3rd Quarter
金額
Amount
前期比(%) 百分率(%)
YoY (%)
Ratio
2015/3 第3四半期 3rd Quarter
金額
Amount
前期比(額) 前期比(%) 百分率(%)
YoY
(Amount)
YoY (%)
Ratio
10,683
△ 17.8
57.8
11,345
6.2
59.7
8,944
△ 21.2
47.1
12,190
36.3
64.7
18,079
5,889
48.3
現金及び預金
Cash and deposits
3,484
△ 47.8
18.8
2,619
△ 24.8
13.8
2,200
△ 16.0
11.6
1,686
△ 23.4
8.9
5,516
3,830
227.2
23.0
受取手形及び売掛金
Notes and accounts receivable-trade
2,146
△ 19.3
11.6
2,310
7.6
12.1
2,146
△ 7.1
11.3
2,321
8.2
12.3
2,597
275
11.9
10.8
たな卸資産
Inventories
1,374
△ 1.2
7.4
1,385
0.8
7.3
1,211
△ 12.6
6.4
1,401
15.7
7.4
1,739
337
24.1
7.2
その他
Other
3,678
61.8
19.9
5,031
36.8
26.5
3,386
△ 32.7
17.8
6,781
100.2
36.0
8,226
1,445
21.3
34.3
Noncurrent assets
7,803
29.6
42.2
7,673
△ 1.7
40.3
10,033
30.8
52.9
6,657
△ 33.6
35.3
5,915
△ 742
△ 11.2
24.7
0.5
固定資産
75.3
有形固定資産
Property, plant and equipment
166
36.4
0.9
130
△ 21.2
0.7
129
△ 1.4
0.7
124
△ 3.3
0.7
114
△ 10
△ 8.2
無形固定資産
Intangible assets
488
4.4
2.6
591
21.1
3.1
517
△ 12.6
2.7
360
△ 30.4
1.9
266
△ 93
△ 26.1
1.1
投資その他資産
Investments and other assets
7,148
31.6
38.7
6,950
△ 2.8
36.5
9,386
35.0
49.5
6,173
△ 34.2
32.8
5,534
△ 638
△ 10.3
23.1
投資有価証券
Investment securities
4,830
51.2
26.1
4,816
△ 0.3
25.3
7,011
45.6
36.9
4,169
△ 40.5
22.1
3,998
△ 170
△ 4.1
16.7
長期貸付金
Long-term loans receivable
99
-
0.5
319
222.7
1.7
694
117.1
3.7
742
6.9
3.9
385
△ 356
△ 48.1
1.6
その他
Other
2,219
△ 0.5
12.0
1,814
△ 18.3
9.5
1,681
△ 7.3
8.9
1,261
△ 25.0
6.7
1,150
△ 111
△ 8.8
4.8
18,487
△ 2.8
100.0
19,019
2.9
100.0
18,977
△ 0.2
100.0
18,848
△ 0.7
100.0
23,994
5,146
27.3
100.0
3,591
△ 9.1
19.4
3,903
8.7
20.5
3,614
△ 7.4
19.0
3,722
3.0
19.8
7,787
4,065
109.2
32.5
資産合計
Total assets
負債の部
LIABILITIES
流動負債
Current liabilities
買掛金
Accounts payable-trade
短期借入金
Short-term loans payable
未払法人税等
Income taxes payable
工事損失引当金
Provision for loss on construction contracts
その他
Other
1,404
Noncurrent liabilities
3,681
退職給付引当金
Provision for retirement benefits
3,263
その他
Other
418
7,273
固定負債
負債合計
Total liabilities
純資産の部
NET ASSETS
株主資本
Shareholders' equity
560
△ 27.7
3.0
684
22.2
3.6
648
△ 5.3
3.4
692
6.8
3.7
759
66
9.7
3.2
1,399
△ 16.4
7.6
1,399
-
7.4
1,399
-
7.4
1,109
△ 20.7
5.9
4,998
3,889
350.7
20.8
1
△ 98.7
0.0
53
3098.3
0.3
49
△ 6.5
0.3
183
269.6
1.0
118
△ 65
△ 35.7
0.5
226
52.4
1.2
249
10.3
1.3
167
△ 32.7
0.9
381
127.4
2.0
540
158
41.6
2.3
14.5
7.6
1,516
8.0
8.0
1,349
△ 11.0
7.1
1,355
0.5
7.2
1,370
15
1.1
5.7
△ 1.3
19.9
3,348
△ 9.1
17.6
3,375
0.8
17.8
3,377
0.1
17.9
3,093
△ 284
△ 8.4
12.9
△ 1.3
17.7
3,224
△ 1.2
17.0
3,239
0.5
17.1
3,244
0.2
17.2
2,971
△ 273
△ 8.4
12.4
△ 1.6
2.3
123
△ 70.4
0.7
135
9.4
0.7
133
△ 1.8
0.7
122
△ 10
△ 8.2
0.5
△ 5.3
39.3
7,251
△ 0.3
38.1
6,989
△ 3.6
36.8
7,100
1.6
37.7
10,881
3,780
53.2
45.3
10,778
△ 2.4
58.3
11,420
6.0
60.0
11,393
△ 0.2
60.0
10,654
△ 6.5
56.5
11,835
1,181
11.1
49.3
資本金
Capital stock
2,640
-
14.3
2,640
-
13.9
2,640
-
13.9
2,640
-
14.0
2,640
-
-
11.0
資本剰余金
Capital surplus
2,881
-
15.6
2,881
-
15.1
2,881
-
15.2
2,881
-
15.3
2,881
-
-
12.0
利益剰余金
Retained earnings
5,256
△ 4.8
28.4
5,898
12.2
31.0
5,871
△ 0.5
30.9
5,132
△ 12.6
27.2
6,313
1,181
23.0
26.3
その他包括利益累計額
Accumulated other comprehensive income
435
47.3
2.4
347
△ 20.2
1.8
594
71.0
3.1
1,093
83.9
5.8
1,277
184
16.9
5.3
純資産合計
Total net assets
11,213
△ 1.1
60.7
11,767
4.9
61.9
11,987
1.9
63.2
11,747
△ 2.0
62.3
13,113
1,365
11.6
54.7
負債・純資産合計
Total liabilities and net assets
18,487
△ 2.8
100.0
19,019
2.9
100.0
18,977
△ 0.2
100.0
18,848
△ 0.7
100.0
23,994
5,146
27.3
100.0
7
6.要約キャッシュフロー計算書 Summary of Consolidated Statements of Cash Flows
≪連結 Consolidated≫
営業活動によるキャッシュ・フロー
税金等調整前当期純利益
減価償却費
退職給付引当金・負債の増減額(△は減少)
役員退職慰労引当金の増減額(△は減少)
賞与引当金の増減額(△は減少)
役員賞与引当金の増減額(△は減少)
貸倒引当金の増減額(△は減少)
投資損失引当金の増減額(△は減少)
受取利息及び受取配当金
支払利息
投資有価証券評価損益(△は益)
関係会社株式評価損
投資有価証券売却損益(△は益)
固定資産売却損益(△は益)
固定資産除却損
売上債権の増減額(△は増加)
たな卸資産の増減額(△は増加)
仕入債務の増減額(△は減少)
その他負債の増減額(△は減少)
未払消費税等の増減額(△は減少)
その他
小 計
利息及び配当金の受取額
利息の支払額
法人税等の支払額
投資活動によるキャッシュ・フロー
有価証券の取得による支出
有形固定資産の取得による支出
有形固定資産の売却による収入
無形固定資産の取得による支出
無形固定資産の売却による収入
投資有価証券の取得による支出
投資有価証券の売却による収入
関係会社整理による収入
子会社株式の取得による支出
貸付けによる支出
貸付金の回収による収入
定期預金の預入による支出
差入保証金の差入による支出
差入保証金の回収による収入
(投資)その他
財務活動によるキャッシュ・フロー
短期借入金の純増減額(△は減少)
長期借入金の純増減額(△は減少)
社債の償還による支出
自己株式の取得による支出
配当金の支払額
ストックオプションの行使による収入
(投資)その他
現金及び現金同等物に係る換算差額
現金及び現金同等物の増減額(△は減少)
現金及び現金同等物の期首残高
現金及び現金同等物の期末残高
Net cash provided by (used in) operating activities
Income before income taxes and minority interests
Depreciation and amortization
Increase (decrease) in provision for retirement benefits / in net defined benefit liability
Increase (decrease) in provision for directors' retirement benefits
Increase (decrease) in provision for bonuses
Increase (decrease) in provision for directors' bonuses
Increase (decrease) in allowance for doubtful accounts
Increase (decrease) in allowance for investment loss
Interest and divided income
Interest expenses
Loss (gain) on valuation of investment securities
Loss on valuation of stocks of subsidiaries and affiliates
Loss (gain) on sales of investment securities
Loss (gain) on sales of noncurrent assets
Loss on retirement of noncurrent assets
Decrease (increase) in notes and accounts receivable-trade
Decrease (increase) in inventories
Increase (decrease) in notes and accounts payable-trade
Increase (decrease) in other liabilities
Increase (decrease) in accrued consumption taxes
Other, net
Subtotal
Interest and divided income received
Interest expense paid
Income tax paid
Net cash provided by (used in) investing activities
Purchase of securities
Purchase of property, plant and equipment
Proceeds from sale of property, plant and equipment
Purchase of intangible assets
Proceeds of intangible assets
Purchase of investment securities
Proceeds from sale of investment securities
Proceeds from liquidation of affiliates
Purchase of investments in subsidiaries
Payments of loans receivable
Collection of loans receivable
Payments into time deposits
Payments for guarantee deposits
Proceeds from collection of guarantee deposited
Other, net
Net cash provided by (used in) financing activities
Net increase (decrease) in short-term loans payable
Net increase (decrease) in long-term loans payable
Redemption of bonds
Purchase of treasury stock
Cash dividends paid
Proceeds from exercise of stock option
Other,net
Effect of exchange rate changes on cash and cash equivalents
Net increase (decrease) in cash and cash equivalents
Cash and cash equivalents at beginning of period
Cash and cash equivalents at end of period
8
(百万円/In millions of yen)
2011/3 第3四半期 3Q 2012/3 第3四半期 3Q 2013/3 第3四半期 3Q 2014/3 第3四半期 3Q 2015/3 第3四半期 3Q
金額
金額
金額
金額
金額
Amount
Amount
Amount
Amount
Amount
1,095
1,752
414
2,267
2,127
976
1,454
1,475
2,022
1,592
204
216
325
307
295
29
20
0
17
71
16
△ 296
4
△9
△ 26
△ 164
△ 143
△ 215
△ 242
△ 169
70
69
12
13
21
6
12
△3
△2
9
△7
9
0
△2
0
△ 57
△ 119
△ 178
△ 189
△ 169
26
22
21
20
20
51
1
0
835
86
△1
△ 11
△5
0
△0
△0
7
2
0
2
14
1,501
1,266
1,409
1,847
1,357
△ 633
△ 894
△ 667
△ 1,537
△ 869
△ 646
462
△ 485
1,015
74
427
711
98
468
264
△9
△ 96
△ 112
△ 65
218
△ 19
△ 144
△ 324
△ 449
△ 400
1,865
2,552
1,350
3,209
3,142
48
115
125
144
144
△ 25
△ 22
△ 21
△ 20
△ 20
△ 793
△ 892
△ 1,040
△ 1,066
△ 1,139
△ 1,646
△ 2,913
△ 3,200
270
△ 918
△ 300
△ 100
△ 28
△ 37
△ 49
△ 55
0
2
0
△ 120
△ 732
△ 149
△ 77
△ 118
1
△ 1,047
△ 2,466
△ 3,171
△ 68
△ 331
12
1,101
520
939
132
10
82
△ 32
△ 373
△ 1,342
△ 3,435
△ 706
△ 529
20
354
3,004
103
347
△0
△ 70
△ 80
△ 100
△ 10
△9
△3
△ 20
△0
20
29
10
50
57
△ 18
249
48
96
△ 21
△ 783
△ 1,280
△ 461
△ 2,114
△ 932
△ 230
△ 227
65
15
△ 30
300
△ 300
△ 300
△0
△ 499
△0
△ 1,544
△0
△ 553
△ 553
△ 525
△ 591
△ 682
6
80
△0
△0
△0
△0
△0
△ 73
△ 25
△1
95
40
△ 1,408
△ 2,466
△ 3,248
519
317
10,324
9,309
9,496
7,497
7,909
8,916
6,842
6,247
8,016
8,226
7.受注単価・外注単価の推移
8.販管比率・営業利益率の推移
Order Unit Price, Subcontract Unit Price (SRA, Inc. Non-cosolidated)
Ratio of SG&A Expenses to Net Sales, Ratio of Operating Income to Net Sales
(Consolidated/SRA, Inc. Non-consolidated)
◆受注単価(㈱SRA単体) Order Unit Price (SRA, Inc. Non-consolidated)
≪連結 Consolidated≫
17.0%
販管比率
Ratio of SG&A Expenses to Net Sales
13.0%
Additional Information on the Financial Results
12.0%
9.0%
12.0%
11.5%
11.2%
営業利益率
Ratio of Operating Income to Net Sales
5.0%
4.6%
5.2%
5.2%
2012/3 3Q
2013/3 3Q
6.2%
10.8%
6.8%
#########
1.0%
2011/3 3Q
2012/3 3Q
2013/3 3Q
2014/3 3Q
2015/3 3Q
◆外注単価(㈱SRA単体) Subcontract Unit Price (SRA, Inc. Non-consolidated)
2011/3 3Q
2014/3 3Q
2015/3 3Q
≪㈱SRA単体 SRA, Inc. Non-Consolidated≫
19.0%
14.8%
14.8%
14.7%
14.6%
15.0%
販管比率
Ratio of SG&A Expenses to Net Sales
12.8%
11.0%
7.1%
営業利益率
7.0%
Ratio of Operating Income to Net Sales
3.2%
3.0%
2011/3 3Q
2012/3 3Q
2013/3 3Q
2014/3 3Q
-1.0%
2015/3 3Q
9
3.1%
3.8%
1.7%
2011/3 3Q
2012/3 3Q
2013/3 3Q
2014/3 3Q
2015/3 3Q
© Copyright 2026