
見る/開く
Title
Author(s)
Reliability Studies on MOCVD Grown AlGaN/GaN HEMT on
Si Substrate MOCVD法によるSi基板上AlGaN/GaN HEMT
の信頼性に関する研究
Frank Wilson, Amalraj
Citation
Issue Date
URL
2014-03-23
http://repo.lib.nitech.ac.jp/handle/123456789/21739
Rights
Type
Textversion
Thesis or Dissertation
ETD
・名古屋工業大学学術機関リポジトリは、名古屋工業大学内で生産された学術情報を
電子的に収集・保存・発信するシステムです。
・論文の著作権は、著者または出版社が保持しています。著作権法で定める権利制限
規定を超える利用については、著作権者に許諾を得てください。
・Textversion に「Author」と記載された論文は、著者原稿となります。
実際の出版社版とは、レイアウト、字句校正レベルの異同がある場合もあります。
・Nagoya Institute of Technology Repository Sytem is built to collect, archive and
offer electronically the academic information produced by Nagoya Institute of
Technology.
・The copyright and related rights of the article are held by authors or publishers.
The copyright owners' consents must be required to use it over the curtailment of
copyrights.
・Textversion "Author " means the article is author's version.
Author version may have some difference in layouts and wordings form publisher
version.
Reliability
Studies
on
Grown
MOCVD
AIGaN/GaN
HEMT
on
Si
Substrate
(MOCVD法によるSi基板上AIGaN/GaN
HEMTの信頼性に関する研究)
March
Frank
Wilson
2014
AmalraJ
●
Contents
Contents
Chapter
I
Introduction
1.1. History
1.2. Group
1
orGaN
III-Nitrides
1.3. Substrate
3
optlOnS
high
1.4. AIGaN/GaN
1.5. Application
electron
of Gallium
1.6. Reliability
issues
l.6. 1. Inverse
l.6.2. Hot
1.7 Research
2
mobility
4
Nitride
8
HEMT
8
of GaN
pleZOelectric
9
effect
effect
10
thesis outline
ll
electron
objectiveand
transistors
References
12
Chapter
II
Growth,
device
fabrication
2. 1. MOCVD
growth
2.2. Structural
and
characterization
15
method
optical
2.2. 1. X-ray
and
19
characterization
Diffraction
Analysis
19
2.2.2. Hall Measurements
20
2.2.3. Raman
Spectroscopy
22
2.2.4. Atomic
Force
25
Microscope
2.2.5. Electroluminescence
2.3. AIGaN/GaN
HEMT
fabrication
26
27
process
2.3. 1. Photolithography
27
1
C
ontents
2.3.1.1.
Surface
2.3. 1.2. Photoresist
2.3.1.3.
So允-bake
2.3.1.4. Mask
28
preparation
28
coatlng
29
process
alignment
and
29
exposure
2.3.1.5. Development
30
2.3.1.6. Post-bake
30
2.4. Fabrication
process
2.4. 1. Mesa-isolation
passivation
2.4.3. Ohmic
metal
2.4.4. Schottky
device
31
etching
2.4.2. Device
2.5. Basic
31
procedure
contact
31
and
32
alloylng
33
gate metallization
33
characterization
2.6. Stress-test methodology
35
2.7. Summary
38
Reference
39
Chapter
III
Reliability
Studies
on
AIGaN/GaN
HEMT
on
Siwith
Different
Buffer
Thicknesses
3. 1. Introduction
41
3.2. Experiment
41
3.3. Results
and
Discussions
43
3.3.1. Critical voltage
47
3.3.2. Electroluminescence
52
3.4. Summary
54
Reference
55
s
ll
Contents
IV
Chapter
Origin
Appearance
and
IIEMT§
of Defective
Pits at the
Gate-Drain
Region
of AIGaN/GaN
Si
on
4. 1. Introduction
4.2. Step-stress
57
59
measurement
VD_sf,ess
4.2.1.
-
4.2.2. ON-state
4.3. Step-stress
4.4. Cyclic
0 state bias stress
59
bias stress
60
at high
measurement
stress
drain bias
62
stress
68
measurement
4.4.1
VG_sf,ess
4.4.2
VG_sl,ess
-
-10
-
-10
breakdown
4. 5. Three-teminal
V
and
VD_st,ess
-
100
V
68
V
and
VD_sI,ess
150
V
69
-
73
characterization
4.6. Summary
75
Reference
76
Chapter
s
V
Innuence
of GaN
Stress
on
Threshold
Voltage
AIGaN/GaN
HighElectron
Mobility
Transistors
5. 1. Introduction
77
5.2. Raman
analysis
78
5.3. Results
and
Discussions
79
5.4. Summary
87
Reference
88
s
111
C
ontents
Chapter
VI
Conclusions
Acknowledgement
Authors
Accomplishments
1V
Abstract
AIGaN/GaN
for
potential
its high
AIGaN/GaN
last years,
from
are
of GaN
GaN
the material
transient
In order
to tackle
thickness
to moves
stressed
positive
GaN
and
of the epitaxial
at off-state
GaN
the
preventlng
reliability・ In the
processes,
properties
startlng
at
aimed
degradation・
electrical
the
from
We
stressed GaN
devices
MOCVD
grown
the
understand
by
layer.
varylng
because
We
the
device
have
strained
of
fわund
layer
buffer
thickness,
change
in 2DEG
were
observed・
Ram?n
spectrum
found
tensile
bias condition
on
Si is undesirable
on
films
strain in GaN
changes
to
thickness
quality
the strain of the GaN.
GaN
out
carried
grown
increaslng
Upon
f♭rtensile
devices.
One
of failure mechanisms
in GaN
epltaXial
density
in the
out
stress
crack-free
dislocation
carried
and
understanding
approach
the crystal
thickness.
the strain
measurement
to
causes
to understand
today
buffer
and
Though
promlSlng
electrical
problem
different buffer
tensile
to grow
buffer
better
more
optimization
of surface
collapse
a
systematic
Si with
on
it
that it is possible
out
a
Large
the deterioration
carried
the control
various
great
amplifiers・
obstacle
its limited
exhibit
needed.
study,
failure mechanisms.
concentrations,
to
greatest
lS
subjectto
the current
is urgently
HEMTs
superlattice
been
phenomena,
this
AIGaN/GaN
technology
power
substrate, Si is
The
cost.
this reliability problem,
HEMTs
In
have
properties,
reducing
of GaN
HEMT
HEMTs
low
and
(HEMTs)
RF
and
different
on
grown
Transistors
devices
switching
of its large availability
deployment
Mobility
Electron
power
HEMTs
because
wide
High
that
to
we
increase
The
compressive.
reveals
and
as
more
that threshold
negative
the buffer
stepIStreSS
voltage
tends
fわr compressive
A
comparison
buffer
thick
and
buffer
thin
leakage
to
the
was
VD-st,ess
Rd
and
fro甲the
doesn't
show
was
slgnificant
on
130
V・ The
carried
out
and
SiO2
Also
source
and
pltS
With
a
leakage
There
electrical
widely
AIGaN/GaN
to
HEMTs
we
cannot
on
a
Si.
strong
and
the
avoid
GaN
the
of
(3TBV)
These
depth
shows
to the
at the
Although
of buffer
the
a
there
in gm-peak
were
found
spots
the
removlng
to be
increase
gate leakage
100
in the
current
the appearance
of
It is evident
that
drain side edge
which
is
degradation
is
degradation
in
gate-edge
on
Though
found
between
measurements.
reg10n・
influence
found
observed
SEM/AFM
VD-s.,ess10n
the
results
out・
and
devices・
the
not
in
ends
degradation
observed
fわrmed
was
buffer
thick
voltage
carried
in addition
3TBV
Were
was
their average
and
correlation
the pltS
occurs,
from
formed
contributes
degradation
be orlglnated
addressed
is
we
increaslng
voltage
high
at this voltage
edge
on
edge
Were
current
thick
current,
drain
the
breakdown
befわre the gate degradation
believed
Si with
gate
in IDmax
reduction
Si -with
this critical voltage
interrupted
gate
the pltS
breakdown・
the
at
spot
a
on
at
in the
the critical voltage
show
HEMTs
thin
Si with
on
increase
obseⅣed
even
Si with
on
HEMTs
sudden
characteristics
voltage
why
on
were
towards
terminal
substrate
for the device
HEMTs
found
we
critical
understand
measurements
mlgrate
three
of
a
We
AIGaN/GaN
in the gate leakage
found
PaSSivation
nm・
failure・ To
change
around
and
Whereas
I-V
HEMTs
AIGaN/GaN
i・e
is irreversible・
devices・
our
AIGaN/GaN
study
increaslng
for all
slgnificance
device
careful
no
V
degradation・
of critical voltage
which
beginnlng・
any
catastrophic
existence
AIGaN/GaN
on
out
the device
observed
100
-
carried
was
understand
shows
current
above
study
device
the
Chat)ter
Ⅰ:Introduction
-
Chat)ter
I: Introduction
-
1.1 History
ofGaN
In 1932,
by
reacting
decades
al.
ammomia
In
Following
by
a two
layers
transistors
(HEMTs)
frequency,
high
number
by U・ K・ Mishra
[10
says
a
short
current-voltage
devices
teⅢn
and
(I-り
a
long
today
term
GHz
a
high
1
lattice
fabrication
in early
for the first time
between
Khan
AIGaN
applications
intensively
were
HEMTs
at 40
a
including
based
current
currents・
high
pursued
by
overview
2・4 W/mm
at
GHzand
a
of 220
GaN
like
recent
GHz,and
cut10fffrequency
leakage
constant
novel
W/mm
instabilities
GaN
qualityof
highelectron mobility
[19].However,
characteristics,and
In
based
of the GaN
at
energy.
debated・
crystalline
GaN
for
material
widely
at the interface
towards
10・5
at room
of
were
period
operations
GHz,
of 400
LED
et
that the presence
accommodate
AIGaN/GaN
on
performance
at 30
frequency
maximumoscillation
(2DEG)
gas
temperature
RF
13・7 W/mm
GaN
same
performance
high
18]. In
-
the fastest
GHzand
then, research
power,and
of groups
electron
improved
of
Junction
[8].Duringthe
et al.
dimensional
first p-n
to
eV
direct band
concluded
reported,
layer
nucleation
The
substrate・
[9].Since
[6,7] groups
to 3・39
promising
its wide
to
[5]
a
n-type conductivitywhich
AIN
lnSertlng
Montgomery
et al.
reported by Akasaki
GaN
shown
Akasaki
of sapphire
was
it
due
as
gap
four
by Mamska
characterized
the band
GaN
Almost
temperatures・
were
predicted
applications
and
to
high
determined
[4]
laser
leads
et al.and
et al. observed
60
they
Ilegems
in GaN
Yoshida
mismatch
[3] where
nitride (GaN) compounds
gallium
of GaN
properties
Bloom
the丘rst
galliumat
optical
70's,
this in 1973,
improved
and
metallic
devicesand
defects
native
et al.
early
luminescencent
90's
with
gas
Pankove
temperature.
was
[1]prepared
later in 1969/1970
[2]and
1983,
et al.
Johnsonn
devices
have
collapse
of
This
urges
DC
a
ter
I: Introduction
-
comprehensive
important
reliability studies
investigate
optical
to
characteristics
fabrication
teclmology・
112 Group
III-Nitrides
The
the
the
cause
main
throughdetailed
aluminum
(AIN),
nitride
electronicand
or the main
one
of GaN
HEMT
pu叩OSe
(GaN),and
has
big
that
optoelectronic
a
i.e electricaland
material
nitride
device
to
growth
indium
(InN)
nitride
be
to
potential
thesis. It is
O「血s
degradation
investlgationsfrom
gallitlm
Ill-mitrides
available semiconductor
power/temperature
it is
and
in high
used
devices.
S'
4)
冒
ゝ亡
i=
⊂〉
⊂)
3X
.1=
400
Etil
ロ)
l=
q)
l
(勺
500
l⊃)
聖
窒
lt⊃
⊂
d
【□
0.30
0.35
0.ら5
Lattice
Fig1 1 1 Energy
band
・
The
eV
for AIN
crystal
WZ
energy
as
structures
has
of inversion
such
of the
band
gap
shown
as
most
varies
in Fig・
a
hexagonal
zinc-blende
symmetryand
from
structure,
unit celland
or
rocksalt
displays
constant
important
1・11 Group
-1rZite (WZ)
structures.・
structure
gap
0.60
0.65
[nm]
semiconductors
O・9 eV
for InN
III-nitrides
zinc-blende
their lattice parameter
versus
3・4 eV
through
and
rocksalt
structures.
is thermodynamically
more
[20]. The
wurtzite
structures
pleZOelectric
for GaN
cancrystallizeinthree
effect・ Ga-N
bond
to 6.2
possible
The
stable than
structure
is highly
is
GaN
other
has lack
polarized
ter
Ⅰ:Introduction
-
the
with
are
atoms
the cationsand
(Ga
or
nucleation
GaN
the other
at the
atoms
on
substrate
(a)
top)
(b)
The
choice
of the
the
change
polarlty
heterostructure
devices
GaN
III-nitrides. GaN
parameters
From
Of
in the
[23].
mordant
substrate,
is
an
is given
power
device
layerand
Polarlty
to
in Table
much
either
top), depending
candidate
its wide
1.1 for the
and
gap.
commonly
I.1, it is evidentthat
applicatic-ns.
polarityand
method
innuenclng
the
on
operation
A
resume
used
GaN
charges
will subsequently
by
role
the
investigation
fわr device
energy
with
important
an
and
interest
GaN
the grov^h
Plays
defects
of
excellent
in Table
the data reported
for high
GaN.
created
due
enviroI-ment
canhave
one
N-T8Ce
(b) N-faced
and
nucleation
formation
has
layers,
SLJbstrBte
Ga-faced
of(a)
the
[10] (See Fig. 1.2).
Su bstr8te
Fig. 1.2. Structure
[22】,where
of GaN
at the
crystalgrown
G計face
common
most
hexagonal
surface
atoms
The
plane
spaced
crystal
N-polarity(N
or
isthe GaN
which
closely
The
withanions.
(0001) basal
to
Of two
[21].
atom
nitrogen
is no-al
in bilayers consistlng
arranged
Ga-polarity
the
near
mostly
direction or hexagonal
growth
with
located
electrons
growth
performance
amongl
in high
of血ese
semiconductor
of
of final
theall
other
temperature
and
semiconductor
teclmologleS・
has the highest figure of merit
Chapter
Ⅰ:Introduction
-
Table 1 1 Semiconductors
material properties flgure Of merit
・
Material
Property
Bandgap
energy
GaN
Eg
(eV)
field Eb,
Breakdownelectric
Esat
saturated electricfield
Electron
Mobility
Hole
〟
mobility
saturation electron
Maximumdriftvelocity
Thermal
Maximum
T
temperature
Relative dielectric
The
gallium
(oC)
(BFOM
-
best choice
a
of
itself・ GaN
nitride
concentration,
stress,
lattice constant
mismatch・
layer
forelgn
on
growth
of GaN
thermal
conductivityand
are
for RFand
high power
favorable GaN
conductivity,
other
FL
*Ebr3)
3.5
0.4
0.25
15
25
3
8
2000
700
8500
1350
300
120
330
450
2.5
2.1
1.3
1
3
2
2
1
1.5
4.9
0.56
1.5
700
600
300
300
9
10
12.5
rl.9
24.6
3.1
9.6
1
substrate f♭ra GaN
substrate
or
The
problems
offers good
control
low
main
disadvantages
thermal
expansion
with
size・ Hence
The
The
physical
of GaN
growth
but
to
the
successful
applications
very
4
forelgn
on
that theyare
are
is Sic,
with
of GaN
growth
Substrate for the
like; lattice mismatch,
available substrates
sapphire
is not
thermal conductivity・
expensive・
substrates also especially in possible血egration
a
of various
its poor
with
dopant
of polarity,
substrates
be considered
properties
associated
GaN
based devices
device application due
lattice mismatch
to
is only
coefrlCient mismatchand
Substrates is inevitable・ In chooslng
factors
and device
growth
all
very
substrate for microwave
low
GaN
available in large
cost・
・2・
epitaxial
eliminates
to
epitaxia1 layer several
Table・ 1
shownin
s*
of GaN
zero
not
expensiveand
epitaxial
4
for GaN
hetero-epitaxy・ Homoepitaxy
very
1.ll
c,
constant
Baliga figure of merit
1.3 Substrates
(W/cmK)
1(
1:43
(107 cm/s)
ud
conductivity
(107 cm/s)
vsa.
velocity
Si
3.25
(103v/cm)
(cm2Ⅳs)
GaAs
3.49
(106v/cm)
(cm2Ⅳs)
〟
+
4H-Sic
in terms
good
Si promises
matured
favorable
The
most
of thermal
advantages
Si electronics.
over
ter
I: Introduction
-
Table. 1.2 Physical
Substrate
Lattice
Sic
to GdN
Sapphire
a:
7.5
c:
8.5
4.9
[W/cm.K]
conductivity
17
4.08
[1016K-l]
expansion
Si
14.1
[%]
[inch]
Size
for the growthofGaN
of available substrate
for GaN
mismatch
Thermal
Thermal
properties
1.5
0.2 -0.5
2-3
2-4
2-12
Expensive
LowprlCe
Very
Cost
Expensive
Output
Overall
Very
power
sapphire
Good
rating
This
is due
to its availability
and has
substrate,
lattice mismatchand
strain leading
layers
already
Sem
high
to
cracks
iconductor
a
thermal
quality
coefficients
was
Very
good
wafers (12inches), cheaper
Disadvantage
thermalconductivity.
grow瓜But
Good
Moderate
in largearea
moderate
inthe
higher
nowadays
grown
Moderate
good
mismatch
uslng
achievedand
a
causes
which
System
crack
thanSiC/
is the higher
strong
Of intermediateand
free
structures
tensile
buffer
have
been
[24,25].
I
Sem
iconductor
u
I
Semiconductor
Semicollductor
Vocuum如l
Fig. 1.3. Energy
band
diagram
forwide
(I)and
narrow
(II)band
gap
semiconductor
lI
ter
I: Introduction
-
1・4 AIGaN/GaN
highelectron
AIGaN/GaN
HEMTs
are
crystal
direction (0001)with
top
GaN
of
between
buffer layer・
two
functions
contact
discontinulty
ln
in the conduction
bottom
at也e
Fig.
band
side,也e
voltage,血e
bandand
conduction
creates
triangular
a
dimensional
two
diagramof
work
different
two
is reached
band
valence
gas
in
are
by linlng up
is fc'rmed.
The
to the
near
quantumwell,and
electron
on
is formed
Eg, permitivities占も,
equilibrium
in
is deposited
different semiconductors
two
these
layer
heteroJunCtion
or
band
energy
deposition
vapor
AIGaN
Athin
band-gaps
energy
Fig.1.3(a).When
level and
chemical
heterostructure
XSI The
aFlnity
bias
boundary
surface・
diHerent
Of extemal
discontinulty
r
with
electron
a
metalorganic
a
general,
in the absence
the Fermi
shownin
In
is shownin
semiconductors
grownby
galliumface
semiconductors
q¢s,and
transistors
mobility
is fbmed
(2DEG)
as
1.3(b).
11{.
AJGc]N
二こ-'-=ごT
EF
//
/
//
,
/
/
Su bsTrole
Fig・
1・4・ AIGaN/GaN
direction
from
Subslr(コIe
based
of the spontaneous
Whenthewide
the donor
band
/
structure
and
gap
atomsand
Ga-polarity・
with
Polarization
the piezoelectric
polarization
2DEG
at the interfTace
is highly
semiconductor
collected
as
2DEG
induced
sheet
(left);
electron
(right).
dopedthen
channel
charge
accumulation
dens】ty with the
and formation
of
the electronsare
in the
quantumwellunder
separated
the
Chat)ter
Ⅰ:Introduction
-
heterointerface・
to a high
and leads
The
on
a
This
in
the
and
ionicity
the
(Psp)
piezoelectric
coefficients
in many
from
two
and
spontaneous
AIGaN/GaN
and
interface
by
is
a
and
minimum
that the AI concentration
the 2DEG
along
III-V
with
channel
the
bond
(PpE) are
semiconductors.
in spontaneous
strained
AIGaN.
piezoelectric
the
high
AIGaN
Hence,
the polarization
total
thickness
in the AIGaN
layer
[28].
7
density
necessary
determines
spontaneous
larger
charge
AIGaN
of -1013
induce
the charge
cm12
both
of
in 2DEG
charges
arises
and GaN
field
polarization
to
the
along
of magnitude
between
induces
two
(Fig. 1.4.).The
an
order
a
and
large
a
occur
polarization
charge
boundary
GaN
band
energleS,
almost
The
is grown
lack of symmetry
The
c-axis
polarization
sheet
to
near
in wurtzite
hexagonal
the
barrier
in band-gap
layer
scattering
[26].
the AIGaN
difference
GaN
the
of
of III nitrides
effect
polarization
that there
shown
oriented
in the chamel
velocity
is created by electrons.
the difference
pleZOelectric
to
the coulomb
reduces
is created when
of the covalent
of traditional
sources:
saturation
Due
part
channel
polarization
than
layer・
upper
conductive
c-direction
high
a
and
GaN
drastically
of electrons
heterostructure
thick
occurs
dimensional
mobility
AIGaN/GaN
relatively
bending
separation
at the
[27]. It
was
charges
in 2DEG
sheet
denslty
ln
ter
I: Introduction
-
l・5 Applications
of Gallium
ln the recent
・5・
This
decade,
GaN
for application
characteristics
1
Nitride
GaN
shows
is
in high
a
frequencyand
itself
positioning
semiconductor
as
a
next
material
with
devices
high power
generation
attractive
power
〔77Gl甘1
[29].
D[g触TerreRrEaI
BroadcastlJlg
StatlorlS
Operatng
Temper血re
Radar
showninFig.
semiconductor
for E(eetrlc
nverter5
and llybrld Vehlcles
AJltkorlts[on
as
physical
R由y
帆Ⅶe pp
H.Tgh G8ien8山bHrier
;::て■予て?:'1
Power
Converter
E)ovvJle[zJq
Broadbarld
仙川FEekl
NoJse
VI・'由gop
LDrN
L仇V
Ctrctn
CarRfrミ亡dtモロrLg
rlミ叫eTLCV Eロ〇5
A-.\・`鵡F
9・^rFcTr'3 []nL/eTter51
A@
旨.与1:.
I
---I
■■--一
wlrモre68 net楢Ork
8y9temミ〉
F19tJre I-NF)
I
⊃○ヽ:CB
S6rVICO
Maxlmurn
lbTLaX)
Currer)I
Abx[m
L(m
OscIEJathg
ト血hitoTeTrT.:Ild
Frequency
、●-:コ‥.:
∴・乳・・・
H吋h Capacity
CommtlrttCi)tJon
to
1AlterFlative
Fig・ 1.5. Application
1・6 Reliability
properties
starting
aimed
years,
from
the
improvlng
phenomenon,
the current
criticalareas
in AIGaN/GaN
process
as
of GaN
based
一軒
Satelllte
Systems
llaVellng-Wave
†ube
s)
semiconductor
issues
In the recent
processes,
areas
I
we11・ There
GaN
have
materialproperties,
device
collapse
HEMTs
are
HEMTs
performance,
problems
which
been
to
subjectedto
the
control
breakdown
various
of
voltage,
and
electricaldegradation・
are
related
possibilities that Scho血yand
to
buffer
surfaceand
transient
reducing
Fig・
epltaXialgrowth
Ohmic
optlmization
contacts
1
・6
depicts
qualityand
degrade
and
ノ
ter
-
I: Introduction
imperfect
layer
passivation
dispersionand
lagging effects
In designing
AIGaN/GaN
electric field
(-
due
to inverse
Localized
6
and
substrate
Fig. I
between
・61
Presently
is large,
Schematic
there
piezoelectric
I.6,1 Inverse
effect
electric
even
should
pay
attention
growth
condition,and
GaN
bending.
can
In
occur
[30]
and
worse
as
hot electron
degradation
cancause
dislocation
fig
above
thermal
high
Fig.
'due
mostly
can
also acts
resulting
ln
between
mismatch
1.6).
to
as
large
GaN
described in Fig. 1.6. (h).
showing
of degradatic・n
streams
the
conceming
materialgrowth,
case,
HEMTs
ofAIGaN/GaN
main
aRer
cause
which
(see (d) and (e) in
(i),(g)inthe
see
down
cooling
cracks
two
critical
areas
mechanism
of device
degradation
explanations:
inverse
[31,32].
effect
del Alamo
field, additional
effects
(a),(b),and (c).
see
hot electrons
to material
wafer
pleZOelectric
Johand
one
1.6.
generate
substrateand
representation
are
device
During
to the
Fig.
shownin
effectand
native defects -due
strain due
tensile
as
charging
under the gate atthe drain side which
MV/cm)
for degradation.
polnt
for parasitic
responsible
HEMT
piezoelectric
lattice mismatch
a
are
[33]
tensile
proposed
a
strain generated
mechanism,
intheAlGaN
as
a
result
bamier
of applied high
due
to
the lattice
Chapter
I: Introduction
-
between
mismatch
effect・ The
piezoelectric
the
drain
at the
several
improved
device
1.6.2 Hot
electron
By
thermal
is turned
or
thus
authors
are
changes
further
ion etching,
increase
the
on
in the
hot
lS
trapped
the high
the device
on
[34]. Moreover
AIGaN
barrier
than
energy
leads
to
1n
they
and
can
of the results
lattice
the
electric field when
surface,
degradation
[31]・ Some
hot electron
interface
and
responsible
RF
the influence
trap density
Pavlidis
stress
at the
recess,
the device
the AIGaN
barrier
traps
also generate
discussed
by various
depth,
recess
They
of AIGaN
surface
of negative
formed
by reactive
that
concluded
charge
drastic
a
heterointerface resulted from
AIGaN/GaN
induces
mechanism
an
early
the faster the degradation・
studied
AIGaN/GaN
for the observed
involves
accumulation
HEMTs・
Another
[41]have
on
With
of gate
in GaN
meaSurement・
the larger the
and
reg10n,
degradation
stresslng
degradation
the
show
of gate-drain
[40] have studied
Ⅵ11izadeb
trapplng
field opens
effect
higher
with
from
energy
trapping
experiments
potential
ofIDS;
the effect of DC
in the
strain
gate
below
probe
electron
degradation
piezoelectric
electrons
tO the reversible
charge
addressed
et al・
be
may
rlSe
glVlng
are
get kinetic
can
the surface
[39]・Jha
inverse
the
under
that the maximumelectric
reveals
in
consequently
stress
electromechanical
reduce
electrons
electrons
Kelvin
elasticity'and
[35-38].
hot
They
promoting
crystal
inverse
cause
which
effect
Hot
in the buffer
that
reported
de丘nition
on・
The
created・
buffer
GaN
and
beyond
injectionand
reliability
energy・
layer
simulation
electron
have
authors
be
can
during
side
for
possibility
barrier
total strain exceeds
defects
crystallographic
edge
AIGaN
the
adopting
HEMTs:
degradation
10
they
noise
in both
measurements
and
study
that hot electron
concluded
DC
to
RF
tests.
Coffie
et
Chapter
al.
Ⅰ:Introduction
-
[42] observed
a
the
induced
degradation
however,
that there
-
1.05
1.7 Research
now
is
few
only
HEMT
In
This
In Chapter
comparison
studies
out.
to
get
carrier
be
stressed,
that many
authors
positive
4, DC
insight
relationship
between
summarizes
the conclusions
the
out
activation
together
into
stress
and
on
and
As
of
on
Si
on
studies
the
understand
device
HEMTs
of GaN
device
terminal
the血eshold
was
HEMTs
buffer
thick
carried
fabrication
were
discussed・
were
out
the early
at different
bias
Electricaland
presented・
breakdown
First,
thicknesses
to detect
perf♭med
were
degradation
ll
to
thin and
buffer
thick
of this dissertation.
HEMT
reliability
their results
were
experiments
with血ee
respective
systematic
methodology
grown
grownon
deployment・
followlng:
as
measurements
step-stress
HEMT
GaN
experiments
in AIGaN/GaN
AIGaN/GaN
on
thicknesses
stress
and
achieved
to its wide
growth,
HEMT
Electroluminescence
characterizations
perfわrmed
with
been
out
carried
details of MOCVD
AIGaN/GaN
on
has
carried
buffer
various
3 degradation
for AIGaN/GaN
conditions
HEMTs
Still a bottle neck
have
characterization
In Chapter
degradation・
of GaN
thesis will be organized
2, the
discussed.
lS
studies
we
Si with
device
carried
It should
mecbanism・
advancement
reliability
study,
on
Chapter
HEMT
that hot
and concluded
in
power
outline
device reliability
failure mechanisms.
su血ce
thesis
In this research
AIGaN/GaN
of output
in the literature, and
this topic
degradation
teclmologlCal
much
were
on
agreement
activated
oC
205
to
155
degradation
dominant
objectiveand
there
process,
from
degradation
for the
energy
eV
perfわrmance,
substrate.
were
no
-2・O
Although
HEMT
is the
thermally
reported
energleS
activation
junction temperature
varylng
have
negative
voltages
modes・
Chapter
5
voltage
shi氏・ Finally
were
presents
Chapter
the
6
g垣pte卜Ⅰ: Introduction
References
[1] W・
36
C・ Jolmson,
J・ B・ Parsons,and
M・
C・ Crew:
The
joumalofPhysical
Chemistry,
(1932) 2651.
[2] H・
P・ Maruska,and
[3] J・
I・ Pankove,
J・ J・ Tietjen:
Appl・
H・
P・ Maruska,and
Phys・
Lett. 10
(1969) 327.
J・ E・ Berkeyheiser:
Appl・
Phys・
Lett・
17
1
(1970)
197.
【4]S・ Bloom‥
[5]M・
J・ Pbys・ Chem・
Ilegems,and
C・ Mentgomery:
[6] S・ Yoshida,
S・ Misawa,and
[7] I・ Akasaki,
H・Amano,
9S
Solids, 32
(1971) 2027.
J・ Phys・
S・ Gonda:
y・ Koide,
Chem・
K・
Appl・
Solids, 34
Phys・
Lett・ 42
Hiramatsu,and
N・
(1973) 885.
(1983) 427.
Sawaki:
J・ Crystal
Grow血,
(1989) 209.
[8] I・ Akasaki,
H・Amano,
[9] M・ A・馳an,
K・ Hiramatsu:
M・Kito,and
J・ M・
VanHove,
J・ N・
J・ Lminescence,
D・ T・ 01son:
Kuzmia,and
48
Appl・
(1991) 666.
Phys.
Lett. 58
Murphy,
W.
(1991) 2408.
[10] 0・Ambacher,
J・
Schaff, L・ F・ Eastman,
Hilsenbeck:
J・ App・
[11] S・ Aru1kumaran,
73
R・
R・
Shealy'N・
Dimitrov,
Phys. 85
L・
G
Weimarm,
Wjtmer,
M・
K・
Chu,
Stutzma-,
M・
W・
J.
J.
Rieger,and
(1999) 3222.
T・ Egawa,
H・ Ishikawa,
T・ Jimbo,and
M・
Umeno:
Appl・
Phys. Lett.
(1998) 809.
[12] T・
3S
SmartJ・
Egawa,
K・ Nakamura,
H・ Ishikawa,
T・ Jimbo,and
M・
Umeno:
Jpn・ J・ Appl.
Phys.
(1999) 2630.
[12] T・
Egawa,
N・
Nakada,
H・
Ishikawa,and
M・
Umeno:
Electromics
Lett. 36
(2000)
1816.
[14] 0・Ambacher,
J・ Smart,
J・ R・
Shealy'N・
12
a
Weimann,
K・
Chu,
M.
Murphy,
W.
J.
Ⅰ:Introduction
Chapter
-
Schaff,
L
R. Dimitrov,
F. Eastman,
A.
Mitchell,
M.
and
Stutzmann:
J. App.
Phys.
85
U・
K・
(2000) 334.
[15] T.
Palacios,
Mishra:
IEEE
Electron
[16] R.
Chu,
Z. Chen,
Electron
[17] R.
A.
Device
Chu,
[20] S.
Y
V. Novikov,
S. Yan,
D. Zheng:
[23] S.
N.
Electron
Suzue,
and U・
K・
Mishra:
IEEE
Z・ Chen,
Brown,
Lett. 29
S・ Keller,
S・ P・ DenBaars,
(2009) 974.
IEEE
Electron
Device
Lett・ 30
(2009) 587・
p・ 21, 2011・
X.
Xiu,
Q.
Lett. 90
Willander,
Phys・
J・ Kent:
andA・
Eng.
Phys.
C. Jain, M.
DI
and T. Egawa:
Sci. and
R. Zhang,
Appl.
S・ P・ DenBaars,
Device
C. T. Foxon,
Mat.
and
(2006) 13.
Fichtenbaum,
Semiconductor,
[21]J. I. Pankove:
[22]W.
Lett. 27
S・ P・ DenBaars,
(2008) 910.
IEEE
[19]Compound
S・ Keller,
S. Heiknan,
Y. Pei, S. Newnan,
L. Shen,
Selvaraj,T.
L.
Device
Lett. 30
and U. K. Mishra:
[18] S.
Chakraborty,
B61
(1999)
State Sol・ A207
(2010) 1277・
305・
Z. L. Xie, P. Han,
R・ L・ Jiang,
Y・ Shi,and
S・ L・ Gu,
(2007) 182113・
∫.Narayan,
and
R・ Ⅵln Overstraeten:
Appl・
Phys・
Rev・
87
(2000) 965.
[24]H.
Ishikawa,
growth
178
(1998) 189.
[25]M.
H.
Kim,
(2001)
2713.
[26]C.
Kittel: Introduction
[27]J. P.
Appl.
i; G.
Ibbetson,
Pbys.
[28] M.
K. Yamamoto,
M.
H.
C. Kang,
to Solid
T. Soga,
D. Y. Nohn,
State Physics,
P. T. Fini, K. D. Ness,
Lett. 77
Fieger,
Do,
T. Egawa,
T・ Jimbo,
and
John
M・
and
S. J. Park:
Wiley
S. P・ DenBaars,
ans
Umeno:
∫.Crystal
Appl..Phys・
Sons
J・ S・ Speck,
Lett・ 79
lnc・, 2005・
and
U・ K・ Mishra:
(2000) 250・
Eickelkamp,
L. Rahimzadeh
13
Koshroo,
Y・ Dikme,
A・
Noculak,
H・
Chapter
I: Introduction
-
Kalisch,
M・
[29] T・
Egawa:
[30]J・ Joh,
[31] G・
Heuken,
R・ H・ Jansen,
ULVAC,
63
L・ Xia, and
Meneghini,
IEEE
Trans・
K・
Sahoo,
R・ K. Lal, H. Kim,
Device,
50
(2003)
1163
[33]J・ Joh
and
[34]M・
G
Ancona,
[35]A・
Saura,
H・ Ji, M・
Balmer:
Appl・
Phys・
Guo,
Lee,
S・ C・ Binari,
Kuball,
Lett. 88
W・
L・ Witkowski,
Gotthold,
Growth,
298
(2007) 843.
Dev・
F. Rampazzo,
Mat.
Tech.
and
D・ Meyer‥
2006,
Phys・
IE・EE
Tazzoli,
M.
Trans.
Electr.n
pp. 4151418.
Stat. Sol., Cl
T. Martin,
A.
(2008) 332.
L. F. Eastman:
Dig.
J・ Uren,
pp. 385-388.
F. Zanon,
Reliability, 8
V. Tilak, and
IEDM
M・
Dig., 2007,
K. J. Nash,
(2011) 201001056.
K. P. Hilton,
R. S
and
(2006) 103.
H・
-Q・
B・ Albert: Electron.
and
[37] D・
J・ A・ delAlamo:
Tech.
F・ Danesin,
[32]D・
[36] C・
IEDM
GI Verzellesi,
E・ Zanoni:
and
J・ Cry.
(2013) 18.
J・ A・ delAlamo:
Meneghesso,
Vescan:
andA・
Teng,
Lett. 41
S・ P・ Guo,
P・ Saumier,
R. Birkhalm,
D. 01son,
G. Munns,
S.
(2005) 155.
R・ Birkhalm,
B・ Albert:
and
J・ Electron・
Mat・
33
(2004)
408.
【38]P・ Ⅶ1izadeh
D・ Pavlidis‥ IEEE
and
[39] G・
Koley,
Devices,
50
(2003) 886.
[40] S・
K・
Jha,
COMMAD,
W・
Cofrle,
B・ Luo,
M・
Tilak,
B・
2004,
[41]P・ Valizadeh
[42] R・
V・
H・
L・
Trans・
F・ Eastman,
Leung,'c.
Electron
M.
and
surya,
H.
G.
Devices,
52
Spencer:
IEEE
Schweizer,
and
H.
(2005) 1933.
Trans.
Pilkhulm:
Elect,.n
in
Pr.c.
pp・ 33-36.
and
D・ Pavlidis:
Y・ Chen,
IEEE
I・ P・ Smorchkova,
Wojtowicz,
and
A・
Oki:
Trans・
Device
B・ Heying,
in Proc・
568-569.
14
IEEE
Mater.
Rel・ 5
V・ Gambin,
Int・ Rel・
(2005) 555.
W.
Phys・
Sutton,
Symp.
Y. C. Chou,
2007
pp.
Chat)ter
II: Growth.
-
ChaDter-II:
device
Growth.
2.1 MOCVD
growth
Recently
direct and
methods
beam
Molecular
bulk
quasi
can
produce
and
abrupt
low
temperature
(MBE)
is
fllms
only
a
the
an
has
growth
begun
are
on
RF-heated
high
strong
pressure,
high
reactions
functions
temperature,
15
[16].The
gas,
for
applicable
embraced
method.
growth
IIIIN
in
a
low
fllms
during
of high
[13]. Later,
reactor
Recently,・
specific
of the precursors
carrier
composition
till date.
produced
occurrlng
MBE
growth.
widely
pressure
quality
rate
growth
doping,
MOCVD
[14].
system
elucidated
for GaN
devices
fllms
GaN
to grow
chemical
to be
based
deposition
v叩Or
most
popular
is the MOCVD
years
atmospheric
(APIMOCVD)
of
The
in the
(HVPE) [1-4],
expensive,
successful
quality
used
very
to their
most
offers high
used
vacuum.
of GaN
to report
one
has also been
detailed thermo-dynamics
as
first
chemical
of thickness,
in recent
quality
The
epitaxy
which
are
ultra-high
the highest
nature
organic
control
due
progress
done.
phase
teclmiques
lmpreSSive
applications
been
teclmique
of GaN
growth
MOCVD
detailed
of III-Nfilms
need
of very
remarkable
vapor
M・etal
good
a
has
the disadvantages
described
(LP-MOCVD)
frequency
years,
growth
with
by employing
pressure
high
of the oldest
one
the demonstration
to
Hydride
are
simple
and
quality
al., have
et
characterization
techniques
[5-11],and
it is
et al., is the
III-N
The
well
growth
has produced
atmospheric
as
epitaxial
Nevertheless,
fわr the high
Nakamura
growth
growth
growth
Amano
MOCVD
recent
epitaxial
layers:
Interface.
MOCVD
quality
In
energy.
high-qualitylayers
technique
and
led
and
gap
epitaxy
GaN
and
have
for high-power
[4-6,12]. HVPE
(MOCVD)
The
devices
for GaN
used
its alloys
and
GaN
of
fabrication
method
band
wide
development
device
GaN
in electronic
results
fabrication and characterization
two-flow
pressure
[15].
the
MOCVD
kinetics
reaction
and
and
substrate
employed,
and
reactor
geometry.
Chapter
ⅠⅠ:Gro紬brication
-
Hydrodynamics
This
can
for the
true
The
employed・
by tbe丘)1lowing
a
also play
is especially
generally
and characterization
Al
良 is organic
The
have
they
gas
and
used
important
for GaN
vapor
in this
alkyls
conveniently
is
described
growth
(2.1)
a
column
compound
room-temperature・
of high
Ga,
atoms,
quality
semiconductors
delivered uslng
canreadily
The
most
H2
epitaxial
device
since
Carrier
commonly
(NH3). An
gallium(TMGa)andAmonia
in the growth
III metal
(methyland ethyl derivatives)aredost
of III-N
near
extremely
structure
is the
sources.
(CH3)3Ga(g) + NH3(g)
Temary
temperatures
growth
N.
case
pressuresand
is Trimethyl
consideration
of the
purity
high
temperatures
source
C2H5'M
0r
selected for the growth
reasonably
source
CH3
III metal
column
the precursors
oRen
high
the
of
experiments.
ME(s)+3Rh(g)†
-
radical, typically
simple
result
of growth
[4,16]:
E is a colurrm V atoms,
In.and
or
a
results
reaction fわrIII-V bin∬y compounds
R3M(g)+EH3(夢)
Where
as
nitrides
general
equations
role in the血al
strong
alloys such
simultaneously
TMGa
with
TMAl
of the
composition
AIGaNand
as
InGaN
as
and
GaN(s)
-
canbe
described
TMGa
+
(2.2)
obtained by combining
in equation
TMAl
or
(2.3).Adjusting the
the TMIn
or
3(CH3)HT
and
TMGa
TMIn
gas-phase
the solid
controls
composition.
+
x(CH3)Al(g)
However,
strongly
done
the exact
depends
by using
Magnesium
1-x(CH3)Ga(g) + NH3(g)
control
of the composition
the experimental
on
Silicon
AIxGal-xN(s)
-
conditions・ Doping
[16118],Germanium,
[19-20]and Zinc [7]for
ofthefi1m
Sulphur,
p-type.
16
+
(2.3)
x(1-x)CH4(g)T
in such
(x)obtained
of GaN
Selenium,and
in MOCVD
Tin
reactions
has
been
for n-typeand
ter
-
II: Growth
device
fabrication and characterization
I}
0
O
こウ
V
」■
e
こJ
q)
」■■■■
也
t=
・ト・・■
∽
-B
(一(
⊂)
≡
cd
∈:
⊂)
N
l=
O
」=
(.H
O
4)
∃
」=
(J
i
O
q=
■-
こロ
⊂=
qJ
⊂
⊂
也
」=
O
i
○
G
∼
t:
cd
コ
【コ`
'巨
岩喜
qJ
古
く.H
O
CLO
⊂
=当
也
L..
pて⊃
・B
亡弓
≡
∽
U
」=
O
⊃
こ/〕
Iロ
a)
[⊥1
rー1
ぎ
Chapter -
II: Growth,
Dopants
device
SiH4
lab, Taiyo
installed
to
in
a
suppress
unifb-lty,
steel chamber・
themal
convection,
NH3
top now
their carrier gas and
The
upstream
the
reglOnS
D凪1Sion
starts
gases
of the
a
at
the flow
and
affect the
wafer
is heated
or
and
(Pyrolytic
contact
to
corrosion
glass, gr叩hite,
Nitride)
melt
Of the
the
fumace
is used
as
is this pyrolytic
glassy
carbon,
silicon
gases
are
electrically
The
nitride
nitride,
18
or
more
whereas
aluminum
into
through
dopant
on
growth
concentration
The
of
total gas
it can
since
In
other
stable
to
order
really
The
ceramic
material
material
can
be
avoid
than
surfaces
Insulating
nitride
and
concentration・
oC・
other
these
laminarflows.
plate
crucial
1200
PH3)
beater.
boron
to
up
of ammonia
interior,
and
In this
in Fig. 2.1.
the stream・
very
the shape
nOW・
shown
liner, the
along
rate,
organometallics
isolation
In this flow
is
in order
growth
and
formed
of the
edge
heater
the
reactions,
structure
that
composition,
resistance
gases
injected,as
stage
increases
Injected
of
2.1
glass
liner;is adopted
III element
of group
nozzles
of quartz
gas
our
Figure
quality・
veloclty
In
threellayer
a
reduction
high
achieve
three
a
gradually
alloy
the
separately
reactor.
dissociation
of
to
are
flow
gas
of GaN・
has
liner made
undesirable
at the
starts
rate,
carbon
unwanted
Boron
the
a
suppress
organometallics.
which
acceptable
cause
may
three
of the three
growth
by
flow
liner has
substrate
balance
uniformlty,
uncontrolled
solution
the
The
to
the
via
reg10n
near
reactor・
inert gas
organometallics
organometallics
flow
ln)eCted
downstream
the
designed
flow
Of the
reg10n
with
its carrier gas, mixture
and
used
growth
or
dopants
p-type
was
machine
which
carefully
was
and
A thin restricted
quality・ In order
system,
and
MOCVD
stainless
linear
MOCVD
the
yielded
three-flow
n-type
growth
hydrides
through
reactor
common
MOCVD
that
and丘1m
now
of the
the most
Sanso
laminar
to
transported
are
teclmology
a
shows
Cp2Mg
Nippon
flat flow
be
can
Si2H6,
0r
fabrication and characterization
the
PBM
in direct
like quartz
corroded
by
device fabrication and characterization
Chat)ter - II: Growth
the meltand
thus
2.2 Structural
and
This
optlCal
optical
properties
Atomic
Force
X-Ray
out
impurities.
unwanted
characterization
the
of the sample.
diffraction
Microscope
in the solutionwith
pollution
section describes
carried
non
cancause
main
Though
(XRD),
(AFM).
methods
various
Hall
All these
to
characterization
measurement,
teclmiques
methods
present
concept
ofanX-Ray
19
available
the advantage
diffraction
Fig・ 212・ Basic
structuraland
we
Ramanspectroscopy,and
destructive.
2.2.1 X・Ray
the
characterize
di缶actometer
of being
Chat)ter
The
to
XRD
their
verify
detemine
by
has
been widely
crystalline
lattice
the
diffracted
a
selected
influence
to
importance
thin丘1ms・
density
this, because
of
in turnaffects
(n),electrical
The
Hall
resistivity
effect
its simplicity,
low
We
is employed
α'-scan
X、peれ
I
Crystal
directly
can
line width・
the
Figure
the
determine
to
need
(LL)of
mobility
relatively
simple
fast turnaround
and
for
Philips
use
The
by
in the semiconductor
technique
characterization
cost,
a
is
unit.
(R), and
provides
and
sample
method
the FWHM
is supported
effect
to
epl-Structure
diffraction
ofXIRay
Hall
the
the
On
(HR-ⅩRC).
cuⅣe
and
relationships
grownAIGaN/GaN
which
of
in semiconductors・
indispensable
in GaN
densities
measurement
doing
diffraction
rocking
2.2.2 Hall
carriers
X-ray
X-ray
the pictorial representation
carrier
[21].The
MOCVD
2・2 shows
accurately
implngeS
density
our
study
by the line defect
The
beam
of the samples
quality
epitaxial
X-ray
family
plane
high十reSOlution
quality丘om
An
the crystalline
identifythe
to
orientation,
dislocation
diffractometer
to probe
used
parameters・
the血eading
measurlng
X-ray
device fabrication and characterization
II: Growth
-
for
method
It is
time.
industry
the
an
and
in research
force
[22],which
laboratories.
The- basic
is
an
a
of two
combinatory
moves
electron
principle
direction
convention・
With
velocity
curled
on
an
a
electron
an
force
fわrce
hand,
can
by
X
llV
be
the fingers
into the direction
dete-ined
is the Lorentz
fわrces: the electric fわrce and
magnetic
open
is then
Effect
the electric field direction
its magnetic
of
and
separate
along
field, it experiences
the Hall
underlying
B
normal
detemlnlng
are
polnted
by
opposite
20
direction
to
uslng
applied
The
magnetic
both directions.
the
right
the direction
along
of the magnetic丘eld・
the
to an
perpendicular
acting
fbrce・ When
the magnetic
hand
The
rule
of the carrier
fわrce direction
magnetic
that the thumb
is polntlng・
ter
The
device
- 1l: Growth
Lorentz
resulting
fabricationand
fわrce F is therefわre,
Fニーq
where,
characterization
q is the elementary
(E
charge
+
VB)
(2・4)
is l・ 602
which
is
10-19 c, E isthe electric field・ V
field・
B is the magnetic
the particle veloclty,and
x
(
n瓜l・dirlalp
S〉pitem
ILL
、
Fig・ 2・3・ Principle
Hall
The
constant
the sample.
measure
The
1 and
3 and也e
contacts
2 and
be calculated
a constant
sample
the Hall
voltage
Hall
4. Once
from
consists
measurement
I and
current
a
a
of
measurements
series
Fig・ 213 represents
Cu汀ent
voltage
VH(-
the Hall
voltage
of voltage
field B applied
magnetic
shownin
VH,
ofHall
the Hall
I is fbrced血ough也e
is measured
V24)
VH
to the
perpendicular
measurement
is acquired, the sheet
the
method・
remaining
carrier
(2.5)
ns=拓
21
pair
densityn.T
theknc-wnvalues.
IB
plane
of
To
pair of contacts
opposlng
across
a
with
measurements
of
Can
Chapter
II.・Growth
-
2・2・3 Raman
Spectroscopy
The
place
device fabrication and characterization
of light which
scattering
an
when
[23125]
incident
light
ray
material
(Solid,liquid, gas)・ As
electron
orbits
frequency
( co ) as
in
results
induced
a
the
with
periodic
dipole
separation
but the redirection
encounters
an
this incident
constituent
the electric
is nothing
in
obstacle,
light ray
of light that takes
our
interacts
case
agitated
periodically
fleld of the incident
ray. The
agitation
of
charge
within
the
the
with
are
molecules
scattering
molecules,
the
ma,tter,
with
the
of electron
same
cloud
is called
which
of
an
moment.
■---■-
--一l-
㍗
Vi
1e
ド
■■■■---
E=
-■---■-
一
i
「
i
i
」
i】
】
Real
levels
」
Strokes
(w.-
wvib)
Fig・ 2・4・ Energy
inelastic
level diagram
ln general,
there
scattering・
When
are
two
the
Rayle igh
Anti
W。
(W.+
sbowlng
types
maJOrlty
the state involved
of scattering
Of
22
stroke
s
w
Wvib)
in Raman
slgnal
i・e・ elastic scatterlng
available
light scattered
-
is emitted
at
the
and
identical
Chapter
II: Growth.
-
frequency
a). -a)vE・b
at different
dipole
induced
frequencies・
The
light ray
are
Which
,
first scatterlng
higher丘equencies
at
results
in
frequency
and
scatterlng
frequencies
two
as
anti-stroke
Bond
noted
that
vibrational
condition
scatterlng・
he
cases
to as
referred
C・
V
was
or
is referred
Ar-+B
ヨ巳
vibrational
mode
results
in
scattering
a
to
was
as
Raman
change
in the
is that the
Raman
prlZe
atoms
With
the
down
frequency
describe
this type
of inelastic
in 1930・
It has
to
in physics
to
corresponding
polarizability
must
term∂7iQ
23
scatterlng,
position
up-shifted
and
the丘rst
of
the equilibrium
about
scatterlng,
the noble
length
Bond
-L-Q.
Strokes
awarded
く旨]
=〉
length
ofA-B
displacement
the
for Raman
hence
to lower
shi氏ed
-L
light in these
for which
scatterlng,
three
compression
E=E
length
frequency
same
prOCeSS・
B
Fig・ 2・5・ Vibrational displacement
shifted
a).,
frequency,
are
Equilibrium
-L+Q.
scatterlng
namely
these
at
to the incident
=〇
くぎpansion
The
Fig・ 2・4・ shows
frequencies,
radiation
corresponds
the other
The
additional
Maximum
Maximum
Bond
frequency・
distinct
three
therefわre inelastic scatterlng
are
Whereas
elastic scattering・
inelastic
called
created
(Rayleigh),while
it is elastic scattering
is called
frequencies
moments
a). +a)vlb
and
,
fabrication and characterization
incident
the
( a)o)of
light is scattered
the
device
and
be
hence
non-zero・
to
referred
a
be
to
particular
●the necessary
Chapter
ⅠⅠ:
Growl九device
-
fabrication and characterization
0
-Q.
Fig・
2・6・
Polarizability
A-B
of
as
+Q.
function
of
diatomic
molecule
a
displacement
vibrational
about
equi 1ibrium
For
let
example,
vibrational
displacement
expansion,
the electrons
separation
from
length・
atom
the other
In contrast,
when
us
consider
(〕。as
are
a
in
shown
readily displaced
more
Hence
atom・
AIB
atom's
relative
about
position
the
the
electron
cloud
fわrminimum
by
incident
an
position
(at dQ
-
24
are
is
A-B
is increased
is at
maximum
therefore
length・
not
depend
that the value
hence
the
a
as
agitated
will
bond
from
It is apparent
electric丘eld
non-zero,
to the greater
for maximum
the electrons
the Fig・2・6
0)
maximum
electric field due
an
bond
It is apparent丘om
of the atoms・
equilibrium
and
the
with
When
compression,
nucleus
Therefわre, the polarizability is reduced
agltate
by
the polarizability
is at maximum
feel the effects of the other
ability to
Fig.2.5.
the
A-B,
or
given
much.
that the
on
∂
fundamental
the
ter
-
device fabrication and characterization
1Ⅰ:Growth
of the
vibrational mode
2.2.4 Atomic
The
Force
Microscope
atcmic
force
tunneling
scanning
much
in
common
used
to
scan
three-dimensional
that is used
surface,
images.
to
lead to
into proximity
a
defkction
scanthe
of
or也e
a
is
(AFM)
(STM)andthe
the
sense
AFM
Ramanactive
a'o
and
would
a'. +
a'vib
-
,and
a'vib
・
variations
specimen
surface.
curvature
surface,
cantilever
a
of
onthe
of
the
The
a
has
both
generate
(probe)
tip
sharp
SP
are
and
sample,
cantilever
SP
in血e
stylus
cantileverwith
is typically
the tip
the tip andthe
sample
at
or
silicon
order ofnanometers・When
force between
IS
surface
Hookeヲs law・
to
according
(SP)・ The
profilometer
and也e
of the
of the principles
combination
stylus
consists
sample
a
tip in the STM
The
tip radiusof
silicon nitridewitha
brought
The
frequencies
two
the
be
would
[26]
STM.
wi他山e
the
at
microscope
microscope
AIB
molecule
inelastically scattered light
generate
its end
diatomic
Detector
Last.r
Fig. 2.7. Schematic
Along
with
representation of
the force, additionalquantities
may
25
an
AFM
slmultaneously
setup
be measured
through
the
Chapter
use
-
II: Growth
device fabrication and characterization
types
of specialized
from
spot reflected
2・7 shows
contact
the top surface
the typlCal
depending
the
on
mode
setup
is prone
deflection
quite
to
done
does
cantilever
not
few
the
contact
1
extends
the surface
This
above
decrease
a
maintains
tip-to-sample
allows
10
to
nm
in the
constant
excess
to
decrease
or
amplitude
the
a
sample,
with
distance
image
be
can
at
oscillated
is typlCally
forces,
are
which
fわrce which
range
of the
feedback
by
the
the tip of the
is instead
the
static
is almost
of oscillation
frequency
topographic
AFM
frequency
resonance
force
mode,
long
s
boost
to
attractive
other
mode,
of
used
der waals
any
into
In contact
static mode
van
tip-to-sample
to construct
are
cantilever
combined
divided
the measurement
the amplitude
the
Figure
of modes,
are
In non-contact
or
number
is vibrated.
Thus
The
the su血ce
frequency
Measuring
SO氏ware
creation
electrons
above
acts
2・2・5 Electroluminescence
of the
a
modes
cantilevers
[26].The
picometers
oscillation
the scannlng
The
where
nm
imaglng
surface.
Just above
resonant
distance・
to the
surface.
to a few
strongest丘om
surface
sample
or
down
nanometers
stiffness
in
laser
a
uslng
of photodiodes・
be operated
can
the fわrce is repulsive・
where
array
signal. Because
low
the
is measured
an
the cantilever
feedback
to
close
either its resonant丘equency
a
a
the tip to "snap-in"
in contact
into
possible
where
driR,
and
However,
slgnal・
strong, causlng
always
as
AFM
general,
mode
is used
noise
The
In
non-contact
and
the deflection
of the cantilever
ofAFM.
application.
the static tip deflection
slgnal
Typically,
of probes・
cantilever・
loop
system
adjustlng the
average
at
(Ⅹ,y)data
each
of the sample
point
surface・
spectroscopy
excess
of
electron-hole
holes
and
recombination
process
light emission
is referred
may
recombine,
palrS
and
result in the emission
to
as
luminescence・
26
in
of
by
direct
a
absorption. Eventually,
pboton
photon・
band
The
Electroluminescence
gap
materials
general
is the
the
property
of
process
of
chapter
ll: Growth
-
generating
device
emission
photon
electric current
fabrication and Characterization
by
caused
injectionelectroluminescence,
The
light
diode
phenomenon・
In these
directly
photon
lntO
is
a
diagnosis
sound
distribution
design,
mesa
diced
schematic
2.3.1
versus
diode
fわrm
a
are
a
of
by
created
both
probe
p-n JunCtion・
COnVerted
ionization
EL
this
of
1S
current,
the localized
an
of
concemed
example
lmpaCt
can
spectroscopy
and
the
energy
Si substrate
fわr the
pleCe
olmic
with
HEMT
various
process
in to five major
device passivation,
On
fabrication
transistor
is classified
that involves
representation
to
across
electroluminescence・
called
ionization
mobility
grown
small
holes
and
result
will be mainly
injectlngCarriers
in the
energy,
a
bias conditions.
etching,
into
[27-30]・We
laser
is
carriers
excess
of
Junction
tO the so
rlSe
of HEMT
epIStruCture
and
Electron
of impact
fabrication
AIGaN/GaN
taken
glVlng
p-n
electric
highelectron
The
structure
the
and
energy・
of carriers
2.3 AIGaN/GaN
the result of
devices
radiatively,
recombine
excitation
applied electric filed
an
with
emitting
the
when
stages
divisions
contact,
gate metallization・
buffer
various
process・
and
The
in the HEMT
particularly
thicknesses
Fig・
2・8・
shows
were
the
process・
Photolithography
photolithography
surface
a
of
is the process
The
silicon wafer・
+
Surface
preparation
◆
Coating
(Spin casting)
◆
Pre-bake
(So氏bake)
◆
Alignment/
◆
Development
◆
Post-
bake
of transferring
steps involved
geometric
shapes
in the photolithographic
(wafer cleaning)
Exposure
(Hard bake)
27
on
a
process
mask
are
to the
Chapter
◆
Post
2.3.1.1
process
cleaning
Surface
The
as
as
well
organic
any
traces
uslng
de-ionized
with
dirt and
unwanted
2.3.1.2
Photoresist
A
water
the
and
a
humidity
case,
to
Further,
control,
types
and
light wherever
impact
were
samples
all the
remove
Will
and
and
the underlying
was
the samples
were
negative.
material
The
In positive
at
control,
high
is
speed
and
large number
a
and
speeds
of the
PR
uniformlty,
where
spln
The
a
uniform1ty
control.
times,
and
dispensed,
resist
role in the resist thickness
as
such
slgnificant
applied
uslng
baked
in dry
a
Spln
oven
In these
temperature,
exhaust,
effects
resist, the PR
is to be removed.
28
tumtable
volume
important
an
o洗en have
photoresist
COatlng.
dispense,
controlled
well
of spln
thickness
dynamic
play
a
specific,
in this process,
PR
Speeds.
Cleanliness
a
on
of the spln Operation,
aspects
cleanlng,
done
spln
a
at
Of thickness
on
or
the substrate
splnner
positive
the
of
practical
Carefully
of PR:
cleanlng
process
spun
attention
much
static dispen?e
each
(PR)
requlrement
slgnificant
of the resist, and
Was
This
these
in
of the process.
simple
is then
Stringent
between
choice
a氏er organic
coatlng
Then
cleanlng
immersed
was
sample
each.
N2.
photoresist
which
to be glVen
have
can
unifbmity.
two
has
accelerations
properties
of
wafer/sample,
denslty
is
Initially organic
The
on
by blowlng
by the seemlngly
low
of parameters
bath.
water
fわr 5 min
dried
uniformcoating
the desired film.
There
hot
and
impurities.
metallic
the surface
on
matter
particulate
coating
producing
defect
and
propanal
and
to remove
particle that affects the quality
thin,
onto
poured
bath
and
is accomplished
thickness
10nlC,
of organlC,
acetone
Cleanlng
cleaned
chemically
ultrasonic
solvents
rinsed
are
●
Wafer
or
prepa_ration
wafers
done
were
device fabrication and characterization
II: Growth
-
on
the PR.
The
COater.
at 90
is exposed
In
spln
oC・ There
with
resists, exposure
our
are
the UV
to the
chapter
uv
light changes
the
developer・
1eavlng
the chemical
The
The
of the resist
structure
resist is then
exposed
of the bare
Windows
removed".
on
device fabrication and characterization
1I: Growth,
-
therefわre, contains
mask,
exact
an
by
away
washed
In other
material・
underlying
that it becomes
so
copy
the
words,
orthe
more
in
soluble
developer
solution,
"whatever
exposed,
pattem
is to remain
which
the wafer.
resist behave
Negative
the
causes
negative
negative
developer
solution
photoresist
therefore,
2.3.1.3
Soft-bake
A鮎r
The
Reducing
By
time・
with
polymerized
and
su血ce
exposed
the UV
to
difficult
more
Masks
portions・
and
for
used
light
dissolve・
to
it is exposed,
wherever
the
negative
be transferred・
of the patternto
the resulting丘1m
coating,
Exposure
process
drying
Of the solvent
maJOrlty
The
after spln
20
40
%
by
removlng
this
Properties
of the film
-
coat
is to stabilize the changlng
content
the PR,
will contain
the photoresist
the solvent
temperature・
at room
stable
Pre-bake
baking
manner・
the inverse
contains
involves
the
only
opposite
the
on
remains
removes
or
PR
so允-bake
solvent・
resist
just the
become
to
resist
Therefわre,
in
is removed
Of solvent
removlng
from
by
the film
and
PR
a
weight
film
solvent・
excess
becomes
four
glVe
major
effects.
1.
Film
2.
Post-exposure
3.
adhesion
4.
film becomes
thickness
Typically
the PR
bake
development
and
is improved,
pre-bake
fllm,
processlng・
is reduced
There
are
and
soft-bake
sufficiently
changed
and
less tacky
or
are
properties
small
several
thus
less susceptible to particulate
process
to
keep
methods
leave
film
the
that
between
can
29
stable
be used
contamination
3 to 8 percent
during
to bake
residual
subsequent
PR・
The
solvent
lithographic
most
obvious
in
Chapter
-+II:
is an
method
2・3・1・4
alignment
One
film
metal
transferred
previous
A
mask
on
one
intenslty
exposure
important
most
or
Once
the
a
square
is aligned
mask
Each
surface・
mask
has
mask
been
glass
photolithography
plate
after the first
through
a
with
the wafer,
with
accurately
is exposed
the photoresist
in the
steps
is
photomask
side・ The
ultraviolet
patterned
emulsion
of
that the patterncan
so
one
must
aligned
the pattem
is mask
process
with
be aligned
to
the
the patternon
the mask
on
be
the
a
with
high
light・
Development
The
the PR
must
last steps in the photolithogr叩hic
process
be developed・
bases
the photoresist・
The
process・
extent
and
the wafer
onto
surface,
2.3.1.5
the
of
pattern・
wafers
fabrication and characterization
bake.
oven
Mask
aligrment・
device
Growth
No-ally
Development
is undoubtedly
of the
characteristics
the shape
aqueous
of the photoresist
one
resist developer
profile and
more
are
are
of the
development・
used
as
a
most
developer
critical steps
interactions
importantly
Once
dete-in°
the linewidth
exposed,
to remove
in the PR
to
a
large
control.
2.3.1.伝 Post-bake
The
the harsh
post-bake
environments
is used
to
harden
of implantation
the丘nal
or
etching・
30
resist image
so
that it will withstand
chapter
device
Il: Growth,
-
2.4 Fabrication
process
2.4.1 Mesa-isolation
fabrication and characterizatiop
procedure
etching
lnitially the samples
in
soaking
deionized
with
the
90oC
in
dry
a
light
developer
suitable
immediately
watts,
reflection
duration
Device
by
which
was
holder
inside
out
carried
conditions:
200
removes
approximately
The
sccm・
Then
10
=
etching
GaN
until the underlying
nm
the
based
BC13
3 Pa, power
10
-
rate
OPtlmal
uslng
by
-
at
set up
fわr 30 min・
chamber
pressure
0, and BC13flow
-
one
samples
at 90 oC
a
by
subjectlng
exposed
done
baked
then
one
coated
tO
aligner
the
was
post-bake
then
are
mask
developlng
the fわllowing
under
the mesa-isolation,
done
for depositing
deposited
deposition
vacuum
uslng
unifわrmly
and
the
with
passivation
Was
cleanlng
siO2
min,
aligned
coater
spin
samples
rinsing
layer is reached.
A鮎r
set up
(RIE)
etching
of the sample
30
was
buffer
2.4.2
(plasma)
ion etching
reactive
cooled
(MF3 19).The
solution
dry
area
a
using
and
is followed
This
exposure・
(S1800)
by
then
were
2-proponal
and
is fわllowed
samples
cleaned
the baked
the isolation
under
The
(45 cycles/min)by
vibration
(CH3COCH3)
This
each・
solution
fわr 20 min・
oven
N2・
uslng
polymer
photoresist
approprlately
uv
dried
and
ultrasonic
acetone
namely
fわr 5 min
consecutively
water
cleaned under
solvents
organic
(cH3)2CHOH,
are
was
was
for 1 min・
SiO2
in the order
of6
The
uSlng
100
carried
organic
nm
out
-
electron
at a
at an
9
x
was
sample
beam
then
substrate
evaporation
rate
in order
31
loaded
agaln
into
temperature
o川・4
attain
a
and
0・6
-
a
of
A/sec,
HCI
additionally
chamber
evapor?tion
teclmique・
evaporation
constant
10-03 pascal
done
Was
cleanlng
The
150
with
uniformpassivation
thickness
oC・
The
of
SiO2
the chamber
film・
ter
1Ⅰ:Growth
-
device
fabrication and characterization
Gate
meta]1ialion
(Pd/ Ti/ All)
聯∴.,l}.,_巨匪
Samples
Alter l他ography
in RIB
etched
uslng
gate mask
P血otoresi5t remOV(∋d
chanber
All
Tl/ A】/ N〟
20/ 72/ 12/ 40
Atier
Photoresist
before
applied
USIT)i Source-drain
dram
lithography
SOurCe-
uslng
left ollt PR
with
mask
mask.
nm
r一丁こ・、i ;;ど -・、TTl
iiL・・且
∴Lと
Fig・ 2・8・ The
2・4・3
0hmic
metal
T血ese
aligrLment
post bake
+
then
Al/
the
out
has been
-
15/
samples
were
-40
are
camied
ml)
PaSSivation
loading也e
12/
40
HEMT
process
alloying
into metallization
72/
ofAIGaN/GaN
once
photolithography
'NH4F
befわre
loaded
same
etching
SiO2
remove
and
paSSivated
14 ml
-
ca汀ied
Ni/ Au
SiO2
has done, wet
etchand
were
contact
followlng
CH3COOH
to
detailedflowchart
nm)
agaln
procedure
out
as
mentioned
using buffered HF
until foranoptimumtime
in the
olmic
samples
into
chamber
consecutively
32
region
alone・
for depositing
to 30
Again
optimal
ARer
(HF
-
2 ml
see)ino,de,
HCI
chamber・
Ohmic
mask
above.
solution
(15
metallization
under
f♭r ohmic
prepared
cleaning
The
sample
metalstack
pressure.
once
(Ti/
the
Chapter
Il: Growth
-
has
evaporation
device
been
Rapid
thermal
of
ohmic
hardening,
and
recoverlng
samples
is 850
Again
gate
oC・
until the
samples
ARer
gate
finger
HCI
cleanlng・
1 min
cleanlng
into
・the metallization
2.5 Basic
The
device
gate
annealing
amealing
was
main
(Wg),
another
formation,
The
parameters,
40/ 20/ 60
-
basic
some
in this section.
length
gate
to
proportional
frequency
A
good
are
and
then
uslng
buffer
contact
etchant
after HCI
immediately
gate
fわr
process丘nally
metal
The
stack・
nm・
important
terms,
basic
The
(Lg),source
the
gate
to
width・
limits of the device・
gate
devices
loaded
fわr depositing
chamber
etched
Was
were
samples
width
devices
are
fわr evaluation
geometrical
drain
Dimension
width
photolithography
SiO2
the
directly
small
seconds
is reached・
temperature
drain
relatively
fわr 30
out
by the earlier
fわr GaN-on-silicon
temperature
ca血ed
the
radiation
alloying,
of the devices damaged
(Lsg),and gate-dr;indistance (Lgd).The
maximal
metal
-
for
samples
characterization
will be described
width
contact
The
through
Pd/ Ti/Au
are
used
device
drain
room
went
by
stacks
source
these
on
out
carried
pattemed
the sample・
on
pads
underlying
metallization
followed
gate metal
The
these
contacts・
was
process・
gradually
gate
(RTA)
the
remove
contact
the electrical properties
etching
2.4.4 Schottky
i.e
to
and drain
source
contact
assisted
to cool
allowed
the
annealing
formation
substrate
lift-off is done
completed
thereby defining
photoresist
plasma
fabrication and characterization
flowing
utilized
Lg
device
throughthe
current,
fわr power
low
noise
applications,
are
distance
is critical in determinlng
for low
and
of HEMTs
(Lsd),gate-source
spacing
current
Therefore
parameters
of HEMT
is
the
application
large
gate
used.
power
device
is that which
allows
33
switching
as
large current
as
possible,
Chapter
on
and
-
II: Growth,
fleld limited
2DEG
A
HEMT
on
voltage
to
hence
the
essentially
ns・
current-
Si substrate
is shown
reglOnS:
linear reg10n
Nonllinear
constant
Fig・ 2・9・ Illustration
gate
and
region
in Fig・ 2・8・ The
Where
and
polntS
high
divide
the drain
voltage
reg10n
available
due
to
the
Vsat product.
ns・
carrier
mobility
I-V
34
curves
large
but
The
as
a
system・
of
is plotted
the output
is small
Where
an
AIGaN/GaN
agalnSt
the drain
characteristics
and
of microwave
into
ID is proportional
the
current
remains
ofVD.
On
from
limited
veloclty
characteristic
drain current
saturation
the
in the GaN
can
the
is independent
of operation
We
voltages・
than
and
(I-りoutput
voltage
HEMTs
is not
current
denslty
field present
current
based
important
more
carrier
polarization
DC
fixed
high
drain
the maximumoutput
maximum
In GaN
the maximum
is
to obtain
possible;
to sustain
is desired・
LI Product
the
of the strong
for various
main
VD;
the
provides
typical
Therefore
swlng
resistance,
as
resistance
resistance.
voltage
access
channel
consequence
three
the
and
of the
values
large load
aS
this load
device
the
across
ofrlng
across
power
device fabrication and characterization
power
amplifiers
Chat)ter
device
II: Growth.
-
The
(Vknee)and
drain
onset
the
saturation
devices
more
large power
high
IDmax,
output
Threshold
device
voltage
by totally depleting
Vth -VFIB
The
drain
ID
[mA/mm].
the
As
is
the
corresponding
in the Fig・ 2・8・ In such
are
voltage
in
and
VDsat is shown
-
and explain
the
be measured
to
available
the breakdownvoltage
in class-A
can
operation.
-
the
gate
source
the 2DEG
voltage
to
necessary
mobile
by the transconductance
(2.7)
flow
gm deflneS
in the
current
carriers.
Cox
the current
the
stop
J2gsqNA∼
+
+2vB
(2.6)
channel丘om
ability of the gate to modulate
expressed
high
current
voltage
(IDmax).The
it is given
saturation
ofIDsat
Vknee, and
is maximum
so
knee
to as
(VBV.OHVhee )
-
(nth) is
the
and
power
IDmax
Pout
locus
densities
The
capaclty・
The
Wg,
width
both
is referred
reg10n
density
current
channel
negative,
current
the maximum
estimate
to
decrease・
voltage
both
drain
proportional
bias becomes
gate
in the non-linear
voltage
corresponding
depicted
typically
fabrication and characterization
between
the
source
and
the drain
is
aS
aIDsat
g∽
2.6 Stress
test
∂㌦∫。∫
methodology
ln this thesis,
on
Si
substrate・
temperature,
parameter
(2.8)
=
Figure
which
of interest
either monotonically
we
have
fbcused
2・10
shows
the
shows
such
or
as
with
so
called
recovery
reliability studies
typical
some
voltage,
a
DC
on
stress
current
period
35
or
RF
to
approaches
measurement
power
in between・
AIGaN/GaN
on
stresslng
is stepped
flXed
at
in which
approach,
Stress
HEMT
in
recovery
some
the
cyclic
mode,
type
Chapter
II: Growth.
-
device
fabrication and characterization
of experiments
in which
the degradation
of the device
is fわllowed
stress
how
and
specific
stress
bias
in the recovery
phase
while
experiment,
removed
a
by
a
it recovers
recovery
from
is applied
the degradation・
in the
the device
is pe血rmed
period
stress
phase,
to
study
In this type
this
and
of
is
stress
is characterized.
く+■
i}
■ヽ
l・・・・・■
>^
Stress time
Stress time
く+■
i■
■ヽ
ト・・{
>R
Stress time
Fig・
2・10・
devices・
electronic
and
Examples
of
The
typical
time-dependence
is varied
parameter
of
with
time
stresslng
with
protocols
voltage,
current,
fわr IIトV
RF
power
others.
In stepIStreSS
current
is stepped
device・
From
the strength
experiment,
up with
inteⅣal
the regular
this measurement,
a
great
of the stress
of smaller
insight
36
parameter
value
into physical
to larger
either voltage
value
degradation
in
a
or
slngle
mechanism
Chal)ter
be
can
can
available namely;
be
also
Under
measurement・
fabrication and characterizatiorl
Combining
addressed.
experiments
power
device
II: Growth
-
this
the
In
studied・
bias
this
thesis
we
are
bias stress,
step
stress
recovery
on
step-stress
stress
condition
focus
mainly
there
On-state
stress,
the
method
measurement
step-stress
Off-state
two
above
various
0 state, and
VD-st,ess
-
high
state・
VDS-0
Fig・ 2・11・ Stress bias polntS:
The
more
severe
state,
we
wherein
shown
power
way・
By
can
study
negative
of the device
are
high
ONIState,
state
is used
investigating
where
gate voltage
simultaneously
high
the
the both
a
ends
stressful
is applied・
with
the RF
on
study
most
low
state,
power
OFF-state,
power
current
in Fig. 2.ll.
37
but
a
high
line, ON
Also,
occurs・
In this condition,
VDS
amplifying
of the load
point
and
we
can
voltage・
operation
state
and
in
a
OFF
0
state,
the both
sides
VDISt,eSS
stress
0 state・
=
All these
=
conditions
Chapter
II: Growth,
-
device fabrication and characterization
2.7 Summary
In this chapter
characterization
characterization
we
have
discussed
The
teclmique・
tec血ique
were
in detail
device
on
the
growth
fabrication
also discussed
introduced.
38
and丘nally
technology
process
stress
and
and
test
its various
basic
methodology
device
was
Chapter
II: Growth
-
device fabrication and characterization
References
・
[1] H.
M.
[2] R.
J. Molnar,
∫.Cryst.
Manasevit:
W.
Gotz,
Growth,
13/14,
(1972) 306.
L. T. Romano,and
N.
M.
J・ Crystal
Jolmson:
Growth,
178
(1997) 147.
[3] R. Fornah,
Material
Nakamura,
[7] S.
Strite and
A.
B79
"ⅠⅠⅠ-VSemiconductor
Willander,
Attolini,
C.
Ferrari,
C.
Pelosi,and
Salviati:
159.
(2001)
Materials
R.
North-Holand,
Devices=
and
J. Narayan,and
[9] M.
Kamp.
Growth,
A.
Hommel,
P.
M.
Res.
M.
Ng,
Mayer,
2 art. 26
D.
189/190
VanOverstraeten:
1989・
J・ Appl・
Phys・
87
Seno:
Appl.
Phys.
Sci. Teclmol.
S.
Laukkanen,
M.
Pessa:
A.
Pelzmann,and
BIO
Lett. 58
S.
Stat. Sol.
K.
2021・
(1992) 1237・
Lehkonen,
Phys.
(1991)
Laaksonen・
J・ Dekker,
A・
(a)176 (1999) 465.
J. Ebeling:
MRS
Internet
J Nitride
(1997).
Doppalapudi,
D.
良. Singh,
Korakakis,
T. D.
Moustakas:
J・ Crystal
(1998) 349.
Krtschil,
H.
Witte,
A. Wenzel,and
[12] H.Amano,
M.
J. Vac.
H. Morkoc:
P. Uusimaa,and
Semicond.
[10] H.
Y. Harada,and
Rinta-Moykky,
Tukiainen,
[11]
G
965.
[6] S.
[8]
N.Amani,
Engineering
S. C. Jian, M.
(2000)
163
Bosi,
Scienceand
[4]良. ∫.Malik:
[5]
M.
M.
Lisker,
J. Christen,
B. Rauschenbach:
I. Akasaki,
K. Hiramatsu,
Phys.
N.
A.
Krost,
Stat. Sol.
Koide,and
U・
S・ Einfeldt,
Brikle,
(b)216 (1999)
N.
Sawaki:
Thin
D・
587.
Solid
Films,
(1986)
353・
(1988) 415.
[13]H.Amano,
[14] S.
Nakamura:
[15] H.
Liu, A.
N.
Sawaki,
I. Akasaki,and
Jpn. ∫.Appl.
G. Thompson,
Phys.
30
C. S. Chern,
Y. Toyoda:
(1991)
Appl.
Lett・ 48
1620.
P. A. Zwadzki,
39
Phys.
W.
J. Kroll,
R・ A・ Stall, C・ Y・
Chapter
-
Hwang,
II: Growth.
W
and
device fabrication and characterization
E・ Mayo:
Fall Meetlng
Electrochemical
Ofthe
Society,
Miami,
Fl, Oct.
9-14,1995.
[16]R・
D・ Dupuis:
[17]A・
W
Electron.
[18]
J. Crystal
Wickenden,
Mater.
24
S・ Kim,
[20]S・
Nakamura,
[21]W
L. B. Rowland,
T・ Mukai,
G・ M・
M・
Senoh,
L. Bragg:
Joumal
[23]N・
B・ Colthup,
Daly,
L. H.
Spectroscopy,
Third
Edition
[24]DerekA・
Long:
The
Physics,
John
[26]
[27]A・
Springer-Verlag,
Sylvestre,
Y・ Jin, and
Rev.
J・ P・ Praseuth:
Niwa,
Y・ 0lmo,
J・Appl.
Phys.
37
and
∫.A. Freitas: ∫.
Jpn. ∫.Appl.
良. Soc.
A88
2
S. E. Wiberley:
Press,
(11・992)87.
43
30
(1999) 1807.
(1991) 1708.
(1913)428.
(1879).
to Infrared
and
Raman
1 990.
Spectroscopy
&
Sons,
of Gases
and
New
York,
Liquids,
2002.
in Current
Topics
1 979・
75
P. Boucaud,
J. ofAppl.
Phys.
Introduction
Effect, JolmWiley
Berlin,
31
(2003) 949.
F. H. Julien, P. Crozat,
Phys.
S・ Kishimoto,
80
A. De
Lustrac,
良. Adde,
(1996) 464.
T・ Mizutani,
H.
Yamazaki,
and
T. Taniguchi:
Jpn.
(1998) 1343.
[29] H・
P・ Zappe
[30] G・
Meneghesso,
and
and
Phys.
State Electronics,
of Mathematics,
ofModernPhys..
F. Aniel,
[28]H・
Meneghini,
Raman
Sold
InProc.
Academic
(Editor):Raman
F・ J・ Giessibl:
D. K. Gaskill,
Jpn. J. Appl.
T・ Mukai:
and
H・ Hall: American
Senoh:
H・ J・ Lee:
and
[22] E・
Weber
(1997) 56.
K. Doverspike.
M・
and
Yang,
H・ BraggandW
[25] A・
178
(1995) 1547.
S・ Nakamura,
[19]K・
Growth,
and
D・ J・ As: Appl.
G・ Verzellesi,
E・ Zanoni
:
IEEE
Phys.
Lett. 59
F・ Danesin,
Trans.
on
Dev.
40
(1991) 2257.
F. Rampazzo,
and
Mat.
F. Zanon,
Reliab. 8
A.
Tazzoli,
(2008) 332.
M.
III:
Chapter
Thicknesses
Reliability Studies
■
Chapter-III:
Different
Si
on
Different
with
■■■
Reliability
Buffer
HEMTs
AIGaN/GaN
on
Buffer
_
Studies
HEMTs
AIGaN/GaN
on
Siwith
on
Thicknesses
3.1 Introduction
Material
application
GaN
of
and
electric field and/or
of the
given
leakage
gate
much
field
electric
in the
heteroJunCtion
widely
AIGaN/GaN
current
tool
in
would
degrade,
to
localized
AIGaN/GaN
and
the
exist beyond
a
[8, 14, 15-16]. In
Si with
on
formation.
and
different
of the
in the
gate
be
very
degradation
evaluating
this chapter,
reliability studies
buffer
the
It is
contact
can
microscopy
been
AIGaN/GaN
increase
permanent
has
where
in the
the gate
which
effects
increase
stress
defect
at
operating
mechanism,
strain
Electroluminescence
breakdown
HEMTs
a
power
the sudden
crystallographic
showlng
on
electrical
[7] proposed
RF
and
mechanisms
during
increase
does
is irreversible・
detectlng
on
out
thickness
were
their
and
discussed.
were
results
reglOn
in off-state bias stress
mechanisms
carried
del Alamo
Strain relaxation
begins
which
HEMTs
and
power
[4-5].Recently,
industrial
fわr the
polntS
high
degradation
temperature
that the critical voltage
HEMT
useful
gate-drain
ln
demonstrated
AIGaN/GaN
on
key
the
are
various
charmel
[6-14]・Job
resulting
accepted
leakage
high
current
attention
have
that
subjectedto
are
lSSueS
reliability
HEMTs
[1-3],but
performance
high
quality
3.2 Experiment
The
thickness
(TGaN)
metal-organic
was
layer
thermally
of
100
heterostructure
AIGaN/GaN
were
chemical
cleaned
nm
AIN,
on
grown
vapor
at
a
with
4"
deposition
oC
1100
followed
different
(111)
p-Si
(MOCVD)
in H2flow・
The
by
of
40
nm
41
buffer
substrate
system
growth
AIGaN.
(TBuf)and
thickness
using
(SR 4000).
started
To
with
understand
GaN
horizontal
a
The
substrate
the nucleation
the
device
1II: ReliabilityStudies
chapter
Thicknesses
degradation,
waferwith
were
The
grown・
25 nm-thick
a
high
at
Figure
3・ I shows
and GaN
Fig.
intentionally doped
that
3.1. Cross-sectional
thicknesses keeping
process
temperature
All the metals
at
metals
Pd/Ti/Au
metals
evaporated
is varied
and
2・5, 4・0, and 5・O
O・5 to l・5 pm
our
free
final
layers
from
were
cracks・
different buffer
Si with
on
LLm)
and
All these
were
HEMTs
studies.
SiO2
paSSivated
remaining
kept
of the
from
samples
andthese
of AIGaN/GaN
startedwith
HEMTi
AIGaN/GaN
constantand
(b)
Si
on
varying
oC・
150
followed
Ohmic
by the filaJnent
were
deposited
heating
by
contacts
by lamp
(40/20/60 nm)
exceptAlwere
isolation by BC13-based
mesa
deposited
passivatedwithSiO2
(20/72/12/40 nm)
Gate
view
・25,
Buffer
(a)
GaN
the
the rest constant・
device
etchingand
substrate
oC,
used in
were
varied
1
-
Different
with
flXed foral1 the samples・
1130
of
Si
on
(TBuf
thickness
were
the device structure
thicknesses
The
GaN
top layers
temperature
buffer layer thickness
ion
different buffer thicknesses
Alo.26Gao.74N
grown
HEMTs
onAlGaN/GaN
annealing
formedusing
by electron
technique・
42
The
beam
electron
were
plasma
reactive
with
evaporation
patternedwithTi/A打Ni/Au
at 850
oC
for 30
s
in N2ambient・
conventionalphotolithography・
beamevaporation,
AIGaN/GaN
HEMTs
whereas
with
AI
was
device
chapter
III:
-
Studies
Reliability
HEMTs
AIGaN/GaN
on
Si
on
Different
with
Buffer
Thicknesses+
dimensions
of
-
process
unless
kept
60
Si
(TGaN
width
at
was
1.0
-
our
buffer
kept
were
1・5
-
were
LIm,
source-drain
for this study・
used
the same血oughout
our
study
we
have
Initially
and
we
-
The
out.
out
two
chose
5 to 45 V
1 V
with
from
values
5.0トLm)
temperature
at room
different
the stress
shows
there
buffer
were
diffraction
XIRay
thickness
measurement
with
The
interval of
time
GaN
Van
samples
-
the above
on
thickness
calculated
i・e・ TBuf
drain
HEMTs
with
and
these
on
a
AIGaN/GaN
densities
(VGS) was
voltage・
step for
on
study
dislocation
out
carried
device血eshold
the
1.25, 2.5, 4.0 and
(TBuf
(FWHM)
carried
from
bias voltage
the gate-source
Initially the comparison
out.
carried
were
below
available,
measurements
testing, where
increased
thickness
were
pm)
study
-
step-stress
is well
which
carried
measurements
for
V
-10
at half maximum
Table・3・1・
(Lg)
4・O pm
(Lgd)
spacing
different
was
(VD_st,ess)
different
on
length
gate
parameters
bias stress
OFF-state
voltage
seconds
device
several
constant
stress
Llm,
particularly・
Though
an
200
-
gate-drain
and
condition
mentioned
employed
(Wg)
width
9.5 Ltm, and
(Lsd)
spacing
The
gate
full
using
der pauw
and
1・25
Hall
reported
in
and
5・0トLm,
mentioned
stress
conditions.
3.3 Results
and
The
Also,
shows
figure
in drain
increase
discussion
resistance
gm_peak Shows
no
3・2
slgnificant
a
steady
change
(RD).The
decrease
with
is
a
continuous
sub-threshold
the
with
the increase
43
decrease
current
shiftin
slope
threshold
in step stress
in the
shows
voltage
voltages・
IDmax
a
With
positive
(Vth)・The
an
shift・
IGS
Chapter
m:
-
Thickne
ReliabilityStudies
on
HEMTs
AIGaN/GaN
on
SiwithDifferent
Buffer
s ses
100
I 0-Ol
≡
看10
月60
3
<
∈
140
02
10-03
I:
∈
10-04
Gnu
-守
10
05
1 0'06
0
2
4
(I
VDS
8
10
12
-6
-2
0
2
(V)
盲1
0
読1
05
≡
!10107
孟
-普
-6
3.2.
condition
of
VGS
(V)
≡
≡
Fig.
-4
1 min.
-4
in
Change
was
The
characteristics
VGS
2
-6
(V)
device
shownat
(a)
0
-2
characteristics
at
each
Vb_st,essニー10V; VD_5t,eSS
output
and (d) gate
-
characteristics,
current
-4
step
the
5 to 45 V; step
(b) sub-threshold
characteristics for TBuf
44
in
VGS
-
12
(V)
off-state
-
stress
l V and time
period
(c)
transfer
characteristics,
1.25トLm
bias
devices.
Chapter
Thickne
111:
-
Reljability Studies
HEMTs
AIGaN/GaN
on
on
Siwith
Different
Buffer
sses
100
I 0-Ol
i`,円
≡
≡
才10
<
02
≡ 80
署lo-03
a
v,u
t:
■・「
1 0-04
40
1 0-05
10106
0
2
4
6
8
10
12
γ♭s(V)
16
-4
-6
-4
VGS
-2
0
2
0
2
(V)
∈30
こ′:
与20
∈
bc
-4
Fig.
The
(a)
output
characteristics
and
(d)
thick
The
There
and
3.3.
VGS
buffer
(TBuf
-
0
-2
(V)
characteristics,
gate
3.3 shows,
there
is
change
observed
IGS doesn't
TBuf thickness
current
(b)
sub-threshold
characteristics
VGS
12
(V)
characteristics,
f♭r AIGaN/GaN
HEMTs
(c)
transfer
on
Si with
5.0トLm) devices.
figure
no
2
showany
is
a
small
increase
in gm-peakand
a
IDmax With
negligible
7(th Shift, sub-threshold
either. This
significant changes
the device shows
inthe
degradation.
negligible
45
likely show
drain
on
change
in RD・
current
increasing
slope
the
Chapter
Thicknes
く⊃
-
ReliabilityStudies
III:
Buffer
E3
賢
∈
こ{
「Be
、主1.0
j
I.0
E]
91
J-I
∈
b心
j
0.5
0.5
10
0
20
Fig・ 314・ Comparison
withdifferent
3.4
RD,and
gm-peak・ The
TBuf
be noted丘om
20
30
VD_stress
40
50
HEMTs
ofAIGaN/GaN
shows
the
Change
each
increases
that
a
before
change
gm-peakand
inthe
IDmaxfrom
image
behavior.
and
is
a
present
have
in the GaN
similar behavior
HEMT
dislocation density
on
Was
Si with
high
Si
on
on
in device
thin buffer
-
for TTBuf
slope・
on
1.25 pm
46
as
-
trend
drain
current
1.25
llm. 1t is
-
It has
is due
our
LLm). Also
shown
in Table
fわr
been
be
RD
reported
a
steady
Will show
to the presence
finding
suggested
1.25
also
observed
will
the IDmaxand
as
Slope,
were
Sithere
Si substrate. From
(TBuf
transfer
cu汀ent
degradation
test and
operation
is IDmax,
compared
seen,
stress
current
stress
AIGaN/GaN
on
characteristicsand
that this behavior
HEMT
for TBuf
such
HEMT
proposed
was
in sub-threshold
no
Ofthe
that
it canbe
a洗er
sub-threshold
the beginnlng
They
As
obseⅣed
Whereas
obseⅣed.
in output
test.
stress
test
step-stress
figure of merit
etal., [12] that for AIGaN/GaN
defectthat
AIGaN/GaN
key
RD
in IDmax, RD,
S. Demirtas
The
after
3.2
of the
all results
5.0トLm.
314
in gm-peak
5・0トLm
that,there
Fig・
Fig.
steady decrease
vlrgin
1.25and
-
decreasesand
significantly
mirror
10
gm-peak degradation
over
beforeand
characteristics
decrease
0
50
RD, and
sbows也e
with
-
40
ofIDmax,
HEMTs
TBuf
30
VD_stress
bufferthickness.
Figure
a
Different
く=)
a;
ーち
Qく
by
Si with
on
I.5
ニ
to
IiEMTs
AIGaN/GaN
on
se§
to be
of
found
we
by
[12] for
noted
that, the
3・1 confirms
that it is
Reliability Studies
Chapter
Thicknesses
IIl:
the defects
that present
in the vlrgin
gm-peak for AIGaN/GaN
and
AIGaN/GaN
HEMT
influence
of
Since
did not
we
1.25and
5.0トIm
Siwith
defects
virgin
-
thickness
Table.
3.1. Halland
(TBuf
2.5and
-
45 V,
in the gate
Buffer
decreaseinIDmax,
RD,
Whereas,
in the
case
densityreveals
device
leakage
at higher
out
carried
of
that the
performance.
for TBuf
current
VD_st,essfor two
-
other
4.0トLm) devices.
data listed for AIGaN/GaN
XRD
Different
in good
results
changes
have
we
1・25トLm・
-
in dislocation
which
slgmificant
uP tO VD_stress
TBuf
reduce
reduced
Si with
on
this continuous
Si with
on
was
HEMTs
causes
thick buffer
observeany
buffer
device
HEMT
on
AIGaN/GaN
on
HEMT
grownon
different
buffer
thickness
50
1.25
1.0
776
8.72
x
1012
925
1.22Ⅹ
109
5.02x
1010
100
2.50
1.0
737
8.79
x
1012
968
1.52x
109
4.05Ⅹ
1010
160
4.00
1.0
687
7.97x
1012
1150
1.71 Ⅹ109
2.79x
1010
200
5.00
1.0
1058
6.57Ⅹ
1012
883
1.50Ⅹ
2.49Ⅹ
1010
is very
lmpOrtantly
3.3.1
Critical
The
discussed
at
a
current
and
voltage
phenomenon
(IG_Off)and
irreversible
this
during
reported
for AIGaN/GaN
AIGaN/GaN
HEMT
DC
sapphire
under
on
Sic
substrate
[12, 13]. In
one
(i) gate
current
namely,
Critical
Various
have
to 70
leakage
V
reported
to
reported
80
have
authors
between
voltage
[6, 7,17],70
[18, 19], 25
as,
(ID),increasesignificantly
conditions.
substrate
47
widely
both,
or
drain
they
and
is defined
(Vc,it)
pinch-off
case
considered
critical voltage
one
phenomenon.
HEMT
Si substrate
voltage
stress
critical voltage
on
term
(VDS) where
(ii)sub-threshold
on
on
studies. The
draiヮ-sourcevoltage
reported
HEMT
of critical voltage
in reliability
especially
specific
109
20
V
30
to
reported
V
for
for AIGaN/GaN
the Vc,it delayed
beyond
chapter
III: Reliability
Tbicknesses
100
V
on
current
electrical
different buffer thickness
withtwo
[20]・Hence,
stacks
during
HEMTs
AIGaN/GaN
on
the gate metal
changing
leakage
the gate
Studies
(TBuf
-
stress,
2.5 and
to
have
we
4・O
Si
on
obseⅣe
Different
with
Buffer
this sudden
increase
AIGaN/GaN
HEMT
selected
in
Llm).
Gi■i
≡
10
≡
i
≡ 10 -3
巴!■llコ
q)
-ど
一■■ヽ
≡
10
≡
2
I-・ー
i
≡ 10
I-
3
O
-ど
100
10
Time
Fig・ 3・5・ Increase
vD_s.一ess
at VGSニー10
vD_s(Tess
-
140 V,
(b)
in IG-∼.res
Observed
V. Sudden
TBuf-
during
increase
4.0トLm
device
(sec)
continuous
biasing
in the IG_st,esis observed
burnout
48
1000
occurs
s
of600
for
=
at VD-st,ess
for increaslng
(a) TBuf
230
V・
=
2・5 LLm at
Chapter
IIl:
-
ReliabilityStudies
HEMTs
AIGaN/GaN
on
Si with
on
Different
Buffer
Thicknesses
The
VD_st,essStarted
Each
this step voltage
changed
cases,
data
sampling
devices
grounded
4.0トtm
reported
that
unsteady
and
2.5トIm
then
failure
found
a
slow
Vc,it. For
subjected
Figure
the
occurs
increase
3.5
increase
to
in IG_stressWith
at VD_sl,ess
-
current
140
V
without
any
more
several
The
at room
stress
TBuf
become
should
increase
permanent
indication
in
of TBuf
case
in VD-st,essand
noise
In
VD-st,ess・It was
In the
the increase
obtain
VDISt,eSSfor both
Vc,it-like phenomenon・
a
s.
of gate
increaslng
[14].This
of 600
and
the behavior
with
until the
measurement.
in dark
out
leakage
stress
gate
to
V
thickness,
step-stress
increasing
with
span
buffer
shows
degradation
reflects
to
of 20
lower
much
carried
biasing
found
or
every
were
measurements
continuous
biaslng
in IG_sf,essObserved
increase
were
10 V
to
in steps
fわr a time
stressed
20
precise
in pemanent
resulting
continuous
there
a
devices. IG_st,essWas
before
IG-st,essduring
from
measurements.
during
(IG_st,ess)
current
2.5 and
-
the
increased
gradually
step voltage
wafers
and
fわr all these
temperature
leakage
different
two
was
identify
can
which
from
substrate
Vand
of critical voltage.
occurrence
fewer
at 20
a
as
-
sudden
in
shown
Fig.3.5(a).
was
This
sudden
obseⅣed
well
irreversible.
120
V.
As
transistor・
broad
such
the
increase
below
permanent
current
found
burnout
increase
of VD_stressranglng
Vc,it like phenomenon
phenomenon・
the
discu占sed later, the device
This
was
occurred
It is to be noted
140
-
the device
Moreover
distribution
device
in IG_st,essat VD_st,ess
compliance
this voltage
in IG-st,essWas
from
observed,
confirmlng
140
as
180
shown
the
that the IG-stressbecomes
49
of
the
a
increase
permanent
current
gate
3・5(b)・At
device
had
devices
-
a
with
a
4・0トIm,
VDISt,eSS
=
undergone
before
as
operate
for TBuf
in Fig・
unsteady
is
VD_st,essi.e. VD_st,ess
for all the
V. Whereas
that
which
still continues.to
Observed
to
that
is
up to the prlOr
recoverable
at
V
230
nO
V,
breakdown
this device
burn
III:
Chapter
Th icknesses
The
out
occurs.
out
mark,
not
obseⅣe
as
surface
Studies
view
AIGaN/GaN
on
increase
the sudden
bum
a
Different
with
having
out
mark
TBuf-
biasing
continuous
a
with
Buffer
the device
a氏er this confirmed
in JG_stressduring
by
Si
on
3.5(b).For devices
the inset ofFig.
shownin
HEMTs
the microscope
using
breakdownaccompanied
undergoes
230
Reliability
4.0 um,
burn
we
did
rather, this device
of VD-stressfrom
variation
to 260V
300
250
盲200
喜60
≡
毒150
王
、′、
≡
て40
b4
100
∼.A
50
-6
-4
-5
-3
VGS
-2
0
-1
(V)
1
2
16
14
-5
13
-
12
VGS
1
1
0
(V)
1 010]
10
02
1 0'03
≡
j! 10
04
<
主10-05
∼? 10-06
10'07
10
08
16
Fig.
3.6. The
voltage
We
VDS
Varied
=
observed
the transfer
measured
from
4 Vand
and
-3
-
-2
VGS
measured
1
0
1
2
(V)
after every
stepIStreSS
Offstress
bias
2.5トIm.
-
0 to
the transfer
shows
VDS
transfer characteristics
for TBuf
-4
15
10 V
characteristics
VGS
found
in steps
-
16
a
to
characteristics
of2
V
in which
measured
2 VI There
negligiblechange
a洗er every
VGS
after each
is
a
in the
50
Vth Shift
from
SWePt
off-state
small decrease
as
measurement,
step-stress
16
bias
stress
in IDmax
shownin
to 2 V, Fig.
and
Fig.
3.6
at
voltages
gm-peak
Was
3.6(a)and (b)
III:
Chapter
Thicknesses
ReliabilityStudies
__.........................._..........................-...---■・・■・・・・・----------------------------・・・・・・・・・・・・-・・--・・・・・・・・・・-・・・・・・・・・・・・・・・・・・・・・・・・・・・・・・・・・・・・・・・・・・・・・・・・・・・・・・・・・・・・・・・・・・・・・・・・・・・・・・・・・・・・・・・・・・・・・・・・・・・・・・・・・・・・・・・・・・・・・・・・・・・・・・
for TB。f
V
-5
2.5トIm.
-
termed
This
The
case.
For
TBuf
drastically
increase
with
a
■■
a
in IG_.ff, the transistor
V
is referred
140
-
less than
as
Buffer
4 V
-
VGS
and
V
was
step-stress
shown
in Fig. 3.7.
in
our
increase
observed
to
V・ After
this sudden
ideal IDS
an
show
-
entire
to a critical voltage
VDISt,eSSOf 140
measured
characteristics
the
140 V
-
after VD-st,ess
IG-off measured
for
at VD_st,ess
140
VDS
at
3.6(c)
Fig.
increase
-
with
(IG_.ff)
measured
from
IG_。ffmeaSured
Different
with
「
current
sudden
Si
on
■■■■■■■■■■■■■■■■■■■■■■■■■■■■■■■■■■■■■■■■■■■■■■■■■■■■■■■■■■■■■■■■■■■■■■■■■■■■■■■■■■■■■■■■■■■■■■■■■■■■■■■■■■■■■■■■■■■■■■■■■■■■■■■■■■■■■■■■■■■■■■■■■■■■■■■■■■■■■■■■■■■■
in the IG_.ff at VD_sI,ess
compared
pinch
■■
summarized
IG_.ffShows
2.5 pm,
-
leakage
off-gate
increase
sudden
■■■■'■■■■■■■■■■■■■■■■■■■■■■■■■■■■■■■■■■■■■■■■■■■■■■■■■■■
IG_.ff is
as
measurement.
The
■・
HEMTs
AIGaN/GaN
on
VDS
-
Curve
off voltage.
Eid
≡ 10
≡
5
亘10
6
ヒ
⊂)
l
h苧
0
50
150
100
250
200
300
VD_sf,ess(V)
Fig・ 3・7・ change
-
2・5
pm
resulting
at
because
increase
VD-sI,ess
-
in device
This
140
burnout
confirmed
of the sudden
V
no
and
-
that the
increase
limit and
-
-5
V
normal
230
a
bum
FET
at higher
out
4 V・ Vcrit
-
is observed
for TBuf
observed
were
for TBuf
4・O pm
=
V・
operation
in IG_.ff. In the
even
VDS
and
increase
abrupt
at VDIStreSS
in the IG-.ffObserved
breakdownvoltage
at VGS
inIG-.ffObserved
was
case
51
of TBuf
VD-st,ess・At
noticed・
of the device
-
4.0トIm,
230
Therefore,
V, the
was
not
is
there
device
Vc,it Was
affected
no
sudden
reaches
Observed
the
only
Chapter
IIJ:
-
Tbickne
ReliabilityStudies
HEMTs
AIGaN/GaN
on
on
Siwith
Different
Buffer
sses
for HEMTs
TJhf-
grownon
2.5トImand
not
for HEMTs
TBuf-
grownon
4.0ト【m.
3.3.2 Electroluninescence
Electroluminescence
leakage
of gate
been
i.e.,
installed
SIICCD
For
was
[21]・ In
example,
CCD
SO
in
K.,
enabled
cooled
皿,
K.
lateral
a
which
is obseⅣable
with
TBuf-
Fig1 3181 Electroluminescence
due
to
[8].
strength
has
reg10n
Of the
The
by
(SIICCD)
noise
emission
with
by 90%
of the
HEMTs
in the high-field
low
the hot ca汀ier
real-time
Hamamatsu
has
camera
characteristics
high
position
to
compared
Si-CCD
the path
canmonitor
in AIGaN/GaN
CCD
time
wavelength
we
PHMOSinstrument
sensitivityand
the detection
detectable
(a) TBuf=
(b)
the
the low-intenslty
slashes
The
field
electric
the high
that the electroluminescence
[14, 22, 23]
of hot carriers
silicon-intensified
to observe
the Si-CCD
camera.
transition
tool where
field [8, 14].EL
observeduslng
this system,
us
electric
the
to
related
electroluminescence
Photonics
strong
intraband
to the
attributed
device,
or
current
isanimportant
(EL)
ranges
a
been
of the
accuracy,
conventional
from
0.3 to
iT一tbe AIGaN/GaN
1.1
HEMT
PHEMOS.
2.5 pm
4.0 Ltm
shows
a
spottyanduniformemission
52
for TBuf
-
2.5 and
III:
Chapter
Thicknesses
4.0トIm,
feature
as
of PHEMOS
ones
packaged
During
was
the buffer
TBuf
on
shown
in Fig.
in Fig.
-
2・5トLm
high
Buffer
fbⅢned
were
as
a
Show
was
in Fig.
shown
of further
caused
The
by
large
field at the gate
for HEMTs
in the
grownon
in
spot
case
the gate-drain
a
emission
dislocation
fわllowed
density
of the drain
TBuf
-
4・0トLm,
53
(3.6 x
side
the
a
hot
new
109
resulting
leakage
luminescent
as
cm
ln
distribution
as
grown
in gate
spot
2)which
nOn
as
shown
to be
observed
HEMTs
increase
identified
were
that
3). The
was
the
4・O LLm,
=
Observed
VD-st,ess,the emission
nOn-recoverable
paths
Was
reglOn
until
with
TBuf
on
grown
Shown
Observed
Was
reg10n
also
aS
but
as
weak
biasing,
observed,
new
V,
were
reglOn,
continuous
spots
and
100
=
intenslty
at a new
during
a
of HEMTs
case
emission
ofHEMTs
3.8(b)(frames 2
1・e・,
edge
hot
4.0トtm
and
at this voltage
EL
new
2.5
-
at VD-st,ess
appear
the
of
for both
3・8. In the
obseⅣed
of 1 80 V
increased
leakage
spotty
as
condition
TBuf
on
altogether
trace
new
throughout
critical voltage,
images・
visible
no
was
further
to
increased,
and
entirely
began
spots
the critical voltage
emission
devices
the 60 frames/s
with
at off-state
in Fig.
spots
voltage
in IG_sf,ess,there
unifわrm
electric
Whereas,
Different
that on-wafer
so
grown
shown
emission
3.8(a) (frame 3).Whereas
generations
voltage
emission
stress
in IGISf,ess,an
uniform,
micro-EL
as
respectively
the
biased
was
for HEMTs
emissions
3.8(b)(frame 1).With
and
HEMT
the EL
spots
increase
and
weak
The
new
in Fig.
weak
EL
2・5 pm,
As
increase
in Fig.
The
inside,
probe
a
of the electroluminescence
movie
AIGaN/GaN
the
3.8(a) (frame 2). At
sudden
shown
Si with
on
easily・
3.8(a)(杜ame 1).The
and
the sudden
a
-
non-unifbm.
increased
a
and unifわrm,
grown
and
be measured
can
thickness.
spotty
is that it has
measurements,
while
captured
were
HEMTs
AIGaN/GaN
on
reSpeCtively・
Another
well
ReliabilityStudies
at
on
TBuf
current・
dots
in the
the
critical
increases
the
uniformemission・
of the electric
fleld is
Chapter
IIl:
-
ReliabilityStudies
HEMTs
AIGaN/GaN
on
Si withDifferent
on
Buffer
Thicknesses
believed
to be
at high
uniformeven
VD_st,ess,and this,inturn,
the
prevents
occurrence
of
critical voltage.
3.4 Summary
ln summary,
for
condition
AlGaN/GaN
different
HEMT
characteristics
The
100 V
VD_sf,ess
-
HEMT
edge
substrate
be
to
pm
due
TBuf
grownon
-
of the
biasing
continuous
drain
increaslng
to
electric field at the gate-drain
layer
reg10nand
not
Onincreaslng
burnout
the
observe
absence
54
transfer
presentinthe
device.
Vc,itWas
Observed
did not
VD_stress
-
the
230
observe
V. The
EL
throughout the
HEMTs
dispels the existence
of Vcrit.
above
this Vc,iffor AIGaN/GaN
umiformemission
that AIGaN/GaN
thickness
at
The
modes.
in10utPutand
VD_st,ess,We
occurred
weakand
side. It is believed
buffer
did
failure
reduction
shows
the off-state
under
different
the vlrgindefects
we
shows
a
shows
2.5 pm
-
4.0 LLm devices.
found
and
1.25
-
in IG_sl,ess;rather, device
during
with
is believed
TBuf
suddenincrease
gate
TBuf
measurement
step-stress
thicknesses
for all its devices.Whereas
grownon
measured
buffer
HEMT
the
studied
grownon
which
AIGaN/GaN
have
we
grownon
of
a
a
non-uniform
Si
III:
Chapter
Thicknesses
ReliabilityStudies
HEMTs
AIGaN/GaN
on
Si
on
Different
with
Buffer
References
[1] Y.
F. Wu,
S. M.
in lnt. Electron
Milligan:
[2]S. Nakajima
L. Finer:
[4] G.
Meneghesso,
[5]R.
[6]J. Joh,
[7]J. Joh
[8] G.
[9] E.
Meetlng,
E. Zanoni:
IEEE
M.
Tech.
Electron
Trans.
Device
Meneghini,
Device
[10]
J. A. del Alamo
and
[11]
∫.Job, F. Gao,
T. Palacios,
J. Joh:
2007,
and E・ Zanoni:
IEEE
Trans・
A.
Lett・ 30
Lett・ 29
p・ 385・
(2008) 287・
F. Rampazzo,
F・ Zanon,
Mater・
8
Reliab・
Cetronio,
A・
Tazzoli,
M・
(2008) 332・
C・ Lanzieri,
M・
Peroni,
and
G・
(2009) 427・
Reliab・
Microelectron.
∫.A. del Alamo:
and
pp・ 568・
Dig・, 2007,
Device
F. Danesin,
IEEE
Electron
Symp・
IEDM
G. Versellesi,
IEEE
pp・ 1-3・
G. Verzellesi,
Int. Rel. Phys.
delAlamo:
F. Danesin,
Meneghesso:
J・
and
2007
P. Kordos,
Proc.
J.A.
Meneghesso,
Zanoni,
P・ Parikh,
2007
J. A. del Alamo:
and
2006,
S・ T・ Allen,
(2006) 2932.
53
L. Xiaand
and
S. Sheppard,
WOCSDICE
F. Rampazzo,
et al., IEEE
Meneghini,
Devices
Proc. WODSDICE
Device,
CoWle
P. Smith,
et al., Proc.
[3]E.
Electron
R.
Wood,
49
(2009) 1200・
Microelectron・
Reliab・
15
(2010)
767.
S. Demirtas,
[12]
∫.Job, and
[13] D. Marcon,す.
Cheng,
IEDM
M.
Leys,
Tech.
∫.A. del Alamo:
Kauerauf,
R. Mertens,
Dig., 2010,
Meneghini,
A. Stocco,
Zanoni:
Appl.
Lett. 100
[15] 良. Gaddi,
G
D.
Medjdoub,
Decoutere,
G
J. Das,
M.
Meneghesso,
Reliab・
Van
50
Hove,
E・ Zanoni,
(2010) 758・
P.. Srivastava,
and G
K・
Borghs:
p. 472.
[14] M.
Phys.
F.
Microelectron・
Meneghesso,
M.
Bertin,
A. Chini,
G・ Meneghesso,
and
E・
033505.
(2012)
M.
D. Marcon,
Pavesi,
M.
55
Peroni,
C・ Canali,
and
E・ Zanoni:
IEEE
Chapter
Ill:
-
ReliabilityStudies
HEMTs
AIGaN/GaN
on
Si with
on
Dilrerent
Buffer
Thicknesses
Electron
Device
[16]R.
Lossy,
[17]P.
Makaram,
Lett. 20
A. Glowacki,
(2010) 233509.
[18]M.
X. Hua,
B20
[19] M.
and
M.
H. Yue:
J. Gang,
J. Ⅵng,
Chin.
F. Lo,
Laboutin,
Phys.
Status
T. Palacios,and
Y. L. Yuan,
H.
Qiang,
Solidi
C 6
Phys.
L. Lu,
Y. Cao,
M.
B20
C. V. Thompson:
J. Ying,
M.
A.
Forum,
679/680
(2011) 378.
Tanaka,
D. Ueda,
[23] E.
Zanomi,
(2012) pp.
Simozato,
M.
G
Phys.
H. Yue:
Chin.
Ping,and
Appl.
J. Gang,
Z. Kai, Z. H. Long,
B. P. Gila, S. J. Pearton,
R. Davies,
F. Ren:
ECS
Y. T. Kazushigae
Scamperle,
Meneghesso,and
M.Meneghimi,and
M.
Qiang,
Z. J. Cheng,
(2011) 127305.
J. Jolmson,and
Senzaki,
Meneghimi,
Ping, H.
T. S. Kang,
W.
(2009) 1382.
ン
[21] J.
[22] M.
J. Wdrfl:
(2011) 067304.
X. Hua,
[20] C.
C. Boit,and
J. Joh, J. A. delAlamo,
Lett. 96
Phys.
(1999) 372.
M.
Pavesi,
E. Zanomi:
G. Meneghesso
593-598.
56
Trams.
41
(2011)
Koshikawa,and
M.
Manfredi,
Appl.
Phys.
:inProc.
I. I. Kravchenko,
0.
63.
K. Fukuda:
T. Ueda,
Mater.
H.
Ishida,
Lett. 97
(2010) 033506.
9thInI.
Conf.
MIKON,
Sci.
T;
2
Chapter-IV:
Grown
Origln
Thick
on
Appearance
and
of Pits in the Gate-Drain
HEMT
Of AIGaN/GaN
reglOn
Buffer
Chapter-IV:
Origin
AIGaN/GaN
HEMT
Grown
Thick
on
●
of Pits in the Gate-Drain
Appearance
and
reglOn
Of
Buffer
4.1 Introduction
Several
scanning
evidence
in the AIGaN
as
in
that the defects
investigation
electroluminescence
not
observed
out
on
exclusively
is
microscope,
pro丘lometer
where
(AFM)
microscope
We
step-stress
was
useful
and
end
This
and
to study
HEMT
(VG_st,ess-5
-
to
during
-45
V),
origin and
Si with
and
57
the
uses
microscope
5 to 45
layers.
buffer・
thick
image
various
A
Keyence
capabilities
-
3D
of
observed.
we
conditions
laser light and
is
was
In this chapter,
at
laser
an
optical
light
white
Atomic
fわrce
of the defects・
the magnitude
TBuf
critical voltage
the critical voltage
measurements
crlSp OptlCal
on
-
-
0 V
SEM.
buffer
it combines
where
V, VD_st,ess
(VG_s1,ess-10
-
tool
resolution
also used
defect
denslty
current,
found
and
thick
grownon
in 3 different conditions
measurement
VD_st,ess
an
AIGaN/GaN
chose
(1)0ffstate
(2)
high
both
HEMT
an
which
stress
cyclic
leakage
the
on
Si with
on
and
AIGaN/GaN
defects
crystallographic
dislocation
and
buffer thickness
HEMT
step-stress
located
edge
barrier layer, defects resulting
imperfections
to
the gate
obtained
in splte Of their low
edge
in the AIGaN
discussed
we
for different
microscope
source
side of the gate
reveal
(AFM)
[6-10].
chapter
in AIGaN/GaN
studies
(TEM),
microscopy
below
generated
of these
due
i-GaN
through
and
carried
drain
are
electron
fわrce microscopy
atomic
defects generated
In the previous
have
[1-5]. Most
at the
these
more
require
layer
cracks
leakage
excess
growth
suggesting
from
denslty.Apart
transmission
using
(SEM), and
barrier
pits and
studies
microscopy
electron
physical
such
structural
5.0 pm
and
carried
out
the
namely:
V). (Discussed in
chapter-3,
Fig・3・2・)
Chapter-IV:
Grown
on
Origin
Thick
(3) On-state
Appearance
and
(VG_st,ess 0
-
V, VD_st,ess
-
dimensions:
Wg/ Lg-
All
experiments
were
The
drain
measured
a洗er every
extracted
gm-peak and
5 to 45
2・0トLm
V)
and
1 V step and time
with
Lgd
in the dark
HEMT
at the room
and
and
Some
measurement.
1 min.
3・0/4・0トtm・
-
(IDS-VDS) characteristics
step-stress
-
temperature.
transfer
of the
characteristics
parameters
below
IDmax= measured
RD
200/
perfbⅡned
current-voltage
mentioned
Of AIGaN/GaN
reglOn
Buffer
Device
our
of Pits in the Gate-Drain
at VGS
from
-
1.5 V
of ID
the slope
IG-off meaSured
and
at VDS
VS
-
VDS
VDS
1V
5V,
-
(forVDS
and
VGS
58
1V)
<
-
16
V
in the linear region.
were
plotted・
extracted
were
are
Chapter-IV:
Grown
Origin
Thick
on
0 state bias
-
VD_st,ess
variation
in RD
in
Vknee. Initially the IDmax
and
stress
the
current
foundthat,
we
measurement,
stress
gm-peak
slope, threshold
sub-threshold
leakage
H王MT
Of AIGaN/GaN
region
stress
bias
increaslngthe
on
increase
small
0 state
-
observed
thereafter
Gate-Drain
measurement
VD_,t,ess
In the
of Pitsinthe
Buffer
4.2 StepIStreSS
4.2.1
Appearance
and
there observed
voltage
Was
an
no
found
shi允(Vth)and
at 5 V
a
is
a
stress
increase
whereas
Observed,
voltage
decreased
there
voltage
and
in the IDmax. Also,
changes
observed
decrease
small
negligible
a
in
in the gate
(IGS)・
EJ‖
≡
才10
≡
苛
02
署lo-03
≡
I:
∈
cncT
10-04
.ぞ
10
05
10-06
0
2
4
6
VT)S
8
10
12
-6
-4
(V)
0
-2
VGS
2
(V)
≡ョo
〔/〕
呈20
三
初
VGS
Fig. 4.1. Change
condition.
-2
in device
VG_st,essWas
-4
(V)
characteristics
StePPed丘om
-5
to
at each
145
59
V
step
in 1 V
inthe
step
VGS
(V)
Vb-st,ess
(1min
-
per
0 V
step).
bias
stress
Chapter-Ⅳ:
Grownon
Origin
Thick
Step-Stress
bias
In the ONIState
no
at RDand
change
of Pits in the Gate-Drain
HEMT
Of AIGaN/GaN
reglOn
Buffer
4.2.2 0NIState
observed
Appearance
and
condition
stress
Vknee・ There
found
in sub-threshold
observed
found that, there is
we
measurement,
a
decrease
in IDmaxand
Vth and
slope,
IGS
are
no
significant change
there
gm-peak・Whereas
is
in Fig. 4.2.
Shown
100
10
01
‖
⊂_.
≡
才10LO2
≡
<
?
≡ 80
10103
亡
5
v)cr 1
j
0-04
40
1 0-05
10-06
0
2
4
6
VDS
8
10
12
-6
-4
VGS
(V)
10
0
-2
2
(V)
0】
I 0103
盲-
≡ョo
o-o5
LJつ
!wo7
且20
∈
b々
・ご
16
Fig・
4・2・
-4
Change
VGS
in
condition. VDIStreSSWas
upper-1e氏corner
(c)transfer
0
-2
2
StePPed
5 to 45
(clockwise): (a) output
characteristics,
and
at
characteristics
from
(a) gate
09
10
11
16
(V)
device
10
V
each
in 1 V
characteristics,
current
60
step
14
-2
VGS (V)
in the
ON-state
steps
(1
min
per
(b) sub-threshold
characteristics.
bias
step).From
stress
the
characteristics,
Grown
Thick
on
of Pits in the Gate-Drain
Appearance
Originand
chapter-IV:
Of AIGaN/GaN
region
HEMT
Buffer
⊂)
■ヨ
L,a
メ0.8
0.6
10
o
20
40
30
VD_stress/VG_st,ess(V)
10
50
30
40
20
VD_sけess/VG_s(,ess(V)
50
こ、
:
早
10107
?
一、
実..-o8
t3
Ll=
iZ
0.8
。主
10
Fig・ 4・31 Change
30
20
VD_stress/VG_sI,ess (V)
in IDmax'RD'gm-peak
40
50
o
20
10
二iO
40
50
VD_sb・ess/VG.st,ess (V)
and
On-state
IG-off at Off-state,
and
VD-stress
-
0 V
sta暮e.
these
across
the
were
stress
conditions
sわurce-drain
obseⅣed
measurement
(-VG_st,essandVD_st,ess
-
under
as
reglOn
nor
shoⅥ′n in Fig・
for higher
drain
stress
45
SigniflCant degradation
4・3・
This
voltages・
61
result
V) neither
on
motivated
the formation
IDmax, Rd, gm-peakand
us
to
do血e
of pits
IG-off
step-stress
Chapter-lV:
Grown
on
Origin
Thick
Appearance
of Pits in the Gate-Drain
HEMT
of AIGaN/GaN
regton
Buffer
4・3 StepIStreSS
Off-state
and
meaSuren)ent
-10 V;
(VG-st,ess
≡
stress
highdrain
at
bias
stress
VJ)-st,es草 5 to 200
V; step
=
-
5 V; tin)e
600
=
s)
≡
≡
Uウ
≡
≡
aO
0
4
2
6
Vds
8
6
10
-4
-5
(V)
-3
0
-1
-2
Vgs
1
(V)
1 0十03
1 0+01
≡10
E
Ol
IO103
<
<
呈10103
且10-05
・ぞ
.や
1 0-05
I0
07
16
Fig・
414,
VD-sけess
-3
0
-2
_1
Vgs (V)
the
shows
sub-threshold
=
4
-5
(a)
output
5 to 200
V; step
2
16
5 V; time
gate
600
-
current
s
-5
(b)
characteristics,
(d)
characteristics,and
-
1
14
-3
12
Vg5
transfer
1
_1
2
(c)
characteristics,
characteristics
for AIGaN/GaN
(V)
VG_st,ess
at
HEMT
-
V;
-10
TBuf-
grownon
5.OLtm.
The
summary
of
characteristicsand
characteristics
observed
gate
an
show
characteristics, transfer
current
characteristics
initial increase
in VD_s1,ess there
withtheincrease
There
output
a
small
increase
is
in the drain
no
are
characteristics,
shownin
cu汀ent
further increase
in the drain resistance
62
and
Fig・
sub-threshold
4・4・
shi氏in
current
theknee
I-V
device, But
than that of丘esh
in the drain
The
observed.
voltage・
The
Origin
Chapter-lV:
Grown
transfer
the
which
further
reveals
-
130
V
the
V
a
increasedand
gm-peak
decrease
sudden
in VD_sl,ess.The
increase
the
shi氏in the sub-threshold
negative
there
is
but there
is
show
characteristics
-
a
130
VD-st,ess
decreasedwith
found
there
vD_stress
gm-peak・ At
same
initially
that
show
characteristics
remained
Of AIGaN/GaN
region
HEMT
Buffer
Thick
on
of Pits in the Gate-Drain
Appearance
and
a
no
significant
much
in gm-peak
Vth・
in the turn10N
change
difference
signiflCant
Was
sub-threshold
slopeand
after it
there
characteristics
The
current
gate
voltage
observed
Observed
at
observed
towards
negative
bias.
⊂〉
''昌
一ー
;::I:I
10
=:こ.I.二・
益ig
10-4豆
Liこ享
3盲
1015j
∈
.ど
0
50
150
100
200
VD_s1,ess(V)
Fig. 4.5. Change
OFFIState
bias stress
Figure
bias
off-state
withoutany
reduction
in gm-peak
show
measurement
device
Shows
Was
no
nOted・
the critical voltage
the orlgln
understand
was
halted
a
undergoes
it is clearly
63
out
the
130
SEM
at
at
every
VD-st,ess
Vand
Step Of
200
=
a mirror
Rd Shows
HEMTs
i・e・ reduction
camied
IG-off aner
that fb∫ all
obseⅣed
f♭rAIGaN/GaN
Ofdegradation
Vand
to
measurement
step)・
failure
IDmax and
up
Changes
phenomenon
a氏er 130
per
catastrophic
IG-off・The
signiflCant
Hence,
step, 10 minutes
of IDmax, Rd, gm-peakand
increaseinthe
signs Ofsudden
gm-peak
V; 5 V
the behavior
The
stress・
and
buffer. To
(VD_st,ess 51200
-
4・5・ shows
behavior
did not
It)max, Rd, gm-peak and IG-otr in step-stress
in normalized
image
beyond
which,
devices
our
Si with
on
in gm-peak around
V
we
thick
130 V, the
in the gate-drain
reglOn・
ChapteトIV:
Grown
Origin
Thick
on
found
We
was
Figure
location
shows
in
continued
new
images
were
recorded
fわund
and
Fig・
already
these
of
oxides
spots
SiO2
throughout
spot, SiO2
PaSSivation
Figure
was
4・8 shows
that
all these
shown
no
Were
pltS
pltS, Showed
in the
Fig・
a
4・9・ Thus,
when
such
spots
were
were
taken
aRer
of the drain
of 100
and mlgrate
spaclng
fb-ed
and
the devices
64
travels
and
at the
nm
SiO2
in
were
gate edge・
some
cases
stressed
The
a
at a
the
the orlgln
Of
by SEM
It is apparent
remOVal・
towards
heap
at
spotted
understand
towards
out
a
revealed
facilitate re-inspection
etching
as
carried
to
gate-drain
pit depth
and
by
wet
in Fig・
formed
area
defects
or
images
were
images
at the cracked
a
observed
spots
AFM
is
were
spots
further
images
or
The
Shown
Shown
To
at the edge
generated
there
VD-stress・Several
the
cracks
that
measurementsI
the AFM
in between
generated
evident
these
removed
that the pits initially formed
Were
No
aS
aS
reglOn
new
fresh device
the microscopic
more
some
out
carried
PaSSivatiop・
voltage
of 600
reglOn
it is evident
voltages
occurred・
a
at different
The
gate-drain
gate-drain
cases
into
interval
time
a
PaSSivation.
or
increaslng
on
in Fig・ 4・7・ AFM
the
spaclng
pltS
fewer
breakdown
among
AFM・
4)・ In
befわre device
shown
the
at
the stress
enlarged
as
SiO2
this stress
obseⅣed
increasing
3 &
VD_st,essfor
values
aRer
became
gate-source
and
spot
on
spots
generated
measurement
the
developed
formed
of the spots
in either gate-source
V, hence
a
4・6・(frame
existing
on
our
image
the devices with
on
When
reglOn・
reglOn・
the increased
With
crack
130
-
4・6・(丘ane2)・ Similarly
were
or
spots
VD-stress
in the gate-drain
seen
reg10n
gate-drain
in VDISt,eSS,this crack
the laser microscopic
captured
no
at
shownin
=EMT
Or AIGaN/GaN
reglOn
in the
further increase
were
4.6.(framel).From
degradation
were
cracks
layer
PaSSivation
with
the gate-drain
absolutely
Fig.
SiO2
4・6 shows
across
These
sec・
the
on
In addition,
crater・
of Pits in the Gate-Drain
Buffer
cracks
measurement
Appearance
and
gate・ Also
gate
few
It is
edge・
AFM
carried
out
depth
of 400
n皿aS
constant
time
on
with
Chapter-lV:
Growron
Origin
Thick
increasing
=
4.6.
increasing
130V
Appearance
of Pits in the Gate-Drain
SEM
0 V
images
VD_stress.On
spot observed
fourth丘ame)
region
Of AIGaN/GaN
HEMT
Buffer
VD-st.ess,it led to the formation
VD_st,es,
Fig.
and
of degradation
in the formof
pits.
130V
show
&esh
the
evolution
there is not
device
(second frame)and
in the gate-drain
of spotunderanoff-state
region
further
observed.
65
spot
new
observed
spots
at
bias
(flrStframe).
stress
with
At
VD_stres,
different location
(third&
-
Chapter-lV:
Grown
on
Origin
Thick
Fig. 4.7. AFM
and
Appearance
of
Pits ir)the Gate-Drain
reg10n
HEMT
OfAlGaN/GaN
Buffer
images
takenwithSiO2
PaSSivation
66
V,
(VG_st,essニー10
VDIS.less
-
160
V).
Origin
Chapter-IV:
Grown
on
Thick
Fig. 4.8. AFM
gate-drain
and
Appearance
of Pits in the Gate-Drain
reglOn
AIGaN/GaN
Of
HEMT
Buffer
images
spaclng
and
taken
of SiO2
a氏er the removal
at drain
edge
were
moved
stress.
67
Pits
paSSivation・
towards
gate
edge
on
were
formed
increaslng
at
bias
Chapter-IV:
Grown
on
Origin
Thick
Appearance
and
of Pits in the Gate-Drain
reglOn
Of AIGaN/GaN
HEMT
Buffer
ロ
2
6
∠1
8
[LJn]
Fig・ 4・9・ AFM
4.4 Cyclic
4.4.1
image
stress
VGIStreSS
′
-
depicts
the
(a) originand
(b) depth
traveling of pit,and
of the pit.
measurement
Ilo
V
and
VD_sf,ess
=
100
V
\
く=)
、一号・・T
ー⊇
芸篭
≡
≡
liiZI
<
≡
=;:ラ
ヽ_.■・
匡⊆
実孟
こ
.ど
∈
・ぞ
Fig・ 4・10・
Changes
time
reveals
there
were
periods
negligible degradation・
no
The
(1,
in IDmax, Rd, gm-peak,and
spots
devices
10,
20,
fわrmed under
were
30and
The
constant
IG-off at COnStant
SEM
images
voltage
also stressed at constant
60
mins)・
Inthis
68
voltage
as
taken after 60
with increasing
VD_sI,ess
meas'urement,
-
100
we
stress
V
did
the function
time
(inset)
for different
not
that
reveal
min
of
time
observeany
Chapter-IV:
Grown
Origin
Thick
on
VG_sI,ess
Framel
:
Fig・ 41 I 1
V
VJ)_st,ess
time,
stress
time,
severalspots
SEM
images
1 50 V. The
-
For
of
devices
stress
of■stress
as
VDISt,eSS
the appearance
some
V
spots
of spots
existlng
generated
was
from
increased
even
no
defective
after 60
mins
pits
of
in Fig・ 4・1 1 The
・
69
spots
spots
at
getting
increaslng
V, the spots
numbers
bigger
gate-drain reglOn・
the beginning
with
VDISt,eSSOf 150
time.
new
of
found only
observed
shown
100
-
Also
spot
spots
at higher
stressed
time
new
show
number
one
shows
a氏er 30min,
The
EMT
inset.
shows
apart丘om
,
H
150 V
=
and
Fig・ 4・10・
Shownin
this
at
region
after 20min,
at vD_s.Tess
increase
-10
IG10ffaS
in Fig. 4.10
shown
after lOminstress
Frame4:
beginn-ng
as
a洗er lmin
:
Frame2:
Frame3
=
Rdand
gate-drain
stress
continuous
4.4.2
in IDmax,
in the
appeared
Of AIGaN/GaN
reg10n
Buffer
change
significant
Of Pits in the Gate-Drain
AppeararLCe
and
were
of spots
Of the
Stress
stress
time
time・
formed
from
the
increased wi也也e
Chapter-IV=
Grown
on
Origin
Thick
Fig1 4・12・ AFM
places
and
Appearance
of Pits in the Gate-Drain
reg]on
ofAlGaN/GaN
the heap
of oxides
HEMT
Buffer
images
takenwithSiO2
PaSSivation
in gate-drain reg10n.
70
reveals
at various
Chapter-ⅠⅤ: Origin
Grown
on
Thick
Fig・ 4・13. AFM
middle
and
Appearance
of Pits in山e
Gate-Drain
reglOn
Or AIGaN/GaN
HEMT
Buffer
images
of gate-drain
taken
spaclng
without
and
SiO2
traveled
PaSSivation
towards
71
revealsthe
gate edge.
pits formed
in the
ChapteトⅠⅤ: Origin
Grown
Thick
on
The
image
at various
places
identi丘ed
the AFM
towards
the devices
gate
edge
and
layer due
devices
edge
Sic
on
or
HEMTs
for
VDISt,eSS
leakage
current
increaslng
sapphire,
130
-
but
the stress
a
V・ Hence,
decrease
we
voltage
results in further decrease
fewer
cases
defective
AIGaN
up
to 400
orlglnatlng
at the
gate
drain
did
not
in gm-peak
Was
an
ofgm-peak・
nm
buffer
and
edge
drain,
seem
by
a
be mlgratlng
72
V
is caused
of
towards
12
in
stress
which
for AIGaN/GaN
in the
nm
our
fわr
case
drain
at the
increase
in the
and
not
i-GaN
to be
100
This
above.
only
nm
the gate edge
on
in
and
means,
Also
on
edge
by the top 25
buffer.
gate
Also
voltage・
of pit at the drain
found
was
130
part
defects/pits
appeared
sudden
in
results
in the AIGaN
beyond
were
at this
at the
stress
reports,
in number
-
but also
a
observed
which
However,
observe
VD_st,ess
and
20 V
nm
pit depth
a
pit depth
defects
-
of these
the pits
increase
The
for higher
to
of 13
mechanical
recorded
pltS
at VD_st,ess
were
pits
width
measurement.
thick
observed
50 V. These
observed
to reliability degradation
pltS contributing
between
has
were
These
reglOn.
originated
In all these
current.
stress
we
were
and
the pits
the structural
in the formation
one
Si with
which
it went
no
nm
4. 13 reveals
period.
between
that high
results
reliability
grownon
of 8
leakage
gate
during
reglOn
AIGaN/GaN
stress
for the
paths
grown
gate-drain
high-voltage
-
believed
was
time
defects
or
spots
reveals
of gate-drain
middle
at VD_st,ess
and
that
of oxides
Figure
voltages.
PaSSivation
pit defects
depth
a
stress
the stress
VIShaped
have
in Fig. 4. 12. No
the correlation
reveal
in the IG1.ff. It
the
cases
degraded
to
reported
to the
as
acted
highly
some
increaslng
on
[2,3]. The
were
Increase
sharp
in
and
studies
electrical degradation
of SiO2
the heap
reveals
Shown
at higher
even
reglOn
gate
few
Recently,
and
HEMT
Of AIGaN/GaN
reglOn
PaSSivation
reg10n
after the removal
drain edge
traveling
the SiO2
with
in the gate-drain
taken
at the
found
taken
at gate-source
images
formed
of Pits in the Gate-Drain
Buaer
AFM
present
were
Appearance
and
the
the
nm
pltS
increaslng
Chapter-IV:
Grown
Origin
Thick
on
and
at the
generated
the
gate
increase
current
of this leakage
Fig. 4.14. shows
HEMT
on
believed
to be
breakdown
in drain
the various
the pits
occur
the i-GaN
orlglnatlng丘om
are
voltage. The
been
voltage.
were
layers・
ca汀ied
out
The leakage
possible leakage
by
the
sumof
biasing
were
currents
currents
measured
or
(Is.u,ce
substrate
lbuf7er)and
current
is
(Id,aim)
current
are
leakage
lgate, Isou.ce,and Isub・ The
Fig. 4.14.
shownin
leakage
have
the drain
leakage
source
(Igate),
current
gate degradation
measurements
increasing
drainleakage
(Isub).The
results that before
characterization
fixed voltageand
leakage
current
paths
breakdown
lVi血the
measured
our
three-temillal
a
gate at
from
drain side which
4.5 Three-termillal
Tbe
HEMT
Of AIGaN/GaN
region
Buffer
VD_st,ess.It is evident
the
of Pits in the Gate-Drain
Appearance
current
pathways
in 3-TBV
forAlGaN/GaN
Si.
Three
terminal
the sample
in
an
off-breakdown
inert liquid
voltage
Fluorinert
measurements
(FC-40)
73
were
to avoidany
carried
out
atmospheric
by
immerslng
innuence
in
Chapter-TV:
Grown
Origin
Thick
on
Appearance
and
V
200/4
-
voltage
at which
average
3TBV
4・1 5 shows
Llm, Where
gate
grounded.
Our
the
drain
of 273
V
breakdownvoltage
current
was
significant
gradual increase
reglOn
breakdown
of
was
for Lgd
Here
up
case
I{EMT
AIGaN/GaN
Of
Isubsuateinfluencethe
device
be
Vand
to
HEMTs
breakdownin
current
Foral1
thatthe
three
273
bufferthat
then
and
130V
an
terminal
Isou,ceand
final breakdownat
Si withthick
on
devices
Increases
beyond
of -5
drain-source
our
the
imitially
therea氏er
a
voltage
the
as
During
noted
(3TBV)
voltage
sub-threshold
is defined
4・0ト皿I
-
leakage
130
breakdown
observed.
it should
to
ofAlGaN/GaN
at a
voltage
I mA/mm
the gate
change
terminal
maintained
in the Is.urceand lsubst,ateleading
in the
understood
was
observed
measurements,
showany
the three
bias
tillthe breakdownoccurs.
saturates
didn't
Figure
Si substrate
with
Gate-Drain
Buffer
血e gate一血ain region・
for Wg/Lgd
of Pits inthe
I,ubs1,ate
there
V
is
It is well
ls.urce and
to Igate・
addition
丘、
l=
!=
10
2
10
4
葛看
ヽ-
‡=
1 0-6
」=
く弓
ゝ■
(⊃
0
50
100
Drain
Fig・ 41 1 5
・
Three-terminal
with
Wg/ Lsd
with
increasing
-
200/
4トLm・ The
voltage
inset shows
voltage
observed
250300
(Ⅴ)
for AIGaN/GaN
the linear increase
HEMT
on
Si
in the breakdownvoltage
Lgd・
Recently,
initiated by
breakdown
150200
Meneghini
the increase
et. al have
in drain-source
reported
leakage
74
a
mechanism,
current
where
[11】.This
the breakdownis
is another
a
indicalion
ChapteトⅠⅤ: Origin
Grown
Thick
on
As
we
increase
sudden
increase
pits at GaN
Of AIGaN/GaN
reglOn
130
VDISt,eSS
130 V
-
around
voltage
all these
of off-state device
case
lsubst,ateat
Is.u,ceand
reglOn
(Fig・6 inset)・In
increased
linearly
devices,
V
HEMT
breakdown・
to
corresponds
a
resulting
BV
the
images・
in microscope
gate-drain spacing
Isubst,ateinitiate for device
that Is.u,ceand
Shows
in
the上gd, breakdown
15 pm
-
in the
be eliminated
carmot
Ofdefective
for Lgd
1 5トLm
leakage
this
beginnlng
of Pits in the Gate-Drain
Buffer
that the buffer
Moreover
Appearance
and
of 1060
varies
from
V
4 to
breakdown1
4.6 Summary
We
have
studied the appearance
and
3TBV
degradation
devices
from
IG-off・Defective
and
same
pltS
the
wafer
were
formed
Were
case
above.
in addition
The
3TBV
to Igate・From
reliability degradation
drain, but also from
reveals
in the gate-drain
with
part ofi-GaN
only
by
buffer.
75
at
its relation
and
Si
on
no
showed
reg10n
the increase
VD-st,ess
-
in VD-st,essWith
25
nm
AIGaN
several
increase
130
V
in the
and these
the pit depth
the device
that the defective
the top
to electrical
substra土e
sudden
Isubsf,ateinfluence
that Is.u,ce and
not
defect
HEMT
and
results, lt is evident
these
is caused
a
of AIGaN/GaN
stepIStreSSed
pits increased in numbers
defective
nm
the
In
of structural
of 100
breakdown
pltS contributing
between
gate
to
and
Chapter-ⅠⅤ: Origin
Grown
Thick
on
Referen
c es
[1]J・ L・
Jimenez
[2] P・
[3]S・
C・ Floresca,
Balistreri, and
A・
[5] M・
M・
D・
R・ Jolmson,
J・ W・
[6]S・
L・
[7] H・
Phys.
T・ Palacios,
Chowdhury,
J・ Smith,
A・
Symp.
HEMT
Proc., 2008,
C・ V・ Thompson:
and
J・ L. Jimenez,
Reliab.
Passaseo,
IEEE
Trans・
D・ J・ Smith:
and
Selvaraj,T・
Suzue,
S・ Kato,
and
49
V・
45
(2006) 2531.
[8]S・
L・
Selvaraj,T・
Suzue,
[9] S・
L・
Selvaraj,A・
Watanabe,
and
Y
T・ Egawa:
A.
C. Lee,
p. 429.
Appl・
Phys.
Mater.
A.
Sato,
F. Ren,
Appl.
Wakejima,
Phys.
and
13
B 30
T.
and
Express
T. Egawa:
Meneghini,
S. J. Pearton,
S.
062204.
Lett. 30
S・ Ⅶshida‥
2
G.
(2013) 126.
(2012)
Device
Iwami,
P. Saunier,
M.
C. Y. Chang,
Electron
M・
Stocco,
Reliab.
Sci. Teclmo1.
IEEE
E. Beam,
478.
(2009)
Tasco,
Device
J・ Vac.
T・ Egawa:
T・ Matsuda,
Phys.
33
Int・ Reliab・
D・ A・ cullen, L・ Liu, T・ S・ Kang,
Jolmson,
Sasaki,
del Alamo,
u
E・ Zanoni:
and
Jang,
IEEE
J・ Kim・・ Microelectron.
Cullen,
Meneghesso,
Of AIGaN/GaN
reglOn
233509.
(2010)
[4] D・
U・ Chowdbury‥
and
J・ Joh, J・ A・
Y・ Park,
of Pits in the Gate-Drain
Buffer
Makaram,
Lett. 96
Appearance
and
587.
(2009)
Jpn・
∫.Appl.
(2009) 111005.
IEEE
Electron
Device
Lett.
(2012) 1375.
[10]S・
[11] M・
Pogany,
L・
Selvaraj,A・
Meneghini,
E・ Zanoni,
Watanabe,
A・
and
and
Zanandrea,
G・ Meneghesso・・
T・ Egawa:
Appl.
F・ Rampazzo,
Jpn. J. Appl.
76
Phys.
A.
Lett. 98
Stocco,
Phys.
52
M.
(2011) 252105.
Bertin,
G
(2013) 08JN17-1.
Cibin,
D.
chat)ter-V: Influence
of GaN
Stress
Innuence
Chapter-V:
IIEMT§
AIGaN/GaN
Stress
GaN
of
Vblta紬MTs
Threshold
on
Threshold
on
Si
on
Voltage
Shift
in
Si
on
5.1 Introduction
Though
different
is considered
substrate
growth
GaN
of
layer made
of strained
crack
[1].Large
tensile
it
understood
that
polarization
arlSlng
formation
Raman
the
the
crystal
built-in
strain
in the
device
of two-dimensional
is
measurement
[2-8].Also,
reliability
a
useful
difference
applied
extemally,
the
performance
fllms
chapter
it and
study
defect
by
[13].We
the
varying
discusses
how
influences
over
the
strain and
found that there is
a
have
the change
device
the
carried
out
GaN
to the
the
epltaXy
threshold
electrical
[9-12].When
would
to
influences
77
the GaN
fわr the
[3,4]・
GaN-on-Si
the
and
electric field is
high
critical value
crack-free.
thicknesses
characterization
in the
of the AIGaN/GaN
grow
We
spo山aneous
lattice mismatch
a
exceed
buffer
voltage.
between
large
to
is widely
interface
AIGaN/GaN
the
of
is responsible
growth,
deterioration
superlattice
in GaN
correlation
with
the strain/stress
that it is possible
layer
together
and
HEMT
GaN
epitaxial
(TBuf) [14]・ This
the strain that involved
used
Raman
to
study
a
and
because
[2]・ It
due
layer
AIGaN
leading
found
strained
Si and
is undesirable
at the
concern
large bowing
layer
a鮎r
(2DEG)
form1ng
and
epitaxial
the
to evaluate
bigger
strain in the
strong
gas
between
formation
of
heterostructure
a
prevent
pleZOelectric,
method
becomes
coefficient
through
quality
for the
attention
(SLSs) to
Si
and large-scale
glVen
epi-layers
on
grown
electron
thermal
relaxes
in GaN
be
to
the Si
growth,
cost
involved
strain
structures
superlattice
stress
to
causes
the
epitaxial
of its low
that has
elements
Si is understanding
on
because
suitable
and key
buffer
deterioration
the most
fundamental
The
availability・
be
to
available for the GaN
are
substrates
spectroscopy
the
strain/stress and
in
to
Vth Shi氏・ We
Vth Shift・
Chapter-V:
Influence
5.2 Raman
Analysis
Raman
experiment
spectrometer
device
the
In general,
CCD)・
scattering
spectrometer岳are
light to
developed
high
be
stray light rejection,
making
laboratories
also
but
Notch/
environment・
laser light from
scattered
laser
light
the
on
high
phonon
mechanical
The
selective
sample
over
use
of different
probing
layer
formation
averaged
wavelength
be studied
to
and
in
or
a
the
sample
(argon laser:
using
UV
layer
488
excitation
GaN
thickness
514
nm,
with
nm,
and
bandgap
can
be
(Hec°
wavelengths
78
pm
elastically
focuses
laser
light
resolution.
experiments
of
whereas
nm)
metal
material
under
over
a
contact
properties
visible excitation
surface
due
allows
averaged
for optimlZlng
laser: 325
industrial
an
XYIStage・
either
probed
in
only
of spatial maps
of 3・4eV,
nm),
not
spatial
been
achievlng
scattered
motorized
properties,
a
532
the
in Raman
layer, for example,
while
ln
the recording
wavelengths
have
to prevent
l12
with
uslng
material
scattered
optlCal microscope
collects
allows
sample
therefore
surface
For
semiconductors・
over
a
of
laser excitation
of phonon
thickness
areas
extended
and
experiments
systems
elastically
monitoring
an
While
scattering
possible,
systems
Often
issue.
concepts
systems
than
Raman
light throughput
in Raman
study
Raman
the
a
coupled
weaker
considerable
enable
process
used
the
under
stability of such
properties
and
being
a
of Raman
use
the spectrometer・
entering
material
Can
high
a
retain
f♭r growth
are
of magnitude
light・ Alte皿ative
stray
to
be
can
laser,
a
charge
the elastic scattering耳nd
the wider
(micro-Raman system), allowing
The
light
multicharmel
Si
on
typically
source,
is orders
lntenSlty
via
able
filters
edge
a
commonly
stray
light
to
years
light
signal intensity
in scattering
Raman
the
most
to separate
used
HEMTs
Volta2こeShiftin AIGaN/GaN
mOnOChromatic
hence
lntenSlty,
in recent
research
the
the Raman
mismatch
dominate
a
(nowadays
generally
large
the
slgnals,
Threshold
on
requlreS
detector
a
and
elastic
Stress
of GaN
properties
can
to the absorption
laser
UV
the
of
(0001)
on
the
in
3.1. Schematic
GaN
thicknesses.
bufferand
spectrum
measurement,
obseⅣed
at
highlighted
peaks
were
1・25,
520.7
using
Shi允in AIGaN/GaN
forthe
case,
and grov^h
phonon
selectionrules
at 567.5
stress
cm-I
and
and crystalline
linewidth・
the E2 Phononfrequencyand
AIGaN/GaN
on
Si
spectroscopy
The
mode
information
visible・ The
on
spectrum
Raman
monitoring.
Al(LO)
HEMTs
microIRaman
used・ Mostly
was
E2 and
measurements
GaN
buffer and
epl-StruCturewithvarious
laser
Raman
star
spectra
which
sign
identi丘ed and
carried
as
shownin
of 532108
2・5, 4・0,and
cm-1
were
thicknesses
a
the room-temperature
-
e
discussion
and
TBuf
for process
representation
different
a
our
wavelength
clearly
from
Ramanspectra
for
nm
Volta
In
sample.
were
extracted
Fig.
5.3 Results
the
for GaNwiththe
surface,
canbe
Threshold
on
relevance
respectively,
cm-1,
quality
has
surface
(0001)
734.5
light
Stress
laser of 532.08
a
measurement,
on
of GaN
Innuence
ter-V:
With
is fわund and
the
various
also
right
79
3.1.
was
(high) mode
shownfigures・
(Fig.3.2.
Fig.
wavelength
or the E2
5・0岬I
inall
showed
nm
for AIGaN/GaN
out
epi-structure
Forthe
used.
and
micro-Raman
Figure
Al(LO)
TTGaN thicknesses・
some
o也er small
The
side) with
E2
peaks
(high) mode
higher
at
3・2 shows
line obseⅣed
The
or
and
magni丘cation・
Si peak
Si
were
At(LO)
∫
ter-V:
Influence
of GaN
Stress
Threshold
on
Volta
e
Shi允in AIGaN/GaN
HEMTs
on
Si
⊂
.言
∃
J⊃
h
cd
、-■■■
と、
'a
⊂
q)
i
岩
qJ
EL
⊂
.≡
コ
.`⊃
h
d
ヽ一
之、
'=
⊂
4)
■■・J
⊂
I5d
o3
也)
FL.
言
⊂
⊃
」⊃
ゝ■
cd
、-■
三・
'a
⊂
O
◆■▲
⊂
ig
q)
a.∼
⊂
.⊇
コ
h
,占
cd
\ヽ_/
=・
∴転
t=
4J
E≡.
⊂
上土
く弓
C}
Fh
200
300
400
Raman
Fig. 3.2. Raman
also showed
peak
500
shift
600
800
550
800
600Ram6a5nOshi孟o(ocm-17
(cm-1)
for various
(Le允side). The
700
peak
buffer thicknessesand
shift shownin
80
a
clear
variousGaN
manner
thicknesses
(rightside).
were
of GaN
ter-V: Innuence
there
increases
which
is
no
much
a
a
peak
shi氏in
1.25, 2.5, and 5.0ト皿aS
properties
averaged
excitation
the
over
strain/stress
present
phonon
at 567.5
peak
ノ
inthe
GaN
TBuf
general
the E2
layers.
A
the E2
(high)
4・O tim,
=
TGaN
it further,
we
0・5トIm)
=
plotted
GaNwith
band
a
gap
be
can
(high) phonon
probed
eV
GaN
to
shows
-
material
under
is used
peak
typical unstrained
of3・4
the
TBuf
Si (111) substratewith
grownon
layer血ickness
sample
15]. h
wavelength[3,
epilayers
Si
on
It is also to be notedthat
Tounderstand
Fig. 3.3. For
Shownin
foundalongwith
was
(except
cases.
each
HEMTs
Shift in AIGaN/GaN
in TTGaN thicknesses.
intensity
for lト皿-thick GaN
Ramanspectra
e
satellite peak
increase
in the peak
change
found
there
whereas
withthe
Volta
Threshold
on
Fig. 3.2, it is clearthat
From
mode,
Stress
visible
studythe
E2
(high)
[4,6, 16].
cmJl
\
コ
i
土・
'G
〔コ
q)
+J
‡=
.1
(弓
O
FL
Fig. 3.3. Raman
spectra
buffer
The
thickness・
We
thicknesses.
observed
The
GaN
400
Raman
300
200
obtained
inset shows
the
E,
to
500
E2
findthe
(high) modes
peak
700
800
shift (cm-I)
the phonon
phonon
600
(high) phonon
peak
shift for different
shift in GaN
at 565.97,
81
peak
567・4l
with
,
and
the
568・9
shi氏with
buffer
to
thicknesses・
change
cm-]
respect
were
in
buffer
recorded
Chat)ter-V:
for
TBuf
AIN
1.25,
-
along
observed
of GaN
1nnuence
2.5,
Stress
and
5.0
E2
withthe
(576.69 cm
l) [17]. The
ofAlNthat
is present
amount
565
Threshold
on
Ltm,
VoltaEe
is believed
peak
intensity
satellite peak
in the buffer
Tensile
(Fig.3・3 inset).A
respectively
(high) phonon
HEMTs
Shift in AIGaN/GaN
to be
increases
due
to
increase
Ti
L仙-
G_a_N_
GPa
+0.02
芸
10.08
GRa
7J
ー0.1
\
!=
(6
:GIpai
-0,3
2 GPa
●′・●
7.io
\
∼1 t<T-1
′.■
≡
;pair..?I
l
-GP+,"ニ--
〔弓
こ∠
・〈.
J?7
GPa
-0・47
0.5
Compressive
0
1
2
Buffer
Fig. 3.4. The
residual
(1) for
various
understand
the amount
stress
was
bufferand
the
3
thickness,
TGaN
shi允s of the E2 (high) mode
stress
4
TBuf
for the GaN
calculated
(Llm)
E2
(high)
phonon
peak
shift
thicknesses.
that
strain/stress
of residual
〃1Tl
stress
571
peak
in也e
layers.
-
568
calculated
of
stress
Unstrained
O
Tb
the presence
G蕗-I10'17fGPa+...,孟J
Trr、よ-±
i二て:I阜ご0=01_3f_GP_チ
-tL-
567
eq.
was
satellite peak
wi也the
+0.35
using
Si
on
is present
in the samples
inthe
Raman
in
by
spectra
GaN
the
using血e
using
the
we
epilayers,
measured
pbonoTl
equation[4,
16,
18]
below
△a'-
where,
Ao
theoretical
=・
K,101,r
isthe difference in the measured
peak
position
ofanunstrained
peak
GaN
82
position
(567・5 cm
of the Ramanpeak
1)IThe
strain coemcient
and
the
( K, )
here
selected
+o.35,
is 4.3 cm
+0.02,and
To further
with
of GaN
Innuence
ter-V:
that GaN
TGaN.
-0.32
GaN
strain/stress
Thus,
from
stress
calculated
1.25, 2.5,and
for this study
as
key
a
Play
shows
reSPeCtively・
Were
epIStruCtureS
with
(1)
eq.
5.0トIm,
grown
Fig. 3.4. We
shownin
tensile to compressive
TGaN
using
Si
on
found
in TBuf and
the change
role in the strain modulation
during
the
downprocess・
the cooling
growthand
GaN
HEMTs
Shi氏in AIGaN/GaN
strain/stress, various
thicknesses
changes
e
TBuf-
in GaN
change
in TBuf and
changes
Vo]ta
for HEMTswith
GPa
buffer
and
Threshold
on
[4, 18].The
】GPaー1
understandthe
different
Stress
0.32
0.28
0.24
.
・
rJ
≡ 0.20
E:.
0.16
:i
0.12
→-∫
.?w o.o8
-1.5
Gate
Fig・
3・5・
Transfer
The
V
were
step
The
(VG_st,ess -10 V)
under
-
was
voltage, Vgs
source
AIGaN/GaN
HEMTs
on
off-state bias
a
stress,
set
these
of
Was
measurement
stepIStreSS
dark condition. The
to HEMTsfor
applied
tested until
its parameter
fabrication processand
device
in chapter-3.
mentioned
of
11.5
0
10.5
(V)
Si
with
GaN
various
device?.
strain/stress
stress
characteristics
012.5
-0.5
duration
similar
devices
of600
reliability data
were
rested
83
from
at off-state
for 30 min
obseⅣed.
before
it is
bias
5 to 70 Vwith
In this measurement
were
as
same
out
Carried
VD-st,essranging
s.
kept
were
several
On
carrylng
5
devices
completion
or
Out
dc
normal
1nnuence
of GaN
Ids-Vdsand
transfer
characteristics
(VTth)isthe
gate-source
ter-V:
mobile
Stress
Threshold
on
the 2DEG
HEMTs
ShiftinAIGaN/GaN
e
the device
to obtain
at which
voltage
Volta
Threshold
rate・
recovery
is completely
channel
Si
oll
voltage
depletedfrom
carriers.
The
transfer
Fig1
shownin
built-in
315・
GaN
determined
of the
The
from
VTR Shiftwith
the
Vgs
increase
reduction
as
in
was
a
drain
small
Fig.
shownin
in the
tensile
(VDS
3.5. Figure
GaN
compressive
bias
GaN
in the
change
VT.hンof the
wafer・
<<
as
epilayers
observedwiththe
as-grown
by applying
of lds VerSusthe
VTth ShiRwiththe
negative
VTth Shin
different
these
on
measured
inthe
present
the linear region
root
were
in the
change
strain/stress
square
positive
characteristics
device
was
VGS), and
3.5(a)
plot
the
shows
the
straill/stress, Whereas
strairL/stress is shownin
Fig・
3.5(b).
ー3
-2
-1
Gate source
voltage,
Fig・ 316・ AIGaN/GaN
stress,
IdsIVgs
the
VDISt,eSS,Show
HEMTs
characteristics
that the
It is believed
influencingthe
on
change
Vth Shins
Si substrate
were
out
1
positively・
that the built-in GaN
in the
+O135 GPa GaN
・25 pm show
devices,and
on丘esh
after every
withTBuf-
carried
0
Vgs (V)
strain/stressthat
VTR Shi氏・ During
84
off-state
bias
present
stress,
in the epilayers
there
occurs
a
is
high
chapter_V:
vertical
acquired
the increase
with
bias・ The
to positive
vlh Shi氏with
increaslng
on
70 V・ Hence,
-
for HEMTs
are
with
tensile
respect
strain/stress
a
strong
difference
the device
created
strain/stress
degradation
a
between
correlation
during
that
occurs
tensile strain through
from
with
on
fresh device,
a
at VDIStreSS
were
to
-1・60
observed・
-1・84
V, and
Vth Shi氏・ It is
negligible
of AIGaN/GaN
in the
change
devices
1・25トLm
HEMTs
through
a
with
bias
stress・
This
of strain/stress
in GaN
and
Shi氏and
off-state
electrical
present
owlng
tO
in GaN
the distortion
85
thicknesses・
vertical
It has
electrostatic
epilayers
compressive
suggests
the
suggests
for tensile
is different
stress
the
strongly
different
10, 30, and
HEMT
those
the
the type
-
that the AIGaN/GaN
Vth
with
Vth at VD-st,ess
the shiftin
It is evident
positive
in VD-st,essfor HEMTs
of the shift in threshold voltage
are
negative
resulted in ll ・66 V
observed
shows
Vth Shift aRer
negative
in the polarity
of traps
compressive
a
was
the increase
figure
device・
show
be -1・79 V
Vth Shifts negatively
V
from
were
Vth Shifttowards
that
noted
and
TBuf-
on
curves
[19].
effect
to a丘・esh
to
electrostatics
in Vth Shift with
strain/stress
show
the
affects
is found
HEMTs
Vth Of11・28
in Fig・ 3・7・ The
shown
with
additional
strain
changes
70 V
nature
2・5トLm,
be
Ids-Vgs
voltage
TBuf
with
in the Ids and
reduction
to shift positively
5・0トLm,
-
of piezoelectric
epilayers
is
TBuf
source
it should
1・25 pm
Vth Shi氏for
on
GaN
The
TBuf-
the gate
a
HEMT
The
stress・
Si
on
in both the AIGaN
generated
ofAIGaN/GaN
bias
show
VDISf,ess・Here,
on
positive
TBuf-
that
combination
This
in
was
curves
off-state
characteristics
VD-st,ess,Vth tends
a
on
evident
there
transfer
for HEMTs
whereas
aRer
HEMTs
Shift in AIGaN/GaN
strain/stress
in VDISt,eSSby sweeplng
increase
the
Voltage
the transfer
and
bias・ V.h for HEMTs
positive
and
3・6・ shows
before
measured
Threshold
on
and additional
Figure
reg10nS・
1・25トLm
-
Stress
electrostatic丘eld,
GaN
and
of GaN
Influence
Vth Shi氏・
that the
strain/stress
been
that
reported
and
that
fleld that introduces
of the crystal lattice in the AIGaN
barrier,
ter-V: Innuence
inaninverse
resulting
chaJmelwidth,
a
In
the
increasing
in the GaN
our
group
TBuf for the growth
-1.0
VD_sT,ess
(:jL,:::?i
L」
と_1.2
VD_stress-
■●▲
J ●▲
」=
10
-
leads
strain
HEMTs
established
Si
on
30V
l
b
TGaN
」ニ
densities
in
were
+
TGaN
pm
1.0 Llm
-
1.5
Llm
L?
r
盛11・4
2DEG
increase
withthe
-0.5
^TGaN-
Vt)_stress-70 V
I
in the
change
[14].
l
l
V
a
dislocation
that
Si
on
ofGaN
to
densities
carrier
Fresh Device
■●▲
一\
ShiflinAIGaN/GaN
e
2DEG
the
changes
past,
Volta
[16].
effect
change
in tum
which
on
Threshold
on
piezoelectric
thickness・
reduced
Stress
believe that
We
buffer
of GaN
l
l
cd
ヽ-■
I
'S -1.6
>
▲
'て)
▼・・・・・・・・・・・■
⊂)
A
-1.8
,=帆
O
i: ー2.0
ト
Vds=10V
-2.2
-0.8
Fig・
3171 GaN
stress
variousHEMT
threshold
vs
structures
grown
Asdiscussed
in
strain/stress
is created
HEMTs
TBur
on
-
dislocation density
[20, 21]・ This
in the decrease
Ids and
positive
voltage
the
devices,
Llm
produces
of the electron
VTth Shi氏・ These
GaN
the
TGaN
bias
Which
electrons
86
were
for
measured
tensile
additional
field, In the
strain/stress
become
inthe
inthe channel
stress
an
tensile
for electrons
concentratic-n
0.6
thicknesses.
stress,
a
with
tr叩StateS,
centers
trapped
bias
off-state
in verticalelectrostatic
acceptor-like
the trapping
0.4
(GPa)
TBur and
off-state
increase
0.2
shi免on
different
with
[16], during
with
1125
increases
0
-0.4-0.2
GaN
stress
-0.6
recovered
and
of
large
negatively
charged
channel
resulting
2DEG
leading
case
to
a
reduction
fully by
keeping
in the
the
cha13ter-V: Influence
of GaN
device
30
at
for
rest
dislocation
densities
compressive
stress
traps, causlng
During
[15].After
effect
and
Vth
of TBuf
which
30
operates
vD_stress,results
less GaN
mins
2・5 pm,
in
a
in
a
to
found
with
a more
Vth Shi氏・
negative
reduction in Ids Similar
in the cha皿el
interface,
a
with
partial recovery
are
and
relaxed
to
necessary
and
the
kink
explain
the
HEMTs
GaN
Ids degradation,
1n
GaN,
to that of the unstrained
that the relaxed
for the negligible
can
Vth Shift・ Whereas,
negative
of the AIGaN/GaN
believe
GaN
at the gate/AIGaN
studies
stress/strain
Vth Shi氏・ We
the
of acceptor-like
that electrons
argue
the elastic energy
within
and
they
For
stress・
Vth Shiftwith
negative
Further
is responsible
good
leading
Ids Showed
GaN
devices,
Ltm
in the number
reduction
time,
strain/stress
negligible
strain/stress
VIh Shi氏results
GaN
the device
a
the AIGaN,
recovery・
5.0
-
compressive
injectedin
recovery
no
a
and
in which
the compressive
-
is
a
observed
to be
Showed
behind
mechanism
case
we
TBuf
on
Si
on
ヽ
show
that there
reported by other authors
buffer
GaN
Shi氏仰=正MTs
HEMTs
of
to fill the 2DEG
electrons
energy
case
and
it is believed
more
sufrlCient
achieve
the
low
were
ThlreShold Vbltage
on
In
min.
off-state bias stress,
to results
the
Stress
on
high
strain/stress
a
and
or
negligible
reliable performance・
5.4 Summary
we
have
buffer
various
importance
HEMTs・
of
and
GaN
Raman
buffer
shi氏and
and
GaN
strain/stress
reveal
thicknesses.
We
strain/stress.
The
less Ids degradation
device
the
thicknesses
spectra
GaN
GaN
evaluated
with
uslng
fわr the
the change
found
GaN
the negligible
with
bias
Off-State
degradation
in the
that there
is
Vth Shi氏during
stress・
and
GaN
minimum
87
HEMTs
of AIGaN/GaN
reliability
a
The
strain
results
reliability. of
strain/stress
strong
on
Si with
illustrate the
AIGaN/GaN
the change
with
correlation
between
or
strain results
relaxed
off-state bias stress・
in
the Vth
in
叫/GaN
I正MTs
Si
on
References
[l]T・
Egawa:
[2] K・
W・
ULVAC
Kim,
Phys.
[3]A・ Saura,
[4]E・
and
Lett. 98
H・ Ji, M・
Appl・
K・ S・ Im, J・ K・ Lee,
Phys.
O・ Manaresh
Kuball:
(2006)
Breach,
and
S・ J・ Chua,
Shen,
J. Uren,
T. Martin,
Anal.
P・ Chen,
T・ Takahashi,
H. S. Kwack,
S. Beck,
and
K. J. Nash,
K. P. Hilton,
R.
and
103502.
Semiconductors:
Sur£ Inte血ce
[6] S・Tripathy,
[7]X・ Q・
M・
Lett. 88
(Cordon
B. J. Kwon,
(2011) 141917.
Kuball,
T・ Yu, in Ill-VNitride
[5] M・
101
(2013) 18.
D・ S・ Kim,
H・ Cho:Appl・
S・ Balmer:
63
Application
London,
2000).
31
(2001) 987.
and
Z・ L・ Miao:
H・ Kawashima,
eds. E. T. Yu,
andDevices,
J. Appl.
T・ Ide, and
Phys.
M.
92
3503.
Appl.
Phys.
Shimizu:
(2002)
Lett.
(2012) 031912.
[8] S・
Tripathy,
K・ Vivian,
Bera,
S・ L・ Teo,
M・
Z・ Wang,
[9] S・
G
Lo,
(〕・
Demirtas,
X・ Lin, S・ B・ Dolmanan,
Krislma
Kumar,
H・ Li, D・ Lee,
J・ Joh,and
S・ Aru1kumaran,
J・ A・ del Alamo:
F・ Wilson,
[11]D・
Marcon,
T・ Kauerauf,
F・
Cheng,
M・
R・ Mertens,
S・ Decoutere,
IEDM
Leys,
Tech・
Wakejima, and
Dig・, 2010,
[12]M・
R・ Jolmson,
S・ Jang,
J・ W・
del Alamo
[14] S・
Selvaraj,T・
L・
and
T・ Egawa:
Appl.
J. Das,
M.
R. S.
Kajen, L.
S・ Vicknesh,
S. Todd,
Lett. 101
Phys.
Van
G・ Meneghesso,
W.
(2012) 082110.
Reliab.
50
Express
6
Hove,
K.
(2010) 758.
(2013)
P. Srivastava,
E・ Zanonl,
and
056501.
K.
G・ Borghs:
p・ 472・
and
[13]J・ A・
Phys.
Microelectron.
Medjdoub.
D・ A・ Cullen,
Jolmson,
P. Y. Tan,
G・ I・ Ng,
S・ Ham:Appl.
and
[10]A・
A・
Joyce
L・ Liu, T・ S・ Kang,
D・ J・ Smith:
J・ Vac.
J・ Job: Microelectron.
Suzue,
and
Sci. Teclmo1.,
Reliab.
T・ Egawa:
IEEE
88
F. Ren,
49
Electron
C. Y. Chang,
B30,
S. J. Pearton,
(2012) 062204-1.
(2009) 1200.
Device
Lett. 32
(2009)
587.
Y.
迦pter-V:
of GaN
Influence
Stress
[15] M・
Meneghini,
A・ Stocco,
zanoni:
Appl.
Lett・ 100
[16] S・
[17]
X・ Wang,
331
Growth
[18]W.
Z. Wang,
Krishnakumar,
M・
Bertin,
Voltage
HEMTs
Shi郎旦AIGaN/GaN
S」
on
A・ chini, G・ Meneghesso,and
D・ Marcon,
E・
(2012) 033505・
J・ Li, Y・ Fang,
Solidi, A209
Status
X. Pan,
Cryst.
M.
Y・ Jiang,
Dun,
cai: Pbys.
Phys.
Threshold
on
J・ Yin, B・ Liu, J・ Wang,
H・ Chen,
Z・ Feng,
and S・
H・ Xiao,
(2012) 1174・
C・ Wang,
C・ Feng,
L・ Jiang,
H・ Yin,
and H・ Chen:
J・
(2011) 29・
S. Todd,
G.
Q.
S. B. Dolmanan,
Lo, and
K・ B・ Lee,
World
S. Tripathy:
L・ Yuan,
Acad・
H・ F・ Sun,
Sci・ Eng・
Selvaraj,
S・ L・
Teclmo1・
69
(2012)
1108.
[19]L.
Xia
[20] S.
L.
and
Selvaraj.A.
[21],P・J・ Hansen,
p. Ibberton,
Lett. 72
J. A. del Alamo:
Watanabe,
Y・ E・ Strausser,
U. Mishra,
Phys・
Appl・
and
Lett・ 95
T・ Egawa:
A・ N・ Erickson,
V・ Narayanamurthi,
Appl・
(2009) 243504・
E・ J・ Tarsa,
S・ P・ DenBaars,
(1998) 2247・
89
Lett・ 98
Phys・
(2011) 252105・
P・ Kozodoy,
and
J・ S・ Speck:
E・ G・ Brazel,
Appl・
Phys・
J・
Chapter-ⅤⅠ: Conclusion
Chapter-ⅤⅠ:
ComclⅦsion
ln this thesis
electron
(TBuf)
the important
undergoes
Also,
degradation・
In
carried
three
and
We
have
drain-source
increase
discussed
DC
leakage
framework
extracts
Vth・▲・
Shi氏as
the device
methodology
buffer
Keyence
measurements
for
stress
and
and
GaN
thicknesses.
3D
laser
microscope
were
out
carried
to
test at pinch
we
de血e
the
the sub-threshold
The
main
by increaslng
off condition
critical voltage
drain
leakage
current
drawn丘om
conclusions
the
as
the
abrupt
is
which
this study
are
below.
AIGaN/GaN
an
HEMT
defects
to the native
TBuf
on
=
2・5
1 00 V. These
is negligible
believed
or
voltage・
due
reveals
different
voltage
step-stress
current
gm-peak Ofthe
there
stress
fわrce microscope,
framework
This
gm-peak, IG-off and
buffer
various
experimental
developed・
with
temperature・
in IDmax, RD, and
above
HEMTs
with
high
failure mechanisms.
at that particular
For
grown
been
substrate
An
different
breakdown
at room
in the gate
irreversible
GaN
atomic
developed
voltage
has
experiments
on
out
discussed.
of AIGaN/GaN
reliability
silicon
like IDmax, RD,
our
terminal
the device
understand
grownon
HEMTs
parameters
of electrical
are
of GaN
electroluminescence,
images
(HEMT)
device
were
conditions
study
MOCVD
using
the reliability
studying
systematic
transistors
mobility
thicknesses
a
the
bright
to be
due
devices
present
devices
also
shi氏in
the
to the
from
occurs
in the vlrgin
the critical voltage
pm,
spot
Si grownwith
on
at
the
increase
show
threshold
sudden
in high
was
voltage
increase
TBuf-
1・25 pm,
the beginnlng
device・
decrease
a
a
In the
case
observed
in IIV and
observed.
in the
and
gate
it is believed
higher
at
transfer
The
to
be
HEMT
ofAIGaN/GaN
drain
bias
stress
but
characteristics
electroluminescence
leakage
electric fleld at the gate edge
90
the degradation
current・
This
of the drain
is
side
ChapteトⅤⅠ: Conclusion
ln
resulting
nOn
TBuf
on
grown
unifbm
electroluminescence
was
no
slgni丘cant
off-state, ON-state
The
4.0
and
shows
a
-
HEMT
On
observed・
HEMTs
and
the pit depth
that apart from
AIGaN
improved.
GaN
changes・
in buffer
shiftof
the
tensile
and
shi氏more
VIh Shifton
further
pit depth of 100
found
that
and
on
that
The
GaN
GaN
thicknesses・
from
This
compressive
strain, respectively.
fresh device
the buffer
strain changed
Vth Shi氏tends
and negative・
the buffer
varylng
devicel・ The
positive
is also influenclng
increaslng
on
However,
to
On
GaN
tensile
positive
applying
with
and also a氏er electrical bias
400
as
The
leakage
depicts
This
degradation・
of GaN
the strain
compressive
reflects
negative.
for
nm・
substrate
thicknesses
electrical
minimum
stress.
to
was
of pits
the quality
strain
and
the number
the device
GaN
and
edge
observed
current.
thickness
in GaN
change
moves
91
and
leakage
drain
current
was
high
as
source
the gate
with
voltage
that
reveals
at the
V
under
45 V.
bias
130
increased
that the
reveal
buffer
in stress
nm
There
5・0トIm
-
leakage
in the gate
at this VD-st,ess
increase
breakdownalong
It is also found
change
On
drain
in pit formation
increase
gm-peak degradation
a
of TBuf
case
higher
at
results
abrupt/sudden
barrier the GaN
it was
Further
5.0トIm
-
characteristics
initiates the device
current
no
out
Also
observed.
the gate-drain reglOn.
gm-peak in the
carried
TBuf
on
increased. The
breakdown
throughout
and
was
voltage
HEMT
-
5.0 um.
-
Critical
AIGaN/GaN
of the
case
0 state condition up to VD_st,ess/
-VG_stress
stress
Hence,
TBuf
grownon
in the
bias
the contrary,
three-terminal
was
-
grown
instead of gate edge.
nO
unifわrm emission
VD_st,ess
and
in the
5.0トLm,
in the IDmax, RD,
change
off-state
AIGaN/GaN
Whereas
emission.
on
for GaN
stress
strain shows
the
with
Vth
the
with
Vth tend
to
negligible
Acknowledgement
l give
all the glory
life to live in this world・
do
opportunity
to
Teclmology,
Japan・
out
doctoral
my
I thank
my
doctoral
Not
only
course
Him
with
degree
He
and
to Lord
thanks
and
me
gave
Christ
heart
all my
to
created
He
and
Nagoya
finish
gave
lnstitute
led
constantly
successfully
me
this wonderful
me
esteemed
this opportunity,
strength
who
for glVlng
this highly
at
me
gave
Jesus
of
through
degree
at
my
me
the
right time.
I thank
career
and
is indeed
my
was
a
big support
a
blesslng
I thank
me
me
丘nancially
laboratory・
JOumey
Egawa
research
He
Of my
doctoral
the
helper.
She
sacriflCed her
journey
of my
Vimala)
for their valuable
Mrs.
and
a
Egawa,
in my
doctoral
life・ I thank
my
God
period.
She
prayers,
Almighty
for
Center
for
He
constantly
teclmicalknowledge
year・
I thank
towards
Akio
Research
of
from
Apart
showed
me
favor
and
he
support,
fわr his
I tha止God
me・
Wakejima,
him
encouraged
goodness,
fわr introducing
in his eyes・
initially
who
me
guided
and
reliability studies・
S・ Lawrence
degree
his student・
as
my血st
Professor
director
the
life and showed
real blesslng
doctoral
me
period・
he
pa血towards
Dr・
is
Takashi
that
Associate
I thank
out
throughout
support
me血oughout
generoslty
I thank
and
fわr accepting
my
supported
Takashi
my
System
throughout
Professor
shown
(Mr・ Amalraj
Professor
and
and
comparable
parents.
thank
kindness
through
my
me.
counseling
Nano-Device
fわr me
parents
wonderful
I
guided
for
my
encouragement,
glVlng
(Jerline)for being
wife
SelvaraJ
ln
my
program・
life・ He
More
92
him
Without
constantly
than
a
guide
I wouldn't
guided
he took
me
end
up
through
personal
ln
out
this
the
interest in
my
life, encouraged
I thank
for two
my
years
and
NGK
and
supported
Insulators
reduced
my
me
Ltd
in various
aspects
of life・
(Nihon Gaishi) for providing
financial
pressure
research.
93
which
helped
me
the scholarship
to concentrate
more
on
AUTHORS
ACCOMPLISHMENTS
A. Publications
in lnternational
1.
reliabilitystudies
"Step-stress
Thickness
2・
Frank
Phys.
"Influence
Wilson,
Appl・
6
of GaN
3・
Frank
Phys.
4・
Phys.
Wilson,
Akio
6
on
Silicon
with
Buffer
=Evaluation
Voltage
Off-State
Wakejima,and
of
Defective
of AIGaN/GaN
Akio
6
Takashi
Egawa,
Shiftin
AIGaN/GaN
Electrical
Bias"
Takashi
Egawa,
HighElectron
(2013) 086504.
Wilson,
Express,
Threshold
Siunder
on
Measurements
Frank
Wakejima,and
on
Appearance
Reliability
AIPl・
HEMTs
(2013) 056501.
Stress
Express,
"0riginand
Amalraj
Akio
Express,
MobilityTransistors
Amalraj
AIGaN/GaN
on
Dependence"
Amalraj
Appl・
Journals:
Pits
High
Wakejima,and
the
at
Electron
Takashi
Gate-DrainRegion
Mobility
during
Transistors
on
Si門
Egawa.
(2013) 116601.
of Electron
Trapplng
of AIGaN/GaN
HEMTwith
ReaトTime
,Speed
Electroluminescence
Akio
and
Wkejima,Amalraj
Pulsed
I-V Measurements門
Frank
Wilson,
Takuya
Egawa,
IEEE
Trans.
Electron
Devices,
60
(2013) 3 183.
94
Joka,
SuguruMase,and
Takashi
B. International
1
・
conferences:
"Step-stress
and
reliability studies
Frank
Wilson,
Heterostructure
"Step-stress
Thickness
Amalraj
Labor
"Effect
Amalraj
ssDM,
Akio
Grown
Wakejima,and
Microelectronics
AIGaN/GaN
Takashi
(TWHM),
reliabilitystudies
HEMTs
on
Sapphire
28th August
AIGaN/GaN
on
Egawa:
Topical
Workshop
on
20 1 1 Japan.
HEMTs
,
on
Silicon
withBuffer
Dependence"
Frank
Wilson,
solid State Devices
3.
MOCVD
Silicon"
Amalraj
2.
on
Center
Wakejima,and
Materials
(WINC AICHI),
of Buffer
Frank
and
Akio
Thickness
Wilson,
26th september
Akio
2012,
on
(SSDM),
Nagoya,
Egawa
28th september
201 1 Aichi
Industryand
HEMTs
Si"
,
Japan.
Degradation
Wakejima,and
Kyoto
Takashi
ofAIGaN/GaN
Takashi
Intemational
95
on
Egawa,
Conference
Center,
Kyoto,
Japan・
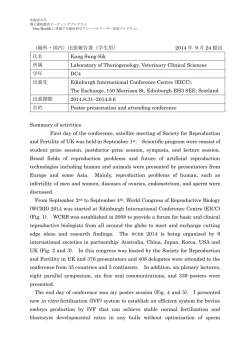

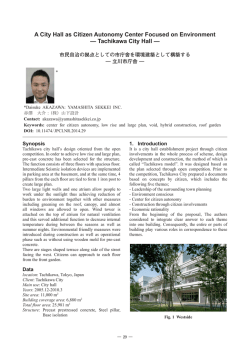


© Copyright 2026