
diagnostic imaging guidelines 2013 e
The Japanese
Imaging
Guideline
2013
Japan Radiological Society (JRS)
Japanese College of Radiology (JCR)
The Japanese imaging guideline 2013
Joint committee for The Japanese Imaging Guideline 2013
● Chairperson
Yasuyuki Yamashita MD
Department of Diagnostic Imaging, Graduate School of Medical Sciences, Kumamoto University
● Vice - chairperson
Yoshiyuki Watanabe MD
Diagnostic and Interventional Radiology, Osaka University Graduate School of Medicine
● Secretariat
Yasushi Kaji MD
Department of Radiology, Dokkyo Medical University
Masako Kataoka MD
Department of Diagnostic Imaging and Nuclear Medicine, Kyoto University
Satoru Takahashi MD
Department of Radiology, Kobe University Hospital
Hiromitsu Hayashi MD
Department of Radiology, Nippon Medical School
Shuichi Monzawa MD
Department of Diagnostic Imaging, Shinko Hospital
● Adviser
Takeo Nakayama MD
Department of Health Informatics, Kyoto University
● Chairperson at subcommittee according to the domain
・Brain and nervous system
Toshinori Hirai MD
Department of Diagnostic Imaging, Graduate School of Medical Sciences, Kumamoto University
・Head and neck
Kazuyuki Kojima MD
Department of Radiology, Kurume University School of Medicine
・Thoracic region
Shuji Sakai MD
Department of Diagnostic Imaging and Nuclear Medicine, Tokyo Women's Medical University
・Cardiovascular region
Naofumi Matsunaga MD
Department of Radiology, Yamaguchi University Graduate School of Medicine
・Gastrointestinal tract(Hepatic and biliary tract)
Kengo Yoshimitsu MD
Department of Radiology, Fukuoka University
・Gastrointestinal tract(Pancreatic)
Toshifumi Gabata MD
Department of Radiology, Kanazawa University Graduate School of Medical Science
・Gastrointestinal tract(Hepatic cancer)
Takamichi Murakami MD
Department of Radiology, Kinki University School of Medicine
・Gastrointestinal tract(Digestive tract)
Yasuyuki Yamashita MD
Department of Diagnostic Imaging, Graduate School of Medical Sciences, Kumamoto University
・Gynecology
Kenji Matsuzaki MD
Department of Radiology, Institute of Health Biosciences, University of Tokushima Graduate School
・Urinary system
Yasushi Kaji MD
Department of Radiology, Dokkyo Medical University
・Breast region
Eriko Tohno MD
Tsukuba Medical Center Hospital
・Musculoskeletal
Yasuhiro Kawahara MD
Department of Radiology, Nagasaki Rousai Hospital
1
The Japanese imaging guideline 2013
00
General statements
1
The Japanese imaging guideline 2013
General statements
❶ On the publication of guidelines for diagnostic imaging
Diagnostic imaging is undoubtedly important in modern medicine, and final clinical decisions are often made based
on it. Fortunately, Japan has the highest numbers of diagnostic imaging instruments such as CT and MRI devices,
and boasts easy access to them as well as a high level of diagnostic accuracy. In consequence, a very large number of
imaging examinations are performed, but diagnostic instruments are installed in so many medical facilities that expert
management of these examinations tends to be insufficient. Particularly, in order to avoid risks, clinicians have recently
become indifferent to indications of imaging modalities and tend to rely on CT or MRI resulting in increasing the
number of imaging examinations in Japan. This is a serious problem from the viewpoints of avoidance of unnecessary
exposure and medical economy.
Under these circumstances, the Japan Radiological Society and Japanese College of Radiology jointly initiated the
preparation of new guidelines for diagnostic imaging. However, the field of diagnostic imaging is extremely wide, and it
is impossible to cover all diseases. Therefore, in drafting the guidelines, we selected important diseases and focused on
“showing evidence and suggestions in the form of clinical questions (CQs)” concerning clinically encountered questions
and “describing routine imaging techniques presently considered to be standards to guarantee the quality of imaging
examinations”. In so doing, we adhered to the basic principles of assuming the readers to be “radiologist specializing
in diagnostic imaging”, “simultaneously respecting the global standards and attending to the situation in Japan”, and
“making the guidelines consistent with those of other scientific societies related to imaging.
As a result, the guidelines became the largest ever, consisting of 152 CQs, 9 areas of imaging techniques, and 7
reviews, but no other guidelines in the world summarize problems concerning diagnostic imaging in the form of CQs.
In this sense, the guidelines are considered to reflect the abilities of diagnostic radiologists in Japan. The contents of
the guidelines are essential knowledge for radiologists, but we believe that they are also of use to general clinicians and
clinical radiological technicians. While the number and contents of CQs are still insufficient, and while chapters such as
those on imaging in children and emergency imaging need to be supplemented, the guidelines will be serially improved
through future revisions.
Lastly, we would like to extend our sincere thanks to the 153 members of the drafting committee who authored the
guidelines, 12 committee chairpersons who coordinated their efforts, 6 members of the secretariat, and affiliates of
related scientific societies who performed external evaluation.
Yasuyuki Yamashita
2
The Japanese imaging guideline 2013
General statements
❷ Evidence levels and recommendation grades
Introduction
In this chapter, a general appraisal of the level of evidence and grading of recommendations are presented. In addition,
the policy of our committee in dealing with problems encountered in the actual process of the guideline development
are explained.
Basic principle of evidence ranking schemes and study design of research papers in the field of diagnostic imaging
Generally, the study design is regarded as an important factor in evidence appraisal. Randomized controlled trials (RCT)
with blinding are ranked as the best evidence because of their research design least affected by biases. According to
the Minds (Medical Information Network Distribution System) Guide for developing Clinical Practice Guidelines 2007
of the Japan Council for Quality Health Care,1) the evidence level is highest for systematic reviews (including metaanalyses) summarizing the results of multiple RCTs, followed by (1 or more) RCT, non-randomized controlled trials,
and analytical or epidemiological studies such as cohort studies and case-control studies.
However, the RCT is a rare research design in the field of diagnostic imaging (except for clinical questions on
mammographic screening for breast cancer and a few other topics). Cohort studies are also rare. In diagnostic
imaging, cross-sectional studies are common since the diagnostic ability (performance of the examination compared
with a reference standard e.g. sensitivity/specificity) of the modality at the time of the study is considered important.
Conventional classifications of evidence were designed for clinical studies of treatment, and papers in the field of
diagnostic imaging tended to be underreated due to difference in study design described above. The Oxford EMB Centre
(OCEBM) proposed a method to evaluate and classify evidence according to clinical questions .2) In this classification,
evidence is evaluated by classifying clinical questions into different categories such as treatment, diagnosis, and
screening. There was also an assessment method specific to diagnostic procedures, which may be applied to papers on
diagnostic imaging. While the early version was difficult to use, a recent revised version was based on the concept that
“the common research design on diagnosis is the cross-sectional study”, and the assessment method finally became a
feasible one. Due to the absence of other relevant classification methods, the present guidelines were developed on the
basis of the OCEBM Levels of Evidence.
Practical steps for evidence level appraisal
The classification workflow can be summarized as follows (See table for details).
1) Systematic reviews of level 2 studies are claasified as level 1.
2) Among cross-sectional studies, those performed with consecutive sampling, consistent reference standard, and
blinding are classified as level 2, that is the highest evidence level for individual studies.
3) Among cross-sectional studies, those that cannot be classified as level 2 due to problems in study design (e.g.,
inconsistency of the reference standard) are classified as level 3.
4) Case-control studies are classified as level 4.
The OCEBM Levels of Evidence were introduced primarily to help busy clinicians to appraise evidence quickly. They
are not suited for detailed assessment of evidence and may not be appropriate for the development of guidelines. The
particular issues raised during guideline development using the OCEBM Level of Evidence, and our solutions are listed
below.
(1) Papers not focusing on imaging findings and those without a reference standard, e.g., those on technical
improvements, could not be evaluated.
Many papers directly related to clinical questions used some reference standard, but some papers necessary for the
understanding of recommendation grades deal with are technical matters. Such papers were included as references but
were not assigned an evidence level.
(2) There was no mention about the level appropriate for systematic reviews/meta-analyses that collected multiple level
3 or 4 studies (cross-sectional studies that cannot be classified as level 2 due to inconsistency or ambiguousness of the
reference standard or lack of consecutive selection of research subjects).
The evidence level of systematic reviews/meta-analyses, which are based on multiple pieces of evidence, is considered
to be higher than that of individual papers, but it is affected by evidence levels of the original papers reviewed. In
principle, the lowest evidence level of the papers included in the review was determined, and the level 1 grade higher
than the lowest level was given to the systematic review/meta-analysis paper.
(3) Regarding the research quality, consecutive sampling, consistency of the reference standard, and blinding were
included in the evidence table, but other criteria (such as umbiguity of the exclusion criteria) are not mentioned in the
table. In this guideline development, priority was given to consistency of standards for leveling, and the evidence level
was not changed, in principle, on the basis of items not included in the evidence table . However, items that were not
3
The Japanese imaging guideline 2013
General statements
included in the criteria for evidence leveling but were considered to important (such as the difference in the research
subjects from those mentioned in the CQ) were taken into consideration in the determination of the recommendation
grade.(* the following footnote is added on the original OCEBM evidence level table; levels may be graded down on
the basis of study quality, imprecision, indirectness, because of inconsistency between studies, or because the absolute
effect size is very small).
(4) There were several reference standards, and their accuracy varied. For example, the accuracy is considered to differ
between pathological diagnoses using surgical samples and those using biopsy samples. If the reference standard varies
among reports, how the results should be evaluated? Generally, the diagnostic ability of biopsy is lower than that of
surgery. However, the possibility of bias is considered to increase with the lack of consistency of the reference standard.
Therefore, in our guideline development, priority was given to the consistency of the reference standard, and the
evidence level was not lowered due to the use of biopsy as the only reference standard if it was commonly used.
Determination of recommendation grades
The recommendation grades were determined according to the Minds Guide for developing Clinical Practice
Guidelines 2007 mentioned above (Table 2). It considers not only the evidence level but also the number of
studies, variation in conclusion, magnitude of clinical efficacy, clinical applicability (ability of physicians, regional
characteristics, medical resources, medical insurance system), and harms and cost. Particularly, in diagnosic imaging,
availability of diagnostic instruments were also taken into consideration as medical resources. In addition, factors
that were not in the evidence level table but were considered to affect the quality of evidence (mentioned in (3) of the
previous section) were also evaluated in the determination of the recommendation grade.
There are particular situation requiring special consideration. Some examinations that have been used for ages,
diagnostic modalities themselves were used as reference standards for the diagnosis, and there have been no study
comparing them with surgical/clinical findings, or, if there are such studies, they were performed before the the concept
of EBM became popular and were of low quality. For example, the evidence concerning the usefulness of CT for the
staging of kidney cancer is unexpectedly scarce, but the modality is in wide clinical use and is recommended in overseas
guidelines. We decided that CT was considered recommendable and graded as A. Some fields with limited number of
evidence, grading was made by members of each subcommittee.
Subjective elements could not be completely excluded, but we aimed to determine recommendation grades appropriate
for the current clinical setting in Japan while based on evidence as much as possible.
The above is a summary of the policy of this committee in evidence level appraisal and recommendation grades in
developing the present guidelines. The methods to evaluateevidence and to developguidelines concerning diagnostic
imaging may change in the future with changes in the study quality. We selected the methods that were considered to be
the most feasible and valid at present.
References
1) Minds Guide for developing Clinical Practice Guidelines 2007: http://minds4.jcqhc.or.jp/minds/glgl/glgl.pdf#search=’GLGL
2) OCEBM level of Evidence: http://www.cebm.net/mod_product/design/files/CEBM-Levels-of-Evidence-2.1.pdf
Table 1 2011 OCEMB Levels of Evidence (excerpts of parts related to the diagnosis)
Question
Level 1
Level 2
Level 3
Level 4
Level 5
Is this
diagnostic or
monitoring test
accurate?
Systematic review
of cross sectional
studies with
consistently applied
reference standard
and blinding
Individual cross
sectional studies
with consistently
applied reference
standard and
blinding
Non-consecutive
studies, or
studies without
consistently applied
reference standards
standard
Case-control
studies, or
poor or
non-independent
reference
Mechanism-based
reasoning
Table 2 Minds recommendation grades
Recommendation grade
A
There is firm scientific evidence strongly recommending the procedure
B
There is scientific evidence recommending the procedure
C1
There is no scientific evidence, but the procedure is recommended.
C2
There is no scientific evidence, and the procedure is disrecommended.
D
4
Description
There is scientific evidence suggesting ineffectiveness or harm, and
the procedure is disrecommended.
The Japanese imaging guideline 2013
General statements
About MINDS
• MINDS(Medical Information Network Distribution Service) is an information service provided by the Japan Council
for Quality Health Care (JCQHC), a public interest incorporated foundation.
• The MINDS project has been financially supported by the Ministry of Health, Labor and Welfare of Japan since its
inception in 2002 through a Grants-in-Aid for Scientific Research from 2002 to 2010 and as a consignment project since
2011.
• The aim of MINDS project is to help medical practitioners to fully utilize the information related to the evidence-based
medicine(EBM) in their practice. MINDS also provides patients and the public with information to help understand the
basics of diseases and to share with their practitioners the up-to-date evidence, on which modern medical practices are
based.
• MINDS functions as a guideline clearinghouse; clinical practice guidelines developed in Japan are formally evaluated
by the guideline evaluation committee, and only those guidelines which meet with the quality standard are disseminated
through the MINDS website.
• Some guideline developers have translated their guidelines into English to share with medical professionals abroad,
and on this page, MINDS provides these English-translated clinical practice guidelines developed in Japan.
5
The Japanese imaging guideline 2013
General statements
❸ CT and MR systems and the state of their operation in Japan
Comparisons with foreign countries
Introduction
CT and MRI play important roles in diagnostic imaging. The development of imaging devices and new imaging
technology/methods has continued uninterruptedly, but an involvement of physicians specializing in diagnostic imaging
is necessary to draw out optimal performance, and make sufficient clinical use, of modalities. In Japan, however, many
CT and MR systems are operated in the absence of a radiologist. Moreover, this tendency has shown no improvement
for 10 years since the beginning of the survey.1)
In Japan CT or MR systems are introduced by the judgment of medical organizations, and no political measures have
been taken about the arrangement or installment conditions of medical instruments. As a result, the numbers of CT and
MR systems per population are markedly higher than in foreign countries, and 60-70% of them are in operation in the
absence of a radiologist. The number of CT or MR examinations in Japan is also high on a global basis. Therefore, it
is necessary to ensure the appropriateness of the implementation of imaging studies and reduce negative elements of
imaging including radiation exposure.
In this chapter, the state of CT and MRI in Japan is compared with that in foreign countries, and its background is
presented.
Comparisons between Japan and foreign countries
Some characteristics of medical imaging in Japan are clarified by comparison of the numbers of operating systems and
examinations with those in foreign countries. Although data concerning foreign countries are limited, the OECD Health
Data are frequently updated and informative. Although the latest edition is OECD Health Data 2011,2) the values shown
in the 2009 edition were used, because the numbers of both systems and examinations were available. Data not found
in the OECD 2011 were supplemented from References 3 and 4 concerning Japan, and the latest values shown by the
OECD were used concerning foreign countries (4 countries) (Table 1).
1) Number of systems
In Japan, data concerning the number of CT systems are often limited to those about MDCT, but the number per 1
million population is highest among 27 countries (54.9 vs. a mean of 21.1). Actually, a considerable number of SDCT
systems are in operation in Japan. According to the latest survey of medical facilities, the number of SDCT systems
was 6,360 in 2008, and the sum with 6,060 MDCT systems was 12,420.5) This means there were 97.4 CT systems per 1
million population, which is about 5 times the mean of various countries. The number of MR systems per population is
the highest among 26 OECD countries (46.8 vs. a mean of 12.4*note).
2) Number of examinations
Data for the number of examinations are available for smaller number of countries. The number of CT annual
examinations per 1,000 population in Japan was the 6th among 17 countries (146 vs. a mean of 122), and that of MR
examinations was the 4th (68 vs. a mean of 45). Japan belongs to the group with a high number of examinations, but the
number is not impressive, considering the very high number of systems (Figure 1).
3) Utilization - Number of annual examinations per system
Annual examinations per unit can be considered to be an index of utilization. It could be compared among 15 countries.
Contrary to the highest number of units, utilization of CT and MR in Japan was reverse in rank of the number of existing
systems. Concerning CT, it was the 3rd from the lowest for MDCT alone (2,662 vs. a mean of 6,730 examinations/
system) and by far the lowest when SDCT was included (1,500 examinations/system). Regarding MR, the utilization
was the second from the lowest (1,447 vs. a mean of 4,665 examinations/system) . For both CT and MR systems, the
utilization was about 1/3 of the mean of foreign countries and near the bottom.
Details of the situation of CT and MR imaging in Japan
In part 1, gross data regarding CT and MR, which can be compared easily among countries, were evaluated. Here, the
state CT and MR imaging in Japan is analyzed into some more detail.
1) Relationships with specialists in diagnostic imaging
The percentage of facilities equipped with CT or MR system with specialists in diagnostic imaging has shown no
overall improvement since 2004, when the survey was initiated. Only about 1/3 of the MDCT systems and 1/3 of all
MR systems are managed by specialists in diagnostic imaging, i.e., 2/3 of the MDCT and MR systems were operating
without the regular presence of specialists in diagnostic imaging.1) In addition, there were wide differences in the
percentage of facilities with specialist among machine types (Figure 2). Images are read by specialists in diagnostic
imaging, but the percentage of CT and MR images read is estimated to be 43% from the number of additions of the
reimbursement of medical fees for the management of imaging diagnosis.4) However, the true figure is considered to
be even lower, because while the examinations are included in the DPC, the addition for the management of imaging
diagnosis is not.
6
The Japanese imaging guideline 2013
General statements
Table 1 Numbers of CT and MR unit, examinations, and, examinations per unit
Population Units per miliion population Exams/year/1,000 population Exams/year/unit
(thousands)
CT
MR
CT
MR
CT
MR
Australia
Austria
Belgium
Canada
Chile
Czech Republic
Denmark
Estonia
Finland
France
Germany
Greece
Hungary
Iceland
Ireland
Israel
Italy
Japan(A)
Japan(B)
Korea
Luxembourg
Mexico
Netherlands
New Zealand
Norway
Poland
Portugal
Slovak Republic
Slovenia
Spain
Sweden
Switzerland
Turkey
United Kingdom
United States
average
21,955
8,363
10,797
33,730
−
10,492
5,519
−
5,339
62,628
81,904
11,283
10,023
319
4,462
59,752
127,510
−
48,747
494
107,551
16,530
4,316
4,829
38,153
10,632
5,418
−
45,929
9,299
7,743
72,050
60,930
306,656
38.7
29.3
−
13.9
−
14.1
23.7
14.9
20.4
11.1
−
33.8
7.2
34.5
15.3
9.4
31.7
54.9
97.4
37.1
26.3
4.3
11.3
14.6
−
12.4
−
13.3
11.9
−
−
32.8
11.6
5.9
18.4
−
8.0
−
5.7
15.4
7.5
16.9
6.4
−
21.7
2.8
21.9
11.9
1.9
21.6
46.8
−
19.0
14.2
1.9
11.0
9.7
−
3.7
−
6.1
4.5
−
−
−
8.9
93.9
−
23.3
−
7.4
34.3
21.1
52.8
43.0
1.7
32.3
37.7
37.2
−
55.2
−
−
−
75.5
−
15.6
−
67.8
−
13.2
73.9
−
43.9
−
−
−
−
29.8
−
−
−
−
67.2
−
91.2
2,426
−
−
9,022
3,949
−
−
5,375
5.6
25.9
179.3
125.4
24.3
87.5
83.8
152.7
−
138.7
−
−
−
156.2
−
122.8
−
146.1
−
93.5
187.0
−
65.7
−
−
−
−
85.4
−
−
−
−
95.8
−
227.9
6,206
3,536
10,248
−
12,495
−
−
−
4,528
−
13,064
−
2,662
1,500
2,520
7,110
−
5,814
−
−
−
−
6,421
−
−
−
−
8,259
−
6,644
5,667
2,448
4,960
−
8,625
−
−
−
3,447
−
8,211
−
1,447
−
695
5,204
−
3,991
−
3,521
12.4
121.5
44.8
6,730
4,665
−
4,885
−
−
−
−
7,551
−
[Note 1] The data concerning foreign countries were cited from the OECD Health Data (primarily the 2009
edition)2), those concerning the number of systems in Japan from New Med Jpn (2009)3), and those
concerning the number of examinations from the Surveys of Medical Care Activities in Public Health
Insurance (2009)4). The values in italics are data supplemented from the OECD Health Data before 2009,
because the data were not presented in the 2009 edition: Belgium 2008, Denmark 2007, United Kingdom
2008, United States 2007.
Also, the data for Japan (A) are the number of MDCT systems alone, 3) and those for Japan (B) are the
sum of MDCT+SDCT systems (cited from the Survey of Medical Institutions 2008).5)
[Note 2] The number of CT examinations was also investigated in the Survey of Medical Institutions (static
analysis), but the values were 30-40% higher than those shown by the Surveys of Social, Medical, and
Clinical Actions of the same years (2008 and 2011).8)
7
The Japanese imaging guideline 2013
General statements
100
200
75
150
50
100
25
50
A
US
Luxemburg
Belgium
Iceland
Estonia
Japan
France
Canada
Israel
Turkey
Australia
Korea
Czech
Slovak
Denmark
Netherlands
Chile
0
0
B
US
Iceland
Luxemburg
Japan
Turkey
France
Belgium
Netherlands
Canada
Denmark
Estonia
Czech
Slovak
Australia
Israel
Korea
Chile
Exams/yr/1,000 population
250
Figure 1: Comparison of the number of examinations between Japan and foreign countries: CT (A) and MR (B)
The annual numbers of examinations per 1,000 population are shown. The black bars represent Japan. The mean is 121.5 for
CT and 44.8 for MR. In Japan, the numbers of CT and MR systems are distinctly high, but the number of examinations per unit is
among the lowest. The data are primarily those in 2009 (See the text).
2) Number of examinations according to the machine type
The number of scans per system (2010)4) varied widely.
As for CT:
• MDCT with 16 or more detector rows… …………
• MDCT with less than 16 detector rows… …………
• SDCT… ……………………………………………
As for MR:
• ≥1.5T… ……………………………………………
• <1.5T… ……………………………………………
2,799 Exams (56%)
1,120 Exams (28%)
675 Exams (17%)
1,961 Exams (67%)
1,108 Exams (33%)
Thus, more than half of both CT and MR examinations were performed using high-performance systems. The number
of SDCT systems was estimated to be 4,383 from the data in 2008,5) assuming that they have been gradually replaced by
more advanced systems.
3) Annual changes in the number of examinations and medical expenditure
The number of CT and MR examinations continued to increase,6) and about 19 million CT examinations and 10 million
MR examinations were performed annually (2010). Since the frequency of imaging examinations increases with the
patient’s age, the number of examinations as a whole is expected to increase at least until 2050 in Japan due to aging of
the population structure despite a decrease in the total population.7)
In the medical fee reimbursement system, CT and MR are categorized together as computed tomography examinations,
and the medical expenditure in this category has continued to increase and topped 500 billion yen, accounting for 60%
of the total expenditure of all diagnostic imaging modalities, in 2010.4,6)
Summary
The number of CT and MR systems in Japan is markedly high compared with that in foreign countries, but utilization
is low and near the bottom. Domestically, also:
• About 2/3 of the CT (MDCT) and MR systems are operating in the absence of full-time specialist in diagnostic imaging.
• Only about 40% of all images are estimated to be evaluated by a specialist at most.
• More than 50% of examinations are performed using high-performance machines (MDCT with 16 or more detector
rows or MR at 1.5T or higher magnetic field strength).
• Due to aging of the population, the number of examinations is expected to increase at least until 2050.
8
The Japanese imaging guideline 2013
General statements
Number of systems
5,000
4,000
4,000
3,000
3,000
2,000
2,000
1,000
1,000
0
0
A
2-14 rows
16-<64 rows
≧64 rows
B
<1.5T
1.5T
≧3T
Figure 2: Facilities with the involvement of full-time radiologist by the types of CT (A) and MR (B) systems
The shaded and white areas are the systems in operation at facilities with and without full-time radiologist, respectively. High
percentages of high-performance machines are in operation with an involvement of full-time radiologist, but only 35 and 36% of
all MDCT and MR systems, respectively, are in operation in the presence of a specialist.1) A longitudinal survey,1) showed little
increase in the involvement of radiologists these 10 years.
References
1) Imamura K et al.: Percentage of facilities with a CT or MR system with a specialist in diagnostic imaging: a longitudinal survey. JCR News 187:
19-24, 2012
2) OECD: OECD health data 2011 (access date 2012-5-1)
3) New Med Jpn. Issues featuring the numbers of CT and MR systems by the machine type (relevant years)
4) Ministry of Health, Labour and Welfare: Surveys of Medical Care Activities in Public Health Insurance (relevant years)
5) Ministry of Health, Labour and Welfare: Survey of Medical Institutions, 2008
6) Imamura K et al.: Changes in the NHI points related to CT and MR: reference materials and discussion. JCR News 188: 13-20, 2012
7) Imamura K et al.: Effects of aging society on diagnostic imaging. JCR News 179: 16-21, 2010
8) Imamura K et al.: The state CT examination, presented again: Japan and foreign countries. JCR News 182: 10-16, 2011
9
The Japanese imaging guideline 2013
General statements
❹ Improving medical services in Japan starting with
radiological practice
Efficiency of medical services in Japan
When the quality of medical services in Japan is measured by international ranking, I am probably not the only one
who is embarrassed by the magnitude of variation of the ranking among items. Medical services in Japan have made
remarkable achievements in mean life expectancy and infant mortality rate, which are among the highest in the world.
However, Japan ranks near the bottom among advanced countries in the number of physicians engaged in medical
services per population (Figure 1). The medical expenditure in Japan relative to GDP stays at the lowest level among
advanced countries (Figure 2). However, access of people to medical services is generally satisfactory, and, despite
some regional differences, patients in urban regions can have access to any department of any medical organization at
a low cost. Such superficial achievements are often cited as grounds for justification of the status quo, but favorably
evaluating the whole on the basis of selected items with good results permanently denies opportunities to reform
weaknesses.
In reality, data that question the efficiency of medical services in Japan are abundant. First, concerning the cost, the
number of visits to medical facilities per patient is highest in Japan (Figure 3), number of beds is highest (Figure 4),
duration of hospital stay is longest (Figure 5), and percentage of the fee of drug prescriptions in the medical expenditure
is in the higher bracket (Figure 6), among the OECD member countries. Japan ranks by far the highest in the number
of CT/MRI systems installed per population (See page 6). In fact, the total number of CT examinations is high, but, as
a result, the dose of medical radiation exposure is conspicuously high among the OECD member countries (discussed
later). On the other hand, the degree of utilization of CT/MRI per unit is near the lowest (See the section, “CT and MR
systems and the state of their operation in Japan” (page 5)). If the total medical expenditure per population in Japan
is still relatively low despite such inefficiency, it would be natural to think that it is due to low unit prices of medical
services. Regarding medical performance, the ranking of Japan varies widely in mortality rate (per 100 thousand people)
due to major diseases (malignant neoplasms, cardiac disorders, cerebrovascular disorders) (Figure 7) or disabilityadjusted life year (Figure 8), which is a measure of overall disease burden to society, according to the disease, and
shows no overall excellence compared with foreign countries.
Problems caused by the present state to Japanese society
As observed above, there seem to be inefficient areas in medical services in Japan that need improvement. Then, what
effects do such weaknesses exert on medical services in Japan? Regarding the radiological diagnosis and treatment, this
question boils down to an increase in medical radiation exposure, delay of implementation of necessary examinations,
and deterioration of the clinical skill of physicians in various clinical departments. Because of the good access to
medical services, outpatient clinics of medical organizations (particularly, those of middle-sized or large hospitals) are
always crowded above the capacity of physicians assigned to outpatient care, allowing the mocking phrase, “waiting
for 2 hours, treated in 5 minutes”. This may be partly due to the patients’ preference for large hospitals, but I would
venture to say, taking the risk of misunderstanding, that the low cost of each visit is a cause of the high frequency of
patient consultations (i.e., high patient-regulated demand). As a result, in hospital outpatient clinics, each physician
must examine 50 or more patients until evening without even taking lunch. An outpatient physician is required to reach
some conclusion about the diagnosis and treatment within 10 minutes for each patient on the initial visit. The physician
makes a medical interview, performs physical examinations, determines an examination plan, explains the plan to
the patient, obtains consent, explains the results to the patient coming back after the examinations, shows possible
diagnoses, explains the treatments, obtains consent, and performs them, all within 10 minutes. The fact that medical
actions are performed in Japan in such a short time can never be understood by physicians in Western countries. If the
situation is explained to them, they would reply that it is impossible to perform the diagnosis and treatment in such a
short time (without mistakes). As patients demand increasingly higher quality of medical services, their tolerance to
medical errors is diminishing, and physicians inevitably rely on imaging diagnostic modalities such as CT and MRI to
quickly reach some conclusion or treatment plan without overlooking problems. The physicians are also prompted to
eliminate buds of medical errors, though their possibility may be low, by resorting to roughly targeted treatments such
as the prophylactic administration of anti-influenza virus agents or antibiotics even when spontaneous cure is expected.
For patients on revisits, administrations are continued, and follow-up examinations are repeated, without carefully
talking to them or reevaluating the prescriptions. Thus, in busy outpatient clinics, radiological examinations, which
are originally supportive diagnostic procedures, have been transformed to low-cost automatic diagnostic devices. The
medical fee reimbursement system may also be promoting orders by conditional reflex. The fees for outpatient care are
paid on a fee-for-service basis, and payments are made even when a physician orders examinations without carefully
evaluating their indications, possibly contributing to an increase in examinations that are unlikely to be necessary.
However, if such practice becomes routine, waiting time for necessary examinations is prolonged. Also, if the number
10
The Japanese imaging guideline 2013
General statements
OECD AVERAGE
United States
United Kingdom
Turkey
Switzerland
Sweden
Spain
Slovenia
Slovak Republic
Portugal
Poland
Norway
New Zealand
Netherlands
Mexico
Luxembourg
Korea
Japan
Italy
Israel
Ireland
Iceland
Hungary
Greece
Germany
France
Finland
Estonia
Denmark
Czech Republic
Chile
Canada
Belgium
Austria
Australia
0.0
1.0
2.0
3.0
4.0
5.0
6.0
7.0 (persons)
OECD database
Figure 1: Number of physicians (per 1,000 people, 2010 or latest)
The number of physicians is low among the OECD member countries.
OECD AVERAGE
United States
United Kingdom
Turkey
Switzerland
Sweden
Spain
Slovenia
Slovak Republic
Portugal
Poland
Norway
New Zealand
Netherlands
Mexico
Luxembourg
Korea
Japan
Italy
Israel
Ireland
Iceland
Hungary
Greece
Germany
France
Finland
Estonia
Denmark
Czech Republic
Chile
Canada
Belgium
Austria
Australia
0.0
2.0
4.0
6.0
8.0
10.0
12.0
14.0
16.0
18.0(%)
OECD database
Figure 2: Medical expenditure (relative to GDP, 2010 or latest)
The medical expenditure is low among developed countries but near the average among the OECD member
countries.
11
The Japanese imaging guideline 2013
General statements
OECD AVERAGE
United States
United Kingdom
Turkey
Switzerland
Sweden
Spain
Slovenia
Slovak Republic
Portugal
Poland
Norway
New Zealand
Netherlands
Mexico
Luxembourg
Korea
Japan
Italy
Israel
Ireland
Iceland
Hungary
Greece
Germany
France
Finland
Estonia
Denmark
Czech Republic
Chile
Canada
Belgium
Austria
Australia
0.0
2.0
4.0
6.0
8.0
10.0
12.0
14.0 (times)
OECD database
Figure 3: Number of outpatient visits (per person, 2010 or latest)
The number of outpatient visits in Japan is at the highest level.
OECD AVERAGE
United States
United Kingdom
Turkey
Switzerland
Sweden
Spain
Slovenia
Slovak Republic
Portugal
Poland
Norway
New Zealand
Netherlands
Mexico
Luxembourg
Korea
Japan
Italy
Israel
Ireland
Iceland
Hungary
Greece
Germany
France
Finland
Estonia
Denmark
Czech Republic
Chile
Canada
Belgium
Austria
Australia
0.0
2.0
4.0
6.0
8.0
10.0
12.0
14.0 (beds)
OECD database
Figure 4: Number of beds (relative GDP, 2010 or latest)
The number of beds in Japan is by far the highest.
12
The Japanese imaging guideline 2013
General statements
OECD AVERAGE
United States
United Kingdom
Turkey
Switzerland
Sweden
Spain
Slovenia
Slovak Republic
Portugal
Poland
Norway
New Zealand
Netherlands
Mexico
Luxembourg
Korea
Japan
Italy
Israel
Ireland
Iceland
Hungary
Greece
Germany
France
Finland
Estonia
Denmark
Czech Republic
Chile
Canada
Belgium
Austria
Australia
0.0
2.0
4.0
6.0
8.0
10.0
12.0
14.0
16.0
18.0
20.0 (days)
OECD database
Figure 5: Mean duration of hospital stay (due to all diseases, 2010 or latest)
The mean duration of hospital stay is long and at the top level among the OECD member countries.
OECD AVERAGE
United States
United Kingdom
Turkey
Switzerland
Sweden
Spain
Slovenia
Slovak Republic
Portugal
Poland
Norway
New Zealand
Netherlands
Mexico
Luxembourg
Korea
Japan
Italy
Israel
Ireland
Iceland
Hungary
Greece
Germany
France
Finland
Estonia
Denmark
Czech Republic
Chile
Canada
Belgium
Austria
Australia
0
5
10
15
20
25
30
35 (%)
OECD database
Figure 6: Expenditures for drugs and medical expendables (relative to total medical expenditure, 2010
or latest)
The expense for drugs is in the higher brackets.
13
The Japanese imaging guideline 2013
General statements
From table 1-33, 2013 Annual Report on Health and
Welfare Ministry of Health, Labour and Welfare of Japan
(persons/100,000)
2,500
cerebrovascular disorders - female
cerebrovascular disorders - male
cardiac disorders (except hypertensive) - female
cardiac disorders (except hypertensive) - male
malignant neoplasms - female
malignant neoplasms - male
2,000
1,500
1,000
500
0
Japan
USA
2010 2007
Korea Singapore France Germany
Itary Nederland Russian Sweden England
2009 2006 2008 2010 2008
2010 2006 2010 2009
Figure 7: Mortality rate (by gender and cause of death) 2010 or latest
The ranking of Japan in the mortality rate varies by disease. The mortality rate due to cerebrovascular
disorders, cardiac disorders, and malignant neoplasms combined ranks in the middle level among
developed countries. disorders, cardiac disorders, and malignant neoplasms combined ranks in the middle
level among developed countries.
(DALYs/1,000 persons/year)
4.5
WHO database
4
3.5
3
2.5
2
1.5
1
0.5
0
Japan
USA
Diarrhoea
Lung cancer
COPD
Other unintentional injuries
Canada
Respiratory infections
Other cancers
Asthma
Intentional injuries
Germany
Italy
Malaria
Neuropsychiatric disorders
Musculoskeletal diseases
Figure 8: Disease burden according to the disability-adjusted life year (2004)
France
UK
Other vector-borne diseases
Cardiovascular disease
Road traffic injuries
The disability-adjusted life year, calculated as the sum of the number of years potentially lost due to early death
caused by disease and the number of years of healthy life lost due to health damage or disability due to disease, is
an index of disease-related loss (burden) of society. It is frequently used to evaluate the order of priority for
improvements in public hygiene or medical services in general. Burden to society is larger as the value is higher.
The ranking of Japan in developed countries varies among diseases, e.g., respiratory diseases, malignant tumors,
and cardiovascular disorders, and shows no striking difference. The superiority of the effects of medical intervention
to diseases in Japan is not obvious compared with other countries.
14
The Japanese imaging guideline 2013
General statements
of examinations increases, the number of outpatient visits increases further, because, due to extreme busyness of the
laboratory and physicians, the examination results are presented on another day. In addition, for diagnostic devices to
be always available, even small medical facilities are required to install them. This results in an increase in the number
of installations of CT/MR devices, and installation of devices in unnecessary numbers leads to low level of utilization
and poor maintenance. Efforts to increase the degree of utilization under such circumstances result in hospital-induced
demand, i.e., the use of devices in patients for whom the examination may be unnecessary and even the general public.
The trap of cost increase due to uniform control of medical fees and necessity of
redistribution of resources for improvements in efficiency
As observed above, the efficiency cannot be improved as expected from attempts to reduce the cost by universal
compression of medical fees. We call this paradox the “trap of cost increase due to uniform control of medical fees”.
Unquestionably, the national budget allocated to medical services is limited, and the state finance is in a critical state due
to long-standing economic stagnation. If such uncontrolled increases in the number of imaging examinations continue,
the government would reasonably be tempted to uniformly cut the budget for diagnostic imaging. Indeed, fees for CT
and MR examinations have been repeatedly cut at each revision of fees for medical services. However, many studies in
Japan and abroad have demonstrated that the policy to universally reduce reimbursement of medical fees is a doubleedged sword that ironically invites rises in the medical cost by provoking demands.1-3) In Japan, also, such uniform
compression of fees for examinations and drugs is accompanied by the risk of promoting excessive use of drugs and
diagnostic tools including CT. If apparently wasteful medical expenditures are difficult to eradicate in Japan, the medical
administration may be caught in the “trap of cost increase due to uniform control of medical fees”. In taking measures
to improve the efficiency of medical services, it is necessary to evaluate the causes of the excessive use of drugs and
diagnostic devices as mentioned above and to remove fundamental causes. In advanced countries such as Japan, the
days when the efficiency of medical services was measured simply in terms of quantity are gone. We are in the era
of quality-oriented assessment of medical services. Regarding radiological services, policies that ensure the highest
payment when 1) a roadmap to mildly invasive and accurate diagnoses with minimum radiation exposure is drawn by
a specialist in diagnostic imaging, 2) examinations are performed using appropriate and quality-controlled devices and
3) protocols, 4) diagnoses are made properly by qualified specialists in diagnostic imaging, 5) treatments based on such
diagnoses are carried out, and 6) patients are rehabilitated through the shortest process are awaited to be implemented.
We consider it necessary to redistribute medical resources to apply proper incentives for movements in such a direction.
Excessive examinations and increases in medical radiation exposure
It is very pleasing for specialists in diagnostic imaging that imaging modalities are appropriately used in clinical
practice. In fact, the use of radiation including CT is undoubtedly making great contributions to improvements in the
people’s hygiene, but the excessive use of radiation for reasons mentioned above is considered to cause adverse effects.
The paper by Barrington de Gonzales that appeared in Lancet in 2004 showed that diagnostic radiation is used most
frequently in Japan among the OECD member countries and that the associated risk of carcinogenesis is also estimated
to be high.4) As this report was featured in Japanese newspaper,5) people began to foster anxiety over medical radiation
exposure, and, responding to such a public mind, the Japan Radiological Society issued an announcement concerning
this problem. In Japan, anxiety of people over health damage due to low-dose radiation exposure is growing further,
particularly, after the accident of the nuclear power plants in Fukushima. However, medical radiation exposure plays a
greater role than nuclear power plants in low-dose exposure in daily life of all Japanese people, and we are obligated to
respond to this anxiety. A symposium on medical radiation exposure was held at the 63rd Annual Meeting of the Japan
Radiological Society in 2004, when the paper by Gonzales et al. attracted attention, and the results were summarized
by the chairman.6) The following are excerpts of the parts of the summary related to the goals of future actions by
radiologists.
(1) To carry out a large-scale fact-finding investigation about the clinical practice of radiology, evaluate its significance,
and transmit the results in Japan and abroad. To call for cooperation in such actions to related scientific societies/
organizations and the government.
(2) To urge the medical society to make judgments in consideration of the patients’ radiation exposure without
sacrificing appropriate diagnostic information in performing radiological diagnosis.
(3) To make efforts in the QC/QA and improvements/development of imaging procedures and instruments in
consideration of reduction of the patients’ radiation exposure.
(4) To initiate the evaluation for appropriate recording of medical radiation exposure in individual patients.
(5) To make the medical staff engaged in radiological diagnosis capable of specifically and appropriately explain
medical radiation exposure, its risk, and safety measures to the patients, their families, and medical staff of other
departments.
(6) To prompt and promote research on low-dose exposure, which is important to improve the understanding of the risk
of low-dose radiation exposure, in cooperation with related scientific societies/organization.
Today, more than 8 years after the proposal, regarding the fact-finding investigation of radiological diagnosis and
15
The Japanese imaging guideline 2013
General statements
treatment, attempts to understand the true state of clinical practice of radiology including questionnaire surveys
are being made by the Japan Radiological Society and Japanese College of Radiology. Also, efforts to reduce the
exposure dose including the application of iterative reconstruction to CT are continued through the industry-academiagovernment cooperation. However, the goals have not been sufficiently achieved. We consider that a large-scale factfinding survey on radiological practice primarily by the Japan Radiological Society or by an external agency consisting
of not only a group of experts including radiologists but also the administration and general people, who are recipients
of medical services, is necessary in an early stage. Along with analysis of the present state, the urge for the preparation
of an environment of medical services in which indications of radiological examinations are evaluated by specialists in
diagnostic imaging, appropriate examination plans using appropriate machines are determined, prompt and appropriate
diagnoses are made, and life-long recording of radiation exposure of individual patients is implemented is considered to
be growing.
Closing comments
Medical services in Japan, which appear to be making considerable achievements at a low cost, also have inefficient
areas and may be improved further by their correction. If radiological practice accounts for a large part of this
inefficiency, we are bound to be more serious in improving the situation.
Summary
1) Hsiao WC: “Marketization”-the illusory magic pill. Health Econ 3: 351-357, 1994
2) Grytten J et al.: Supplier inducement in a public health care system. J Health Econ 14: 207-229, 1995
3) Yamada T et al.: An Econometric Analysis on Supplier Induced Demand Hypothesis. Q Soc Secur Res. 38: 39-51, 2002
4) Berrington de Gonza’lez A, Darby S: Risk of cancer from diagnostic X-rays: estimates for the UK and 14 other countries. Lancet 31; 363
(9406): 345-351, 2004
5) “3.2% of cancer caused by diagnostic exposure”, Yomiuri Simbun, Feb. 10, 2004, front page
6) Sasaki Y: Thoughts about “CT exposure and carcinogenesis”. What those related to radiation in Japan must do. New Med Jpn 31: 45-48, 2004
16
The Japanese imaging guideline 2013
01
Brain and nervous
system
1
The Japanese imaging guideline 2013
1. Brain and nervous system
1
What imaging modalities are appropriate for the
diagnosis of subarachnoid hemorrhage?
Recommendation
grade
A
C1
A Non-contrast CT
C1 MRI
Non-contrast CT is strongly recommended for detection of subarachnoid hemorrhage
in the acute phase.
MRI may be considered if the diagnosis is difficult by non-contrast CT.
Background/objective
Non-traumatic subarachnoid hemorrhage is caused primarily by rupture of cerebral aneurysms, which is an important
cause of stroke. CT is usually used for diagnosis in the acute phase, but as some subarachnoid hemorrhage is falsely
negative on CT (Figure A), a lumbar puncture is necessary for exclusion. There are also reports that MRI, particularly
FLAIR imaging, is more sensitive than CT for the detection of subarachnoid hemorrhage (Figure B). In this section,
the detection rate of subarachnoid hemorrhage is compared between CT and MRI, and their diagnostic usefulness is
evaluated.
Comments
Non-contrast CT is considered to be the principle diagnostic technique for subarachnoid hemorrhage.1) In a study of
evaluating the diagnosis of subarachnoid hemorrhage in 3,132 patients who underwent CT within 6 hours after the
onset of symptoms, radiologists diagnosed subarachnoid hemorrhage with both a sensitivity and specificity of 100%.2)
However, the detection rate of hemorrhage is related to both the severity and time-to-imaging after the onset. The
sensitivity of CT for the detection of subarachnoid hemorrhage is 98-100% within 12 hours after symptom onset, 93%
after 24 hours, 85% after 5 days, 57-85% after 6 days, and 50% after 1 week, showing a decline with time.3-7)
The usefulness of MRI (FLAIR, proton density-weighted, and T2*-weighted imaging) for the diagnosis of
subarachnoid hemorrhage has also been reported. In an evaluation of 22 patients using a 1.5T system, the sensitivities
of FLAIR MRI, T2*-weighted MRI, and CT were 100, 90.9, and 91%, respectively, up to 5 days after symptom onset,
while those of FLAIR MIR and CT decreased to 33.3 and 45%, respectively, and subsequently that of T2*-weighted
MRI increased to 100%.8) Similarly, in an evaluation of 41 patients using a 1.5T system, the sensitivities of T2*-weighted
and FLAIR imaging were reported to be 94 and 81%, respectively, up to 4 days after the onset and 100 and 75%,
respectively, 5-14 days after the onset.9) FLAIR imaging is useful in the acute phase, but as its sensitivity decreases with
time, it is necessary to perform T2*-weighted imaging in addition to FLAIR imaging in the subacute phase. However,
the judgment of whether subarachnoid hemorrhage is new or old is occasionally difficult by T2*-weighted imaging.
The misdiagnosis rate of subarachnoid hemorrhage in the setting of the emergency outpatient clinic is reported to be
5-12%,10,11) and omission of non-contrast CT is a primary cause of misdiagnoses.6) Additionally, about one-fourth of
the patients who develop subarachnoid hemorrhage do not complain of headache and about half show no neurological
abnormalities.1) Therefore, subarachnoid hemorrhage may not be diagnosed even by CT if symptoms at onset are mild
and the volume of hemorrhage is small (i.e. the so-called “sentinel bleed” or “warning leak”).12-14) In a prospective
cohort study of 592 neurologically normal patients with non-traumatic acute headache presenting within 14 days after
symptom onset, the sensitivity and specificity of CT for the detection of subarachnoid hemorrhage were 90 and 99%,
respectively, and a combination of CT and lumbar puncture was suggested to be sufficient to exclude subarachnoid
hemorrhage (sensitivity: 100%, specificity: 67%).14)
In 12 patients in whom subarachnoid hemorrhage was CT occult but diagnosed by positive lumbar puncture, the
FLAIR images obtained using a 1.5T system (within 2 days after CT in 10 and within 1 week in 2) had a false negative
result in 10 patients. This suggests that subarachnoid hemorrhage not detected by CT is also difficult to detect by
FLAIR and that FLAIR images cannot be substituted for lumbar puncture.15) Also, in FLAIR images, the cerebral sulci
and cisterns may show high intensity signal due to causes unrelated to hemorrhage, including meningitis or meningeal
metastasis, acute infarction, moyamoya disease, venous thrombosis, oxygen administration, intravenous anesthesia
using propofol, and artifact.16) Particularly, as ghost artifact is likely to occur in the basal cisterns due to pulsation of
cerebrospinal fluid, FLAIR images must be assessed carefully for the diagnosis of subarachnoid hemorrhage.
2
The Japanese imaging guideline 2013
CQ 001
Figure: Subarachnoid hemorrhage
A Non-contrast CT on the day of symptom
onset. The right sylvian fissure is indistinct
compared with the left and is slightly
hyperdense.
B FLAIR image 1 week after the onset. High
signal intensity is observed in the right sylvian
fissure, which also appeared slightly abnormal
on CT, suggesting subarachnoid hemorrhage.
A
B
Index words and secondary materials used as references
A search of PubMed was performed using “subarachnoid hemorrhage,” “subarachnoid haemorrhage,” “MRI,” “CT,”
“fluid attenuated inversion recovery,” and “FLAIR,” as keywords, returning 310 hits. Documents were further restricted
to those published in and after 2000 and considered to be related to the diagnosis in question. These documents and
documents cited in them were used as references.
References
1) Bederson JB et al: Guidelines for the management of aneurysmal subarachnoid hemorrhage. A statement for healthcare professionals from a
Special Writing Group of the Stroke Council, American Heart Association. Stroke 40: 994-1025, 2009 (Level 5)
2) Perry JJ et al: Sensitivity of computed tomography performed within six hours of onset of headache for diagnosis of subarachnoid haemorrhage: prospective cohort study. BMJ 343: 4277, 2011 (Level 2)
3) Van der Wee N et al: Detection of subarachnoid haemorrhage on early CT: is lumbar puncture still needed after a negative scan? J Neuro
Neurosurg Psychiatry 5: 357-359, 1995 (Level 3)
4) Sames TA et al: Sensitivity of new-generation computed tomography in subarachnoid hemorrhage. Acad Emerg Med 3: 16-20, 1996 (Level 3)
5) Sidman R et al: Subarachnoid hemorrhage diagnosis: lumbar puncture is still needed when the computed tomography scan is normal. Acad
Emerg Med 3: 827-831, 1996 (Level 3)
6) Morgenstern LB et al: Worst headache and subarachnoid hemorrhage: prospective, modern computed tomography and spinal fluid analysis.
Ann Emerg Med 32: 297-304, 1998 (Level 2)
7) Gijn J et al: The time course of aneurysmal haemorrhage on computed tomograms. Neuroradiology 23: 153-156, 1982 (Level 3)
8) Yuan MK et al: Detection of subarachnoid hemorrhage at acute and subacute/chronic stages: comparison of four magnetic resonance imaging
pulse sequences and computed tomography. J Chin Med Assoc 68: 131-137, 2005 (Level 3)
9) Mitchell P et al: Detection of subarachnoid haemorrhage with magnetic resonance imaging. J Neurol Neurosurg Psychiatry 70: 205-211, 2001
(Level 5)
10) Vermeulen MJ et al: Missed diagnosis of subarachnoid hemorrhage in the emergency department. Stroke 38: 1216-1221, 2007 (Level 5)
11) Van Gijn J et al: Subarachnoid haemorrhage: diagnosis, causes and management. Brain 124: 249-278, 2001 (Level 5)
12) Kowalski RG et al: Initial misdiagnosis and outcome after subarachnoid hemorrhage. JAMA 291: 866-869, 2004 (Level 3)
13) Tong DM et al: Predictors of the subarachnoid hemorrhage of a negative CT scan. Stroke 41: e566-567, 2010 (Level 4)
14) Perry JJ et al: Is the combination of negative computed tomography result and negative lumbar puncture result sufficient to rule out subarachnoid hemorrhage? Ann Emerg Med 51: 707-713, 2008 (Level 2)
15) Mohamed M et al: Fluid-attenuated inversion recovery MR imaging and subarachnoid hemorrhage: not a panacea. AJNR 25: 545-550, 2004
(Level 4)
16) Maeda M et al: Abnormal hyperintensity within the subarachnoid space evaluated by fluid-attenuated inversion-recovery MR imaging: a spectrum of central nervous system diseases. Eur Radiol 13: L192-201, 2003 (Level 5)
3
The Japanese imaging guideline 2013
1. Brain and nervous system
2
Which examinations are appropriate for screening of
unruptured cerebral aneurysms?
Recommendation
grade
B
MRA is recommended.
If the information obtained by MRA is insufficient and further evaluation is necessary,
CTA is recommended.
Background/objective
There have been a number of evaluations of the diagnostic utility of cerebral aneurysms by the more invasive digital
subtraction angiography (DSA) examination as a gold standard versus using less invasive computed tomographic
angiography (CTA) or magnetic resonance angiography (MRA) (Figure). In this section, the accuracy of these
examinations for the diagnosis of unruptured aneurysms is reviewed, and examinations recommended for aneurysm
screening are evaluated.
Comments
Diagnosis of cerebral aneurysms by CTA ranges in sensitivity and specificity from 95.0 and 96.2%, respectively,
according to the latest meta-analysis.1) Moreover, its diagnostic ability has been reported to improve with increases
in the number of detector rows: The sensitivity and specificity of 16-detector-row CTA are reported to be 96.9-98.3%
and 97.0-98.0%,1,2) and those of 64-detector row CTA to be 97.8-98.2% and 98.7-100%, respectively. 1,3) Moreover,
evaluations using dual-energy CT have recently been carried out, and a similar diagnostic power has been reported.4) It
has also been reported that the likelihood of clinically important cerebral aneurysm is very low if CTA is negative on
screening for unruptured cerebral aneurysms.5) Therefore, CTA is an excellent modality for the diagnosis of cerebral
aneurysms.
As for MRA, a systematic review primarily of reports using 0.5-1.5T systems in the 1990s reported that the sensitivity
and specificity were 87 and 95%, respectively. The size of cerebral aneurysms is considered a risk factor of rupture, and,
according to a subgroup analysis, the sensitivity for detecting cerebral aneurysms exceeding 3 mm in diameter was 94%.6)
With the recent increase in the availability of 3T systems, the effects of differences in the strength of magnetic field on
detection power has also been evaluated in a limited number of subjects.7) A recent study using a 3T system has reported
the sensitivity and specificity to be 99.3 and 96.9%, respectively,8) and the precision of MRA using a stronger magnetic
field is considered to be comparable to that of DSA. Therefore, MRA is also an excellent modality for screening of
cerebral aneurysms.
Regarding direct comparison between CTA and MRA, it was reported in the early 2000s that there was no significant
difference in the sensitivity between 1.5-2T MRA and CTA9) and alternatively that CTA was more sensitive although
there was no significant difference in the specificity.10) Concerning the comparison between the recent 3T MRA and
64-detector row CTA, the sensitivity and specificity were reported not to differ significantly,11) and CTA and MRA using
the latest equipment perform similarly in the diagnosis of cerebral aneurysms.
While CTA has advantages such as the short scanning time and less artifact, it has disadvantages such as the use of a
contrast agent, radiation exposure, and necessity of 3-dimensional reconstruction for distinction from bony structures.
Although MRA is free from these problems, it has problems such as the presence of contraindications, long scanning
time, signal attenuation due to turbulent flow and in areas with a low flow rate, and poor diagnostic power of low
compared with high magnetic field systems.12) There are pluses and minuses of each examination. However, for
screening of unruptured cerebral aneurysms, it is recommended to perform MRA first using a high magnetic field (≥1.5T)
MR system because of its low invasiveness and then to perform CTA if further evaluation is necessary. In addition,
MRA is considered preferable for the follow-up of unruptured cerebral aneurysms in terms of invasiveness and radiation
exposure.
Index words and secondary materials used as references
A search of PubMed was performed using “cerebral”, “intracranial”, “aneurysm”, “CT”, and “MRA” as key words,
and the Japana Centra Revuo Medicina was searched using cerebral aneurysm, digital subtraction angiography, DSA,
CTA, and MRA as key words.
References
1) Menke J et al: Diagnosing cerebral aneurysms by computed tomographic angiography: meta-analysis. Ann Neurol 69: 646-654, 2011 (Level 2)
2) Chen W et al: Application of multislice computed tomographic angiography in diagnosis and treatment of intracranial aneurysms. Clin Neurol
4
The Japanese imaging guideline 2013
CQ 002
A
B
Figure: Aneurysm of the anterior communicating artery
A Maximum intensity projection (MIP) image of MR angiography
B Volume-rendered image of CT angiography
Neurosurg 112: 563-571, 2010 (Level 2)
3) Xing W et al: Sixty-four-row multislice computed tomographic angiography in the diagnosis and characterization of intracranial aneurysms:
comparison with 3D rotational angiography. World Neurosurg 76: 105-113, 2011 (Level 2)
4) Lv F et al: Detection and characterization of intracranial aneurysms with dual-energy subtraction CTA: comparison with DSA. Acta Neurochir
Suppl 110: 239-245, 2011 (Level 4)
5) Van Gelder JM: Computed tomographic angiography for detecting cerebral aneurysms: implications of aneurysm size distribution for the sensitivity, specificity, and likelihood ratios. Neurosurgery 53: 597-605, 2003 (Level 2)
6) White PM et al: Can noninvasive imaging accurately depict intracranial aneurysms? A systematic review. Radiology 217: 361-370, 2000 (Level
2)
7) Gibbs GF et al: Improved image quality of intracranial aneurysms: 3.0-T versus 1.5-T time-of-flight MR angiography. AJNR 25: 84-87, 2004
(Level 2)
8) Li MH et al: Contrast-free MRA at 3.0 T for the detection of intracranial aneurysms. Neurology 77: 667-676, 2011 (Level 2)
9) White PM et al: Intracranial aneurysms: CT angiography and MR angiography for detection prospective blinded comparison in a large patient
cohort. Radiology 219: 739-749, 2001 (Level 2)
10) Deguchi J: Methods to detect unruptured cerebral aneurysms using MR angiography and 3D-CT angiography on brain screening. J Osaka
Med Coll 59:158-167, 2000 (Level 2)
11) Hiratsuka Y et al: Diagnosis of unruptured intracranial aneurysms: 3T MR angiography versus 64-channel multi-detector row CT angiography.
Magn Reson Med Sci 7: 169-178, 2008 (Level 2)
12) Korogi Y et al: MR angiography of intracranial aneurysms: a comparison of 0.5 T and 1.5 T. Comput Med Imaging Graph 21: 111-116, 1997
(Level 3)
5
The Japanese imaging guideline 2013
1. Brain and nervous system
3
Which imaging modalities are appropriate for the
diagnosis of acute intracerebral hemorrhage?
Recommendation
grade
A
Non-contrast CT is strongly recommended to evaluate the presence or absence of
intracerebral hemorrhage.
Background/objective
While non-contrast CT has been used widely for the diagnosis of stroke because of its high detection power for brain
hemorrhage and its versatility, MRI has also been increasingly used for the diagnosis of stroke as it has become more
available in Japan (Figure). However, it is unclear whether or not MRI can replace non-contrast CT as a modality for
the diagnosis of acute intracerebral hemorrhage. The diagnostic power of non-contrast CT and MRI, imaging modalities
used for the diagnosis of acute stage intracerebral hemorrhage, was evaluated.
Comments
1) CT
Intracerebral hemorrhage accounts for about 20% of stroke, and the presence or absence of such hemorrhage is
important for therapeutic decision making in stroke patients. While the sensitivity and specificity for detecting
subarachnoid hemorrhage using lumbar puncture as a gold standard have been reported, such data for intracerebral
hemorrhage relies only on reports from the 1970s comparing findings using early models of CT scanners with surgery
and autopsy findings.1,2) Thus, there is no sufficient data regarding the sensitivity or specificity of non-contrast CT for
the diagnosis of acute intracerebral hemorrhage. Nevertheless, non-contrast CT has been accepted and used widely to
the present as the first line examination for detecting acute intracerebral hemorrhage.3-6) However, it must be noted that
the ability to detect intracerebral hemorrhage is affected by factors including the time from symptom onset, site and size
of hematoma, and hematocrit.
2) MRI
There have been few reports comparatively evaluating MRI sequences for detecting intracerebral hemorrhage,7)
and evidence concerning which procedure is preferable is insufficient. With the change from oxyhemoglobin to
deoxyhemoglobin after hemorrhage, the appearance of acute hemorrhage changes from an iso-intensity to slightly highintensity area on T1-weighted imaging but from a high-intensity to low-intensity area on T2*-weighted and diffusionweighted imaging. Additionally, T2*-weighted imaging (gradient-echo sequence) is considered to be useful for the
diagnosis of acute stage hemorrhage, because it depicts oxyhemoglobin as an iso-intense or high-intense signal but
deoxyhemoglobin, which is a paramagnetic material, has a markedly hypo-intense signal due to magnetic susceptibility
effects.5)
In a study that retrospectively evaluated 43 patients with hemorrhagic stroke and 43 patients with non-hemorrhagic
stroke (41 with arterial cerebral infarction and 2 with transient ischemic attack), the sensitivity and specificity of T2*weighted imaging were 100 and 95-97.5%, respectively. On T2*-weighted imaging, chronic hemorrhage was judged
to be acute hemorrhage in 1 patient.7) In a report that prospectively evaluated 217 stroke patients, acute intracerebral
hemorrhage was observed in 12 patients, and the sensitivity and specificity of T2*-weighted imaging (or diffusionweighted imaging at b=0 if the quality of T2*-weighted images was poor) for the diagnosis of acute stage intracerebral
hemorrhage using non-contrast CT as a reference standard were 83 and 100%, respectively.8)
According to a study of 200 patients suspected to have stroke within 6 hours after symptom onset, acute hemorrhage
was detected by both CT and MRI in 25 patients and by MRI alone in 4, who all showed hemorrhagic changes in
ischemic areas. Acute hemorrhage was detected by CT alone and was diagnosed to be chronic hematomas on MRI in
3. In 1 patient, a small volume of subarachnoid hemorrhage was detected by CT but not by MRI. Chronic hemorrhage
was noted on MRI alone in 52 patients but was difficult to detect on CT. The agreement rate of the diagnosis of acute
hemorrhage among readers was higher on CT.9)
In 62 patients with acute brain hemorrhage within 6 hours after symptom onset, the sensitivity and specificity of MRI
using non-contrast CT as a gold standard were both 100% in physicians experienced in diagnostic imaging of stroke.5)
However, the accuracy of the diagnosis of hemorrhage by MRI is considered to vary with experience, and expertise is
necessary for diagnosing acute stage brain hemorrhage by MRI.5) If the time of onset is unclear, or if MRI findings are
inconclusive, confirmation by CT is important.
Presently, there is no evidence that supports the superiority of MRI compared with CT for the evaluation of acute
intracerebral hemorrhage, and they are often reported to be comparable. Particularly, in critically-ill patients, these
procedures must be performed in consideration of restriction of body movements and changes in the vital signs during
6
The Japanese imaging guideline 2013
CQ 003
A
C
B
Figure: Acute hemorrhage of the thalamus 3 hours after the onset
A Non-contrast CT
B MRI T1-weighted image
C MRI T2-weighted image
the examination.8)
Index words and secondary materials used as references
A search of PubMed was performed using “CT”, “MRI”, “imaging”, “stroke”, “hemorrhage”, “guideline”, and
“systematic review” as keywords. The Guidelines for Diagnostic Imaging of Cerebrovascular Disorders (http://mrad.
iwate-med.ac.jp.guideline/), ACR Appropriateness Criteria® on cerebrovascular disease, Magnetic resonance imaging
versus computed tomography for detection of acute vascular lesions in patients presenting with stroke symptoms were
reviewed. Cochrane Database Syst Rev (4): CD007424, 2009, Vo KD et al: Neuroimaging in acute ischemic stroke, (in)
Evidence-based Imaging. Springer, New York, 2001 were also used as references.
References
1) Paxton R, Ambrose J: The EMI scanner. A brief review of the first 650 patients. Br J Radiol 47: 530-565, 1974 (Level 4)
2) Jacobs L et al: Autopsy correlations of computerized tomography: experience with 6,000 CT scans. Neurology 26: 1111-1118, 1976 (Level 4)
3) Tissue plasminogen activator for acute ischemic stroke. The National Institute of Neurological Disorders and Stroke rt-PA Stroke Study Group.
N Engl J Med 333: 1581-1587, 1995 (No applicable level)
4) Hacke W et al: Randomised double-blind placebo-controlled trial of thrombolytic therapy with intravenous alteplase in acute ischaemic stroke
(ECASS II). Second European-Australasian Acute Stroke Study Investigators. Lancet 352: 1245-1251, 1998 (Level 5)
5) Fiebach JB et al: Stroke magnetic resonance imaging is accurate in hyperacute intracerebral hemorrhage: a multicenter study on the validity of
stroke imaging. Stroke 35: 502-506, 2004 (Level 2)
6) Latchaw RE et al: Recommendations for imaging of acute ischemic stroke: a scientific statement from the American Heart Association. Stroke
40: 3646-3678, 2009 (Level 5)
7) Oppenheim C et al: Comparison of five MR sequences for the detection of acute intracranial hemorrhage. Cerebrovasc Dis 20: 388-394, 2005
(Level 4)
8) Chalela JA et al: Magnetic resonance imaging and computed tomography in emergency assessment of patients with suspected acute stroke: a
prospective comparison. Lancet 369: 293-298, 2007 (Level 2)
9) Kidwell CS et al: Comparison of MRI and CT for detection of acute intracerebral hemorrhage. JAMA 292: 1823-1830, 2004 (Level 2)
7
The Japanese imaging guideline 2013
1. Brain and nervous system
4
What imaging modalities are appropriate for
evaluating the brain prior to initiation of thrombolytic
therapy in patients with acute cerebral infarction?
Recommendation
grade
A
B
C1
A Non-contrast CT
B Evaluation of early ischemic changes (EIC) by non-contrast CT
C1 MRI
Non-contrast CT is useful for excluding hemorrhage and is strongly recommended.
The evaluation of EIC by non-contrast CT using the Alberta Stroke Program Early
CT Score (ASPECTS) is useful for the evaluation prior to thrombolytic therapy and
establishing prognosis and is recommended.
Diffusion-weighted MR imaging should be considered because it does not delay
treatment and is sensitive for the detection of ischemic lesions compared with CT.
Background/objective
Since intravenous injection of a recombinant tissue plasminogen
activator (rt-PA, alteplase) became covered by insurance in Japan in
2005, the demand for diagnostic imaging in patients suspected to have
acute stage cerebral infarction has increased. However, no consensus
about indications of the imaging for thrombolytic therapy has been
reached. Recently, transarterial thrombectomy using a catheter has
been approved and begun to be performed more frequently. We
evaluate the usefulness of imaging modalities, particularly non-contrast
CT and MRI, for the pretreatment evaluation for planned thrombolytic
therapy using intravenous rt-PA.
Comments
Presently in Japan intravenous injection of rt-PA is indicated
for acute
1
cerebral infarction within 4.5 hours after the onset*Note1 ) at 0.6 mg/kg,
a dose smaller than in Western countries. However, the Guidelines
for Appropriate Intravenous rt-PA Infusion Therapy1) issued by the
Committee on Medical Improvements and Social Insurance of the
Japan Stroke Society showed that this regimen is comparable in
efficacy and safety to 0.9 mg/kg in Western populations on the basis of
a clinical trial in Japan.2)
For the prediction of the effectiveness of thrombolytic therapy, it is
important to evaluate the potential area that would be salvaged upon
reestablishment of the blood flow following treatment (penumbra).
In the above mentioned guidelines, there are exclusion criteria and
relative contraindications, but concerning diagnostic imaging only
exclusion of other disorders and intracranial hemorrhage by noncontrast CT or MRI is required, and no guidelines concerning the
penumbra have been established.
Non-contrast CT has excellent sensitivity to acute stage intracranial
*Note: Western countries and Australia revised guidelines since
2010 and recommended to widen the indication of rt-PA intravenous
infusion therapy to stroke within 3-4.5 hours after the onset. In Japan,
also, on the basis of the results of integrated analysis of multiple
meta-analyses,17) the insurance coverage of the administration of this
dug was widened to stroke 3-4.5 hours after the onset in September
2012. In association, the Guidelines for Appropriate Intravenous rt-PA
(Alteplase) Infusion Therapy was revised, and a new guideline about
the administration within 4.5 hours was issued.18)
8
Figure 1: Early ischemic changes (EIC)
CT 2.5 hours after the onset
→ : Obscuration of the insular cortex,
▲ : Obscuration of the cortico-medullary
junction is observed. As EIC, obscuration
of the lentiform nucleus, loss of the insular
ribbon, loss of gray-white differentiation, and
effacement of the cortical sulci are known.
The Japanese imaging guideline 2013
CQ 004
Figure 2: ASPECTS study form
(Lancet 355: 1670-1674, 2000)
The region supplied by the unilateral middle
cerebral artery is divided into 10 areas, the
presence or absence of EIC is evaluated
in each area, and the findings are scored
by a point-deduction method. The score
is 10 if no EIC are observed and 0 if EIC
are observed in the entire MCA region. C:
Head of the caudate nucleus, L: Lentiform
nucleus, IC: Posterior limb of internal
capsule, I: Insular cortex, M1-M3: MCA
region (basal ganglion level), M4-M6: MCA
region (corona radiata level).
M4
M1
C
L
Ic
I
M2
M3
M5
M6
hemorrhage and is very useful for the exclusion of intracranial hemorrhage. Diagnosing the extent of EIC (Figure 1) is
important for establishing indication for thrombolytic therapy. The guidelines recommend to evaluate the presence or
absence of EIC because a favorable prognosis is expected if the extent of EIC is 1/3 or less of the area supplied by the
middle cerebral artery (MCA) (the 1/3 MCA rule),3,4). However, there is no clear definition of what constitutes EIC or
vascular territories, and the interpretations vary among examiners5). Therefore the American Heart Association/American
Stroke Association (AHA/ASA) guidelines6) recommend ASPECTS. ASPECTS (Figure 2) divides the MCA territory
into 10 areas, evaluates EIC in each area, and scores them with the maximum score being 10.7) It is a relatively simple
method and shows a higher inter-rater agreement rate than the 1/3 MCA rule.8) The PROACT-II9) and NINDS trials10)
reported that the functional outcome 90 days after the rt-PA administration was more favorable than in the control
group if the ASPECTS on the initial CT was >7) and that the mortality rate was reduced by the rt-PA administration.10)
However, both evaluation methods were limited to the MCA region, and the appropriateness of the scoring design (e.g.,
the scores are distributed evenly regardless of whether the area is functional or non-functional) has not been sufficiently
validated. The evaluation method for regions other than the MCA has not been established.
There are also reports that the evaluation methods themselves are not useful for the selection of treatments,10,11) and the
assessment of the penumbra for the pretreatment evaluation prior to thrombolytic therapy by non-contrast CT alone has
limitations.
An advantage of performing MRI for the diagnosis of acute stage cerebrovascular disorders is that diffusion-weighted
imaging (DWI) can be performed (Figure 3). Mildly high intensity areas observed on DWI may be reversible, and their
significance has not been established, but infarct areas can be clearly diagnosed from an early stage with small inter-rater
variability. Also, as DWI has excellent sensitivity to small lesions in the brainstem, cerebellum, cortex, and subcortical
areas, its diagnostic ability for acute cerebral infarction is considered high. It has been reported that, when high intensity
areas observed in DWI were rated using the ASPECTS (DWI-ASPECTS), the DWI-ASPECTS was about 1 point lower
than CT-ASPECTS and that, while both scores were useful for the prediction of symptomatic brain hemorrhage after
treatment and functional outcome after 3 months, the prediction using the DWI-ASPECTS was more accurate.12)
Presently, indication for thrombolysis are evaluated by DWI using the same criteria as CT. While the evaluation by
MRI early after the onset (for example, within 4.5 hours) is expected to reduce the risk of symptomatic hemorrhage
after treatment, no marked difference is observed in outcomes, and the establishment of criteria for indications for MRI
including DWI is necessary.
In MRI, the penumbra is often evaluated as the difference in the ischemic area between DWI and perfusion-weighted
imaging (PWI) (so-called DWI/PWI mismatch). There have been a number of reports on this DWI/PWI mismatch, but
a problem is that the procedure and evaluation criteria of PWI are diverse and lack a standard method. Arterial spin
labeling (ASL) performed without a contrast agent and dynamic susceptibility contrast (DSC) imaging performed by
rapid intravenous injection of a contrast agent are known as PWI procedures, but the spread of ASL is hampered by
the scarcity of facilities that can perform it. In 2 recent large-scale studies using DSC imaging in which the therapeutic
effect of rt-PA was compared in patients with cerebral infarction within 3-6 hours after the onset, the mismatch was
defined as a decrease in the cerebral blood volume of ≥10 ml (delay of Tmax ≥8 s) on PWI and a high signal area on
DWI of 120% or larger than the low blood flow area on PWI. When early reperfusion was achieved, the outcome was
more favorable in patients with than without mismatch (odds ratio: 5.4, p=0.039),13) the spread of the infarct area was
smaller, and reperfusion was observed more frequently, after 90 days in the rt-PA group compared with the placebo
group.14)
However, PWI is not generally performed at many Japanese facilities, and standardization of the procedure and
evaluation method is necessary for the evaluation of indications according to mismatch. As for methods to evaluate the
9
The Japanese imaging guideline 2013
1. Brain and nervous system
Figure 3: Acute stage cerebral
infarction The patient developed
the disease with disturbance of
consciousness and left hemiplegia
during hospitalization due to heart
failure. (NIHSS at the onset: 29)
B
A
A CT: CT 50 minutes after the onset
B DWI: MRI 70 minutes after the onset
EIC were observed diffusely in the right
hemisphere on both initial CT and DWI,
but the ischemic area can be more clearly
determined by DWI. The ASPECTS was 3
on both CT and DWI. Since there was no
indication for rt-PA therapy, the patient was
observed. CT on the next day showed a
clear low density area in the same region.
penumbra other than PWI, the estimation of the penumbra has been attempted using DWI-MRA mismatch, DWI-clinical
mismatch, and DWI-FLAIR mismatch, but no clear evidence has been established. Regarding DWI-FLAIR mismatch,
whether or not the time of onset can be estimated from the presence or absence of high signals on FLAIR and DWI
findings was evaluated, and it was reported that mismatch was not sensitive for identifying ischemia within 4.5 hours
after the onset but showed high specificity and positive predictive value.15) Therefore, the penumbra may potentially be
evaluated by modalities other than PWI in the future.
MRI also shows a high detection power for acute stage intracranial hemorrhage (see the chapter on brain hemorrhage
for details). It is particularly effective for detecting microbleeds (MBs), but the evaluation of the relationship between
the presence of MBs and hemorrhagic complications after thrombolytic therapy remains insufficient. In a small-scale
study, the relationships among the number of MBs before treatment, presence or absence of symptomatic hemorrhage
1-3 days after treatment, and hemorrhagic changes were evaluated retrospectively in patients with acute stage brain
ischemia who underwent intravenous rt-PA infusion or intra-arterial urokinase infusion within 6 hours after the onset,
and no correlation was reported between the number of MBs and symptomatic hemorrhage after treatment or between
the presence or absence of MBs and hemorrhagic changes.16)
The penumbra evaluated by MRI is expected to be useful as an index for evaluation of need for thrombolytic therapy
in patients in whom the time after the onset is within 4.5 hours or unknown. However, if the initiation of treatment may
be delayed by performing MRI, the evaluation using CT is recommended.
Index words and secondary materials used as references
A search of PubMed was performed using “acute ischemia”, “thrombolysis”, “brain”, “CT”, and “MRI” as keywords.
Also, the Guidelines for Appropriate Intravenous rt-PA (Alteplase) Infusion Therapy edited by the Intravenous rtPA (Alteplase) Therapy Guidelines Subcommittee, Committee on Medical Improvements and Social Insurance of the
Japan Stroke Society, Japanese Guidelines for the Management of Stroke 2009 edited by the Joint Stroke Guidelines
Committee, AHA/ASA guidelines for the early management of patients with ischemic stroke, and the Cochrane
Collaboration were used as references.
References
1) Intravenous rt-PA (Alteplase) Therapy Guidelines Subcommittee, Committee on Medical Improvements and Social Insurance of the Japan
Stroke Society: Guidelines for Appropriate Intravenous rt-PA (Alteplase) Infusion Therapy (October 2005). Stroke 27: 327-354, 2005 (Level 5)
2) Yamaguchi et al: Japan Alteplase Clinical Trial (J-ACT) Group. Alteplase at 0.6 mg/kg for acute ischemic stroke within 3 hours of onset: Japan
Alteplase Clinical Trial (J-ACT). Stroke 37: 1810-1815, 2006 (Level 2)
3) Von Kummer R et al: Acute stroke: usefulness of early CT findings before thrombolytic therapy. Radiology 205: 327-333, 1997 (Level 2)
4) Hacke W et al: Randomised double-blind placebo-controlled trial of thrombolytic therapy with intravenous alteplase in acute ischaemic stroke
(ECASS II). Second European-Australasian Acute Stroke Study Investigators. Lancet 352: 1245-1251, 1998 (Level 2)
5) Grotta JC et al: Agreement and variability in the Interpretation of Early CT Changes in Stroke Patients Qualifying for Intravenous rtPA Therapy.
Stroke 30: 1528-1533, 1999 (Level 3)
6) Adams H et al: Guidelines for the Early Management of Patients with Ischemic Stroke 2005 Guidelines update. A Scientific Statement From
the Stroke Council of the American Heart Association/American Stroke Association. Stroke 36: 916-923, 2005 (Level 5)
7) Barber PA et al: Validity and reliability of a quantitative computed tomography score in predicting outcome of hyperacute stroke before throm-
10
The Japanese imaging guideline 2013
CQ 004
bolytic therapy. ASPECTS Study Group. Alberta Stroke Programme Early CT Score. Lancet 355: 1670-1674, 2000 (Level 2)
8) Pexman JH et al: Use of the Alberta Stroke Program Early CT Score (ASPECTS) for assessing CT scans in patients with acute stroke. AJNR
22: 1534-1542, 2001 (Level 3)
9) Hill MD et al: Selection of acute ischemic stroke patients for intra-arterial thrombolysis with pro-urokinase by using ASPECTS. Stroke 34: 19251931, 2003 (Level 2)
10) Demchuk AM et al: Importance of early ischemic computed tomography changes using ASPECTS in NINDS rtPA Stroke Study. Stroke 36:
2110-2115, 2005 (Level 2)
11) Patel SC et al: Lack of clinical significance of early ischemic changes on computed tomography in acute stroke. JAMA 286: 2830-2838, 2001
(Level 2)
12) Nezu T et al: Early ischemic change on CT versus diffusion-weighted imaging for patients with stroke receiving intravenous recombinant
tissue-type plasminogen activator therapy: stroke acute management with urgent risk-factor assessment and improvement (SAMURAI) rt-PA
registry. Stroke 42: 2196-2200, 2011 (Level 2)
13) Albers GW et al: Magnetic resonance imaging profiles predict clinical response to early reperfusion: the diffusion and perfusion imaging evaluation for understanding stroke evolution (DEFUSE) study. Ann Neurol 60: 508-517, 2006 (Level 2)
14) Davis SM et al: Effects of alteplase beyond 3 h after stroke in the Echoplanar Imaging Thrombolytic Evaluation Trial (EPITHET): a placebocontrolled randomised trial. Lancet Neurol 7: 299-309, 2008 (Level 2)
15) Thomalla G et al: DWI-FLAIR mismatch for the identification of patients with acute ischaemic stroke within 4.5 h of symptom onset (PREFLAIR): a multicentre observational study. Lancet Neurol 10: 978-986, 2011 (Level 2)
16) Kim HS et al: Multiple cerebral microbleeds in hyperacute ischemic stroke: impact on prevalence and severity of early hemorrhagic transformation after thrombolytic treatment. AJR 186: 1443-1449, 2006 (Level 2)
17) Lees KR et al: Time to treatment with intravenous alteplase and outcome in stroke: an updated pooled analysis of ECASS, ATLANTIS, NINDS,
and EPITHET trials. Lancet 15: 695-703, 2010 (Level 1)
18) Intravenous rt-PA (Alteplase) Therapy Guidelines Subcommittee, Committee on Medical Improvements and Social Insurance of the Japan
Stroke Society: Guidelines for Appropriate Intravenous rt-PA (Alteplase) Infusion Therapy, Second Edition (October 2012). (Level 5)
11
The Japanese imaging guideline 2013
1. Brain and nervous system
5
Is CT appropriate for children with minor head
trauma?
Recommendation
grade
D
In children with minor head trauma, the risk of intracranial injury should be evaluated
using criteria such as the CHALICE rule, and CT should not be performed if the risk is
low.
Background/objective
Head injuries in children are often encountered at the emergency outpatient clinic, and most are mild and can be
managed by observation alone. Abnormalities are observed in few patients on CT, and those that require surgery
are even fewer. Whether or not CT is necessary for children with minor head trauma and what patients need CT are
evaluated.
Comments
Studies to evaluate the risk of intracranial injury in patients with minor head trauma and to define indications for
CT have been performed over many years, but the results have varied. No consensus has been reached regarding
what patients should undergo CT.1-8) Recently, a few large-scale studies have been carried out, and criteria with a high
evidence level have been presented.
Dunning et al. performed a cohort study in 22,772 patients with head injuries aged 2-16 years and prepared the
Children’s head injury algorithm for the prediction of important clinical events (CHALICE) rule9,12) (Table). According
to this rule, the risk of intracranial injury is considered to be high and requiring CT when any of the following conditions
is met: Loss of consciousness (LOC) of >5 min duration, history of amnesia of >5 min duration, abnormal drowsiness, ≥3
vomits, suspicion of abuse, seizure in a patient with no history of epilepsy, GCS <14, GCS <15 in those aged <1 year,
suspicion of penetrating or depressed skull injury or tense fontanelle, signs of basal skull fracture (ear bleeding, panda
eyes, CSF leakage, Battle’s sign), neurological abnormalities, subcutaneous hematoma or bruise ≥5 cm in diameter in
those aged <1year, and severe mechanism of injury. The CHALICE rule shows high sensitivity (98%) and specificity
(87%), its use for the diagnosis of head trauma in children is recommended by guidelines for diagnostic imaging in the
United States. In the United Kingdom, it provided the basis for the national diagnostic and therapeutic guidelines and is
in wide clinical use.
In addition, the Pediatric Emergency Care Applied Research Network (PECARN) rule recently reported by Kupperman
et al. and Canadian Assessment of Tomography for Childhood Head Injury (CATCH) rule proposed by Osmoid et al.
are regarded as highly sensitive criteria based on a large-scale multi-center cohort study.10,11) The PECARN rule shows
criteria of low-risk intracranial injury separately for those aged <2 years and ≥2 years and suggests CT to be unnecessary if
the risk is low.
Those aged <2 years: Normal level of consciousness, no scalp hematoma other than those in the frontal region, no loss
of consciousness or loss of consciousness of <5 seconds duration, non-severe mechanism of injury, no palpable skull
fracture, and acting normally as interpreted by parents.
Those aged ≥2 years: Normal level of consciousness, no loss of consciousness, no vomiting, non-severe mechanism of
injury, no signs of basilar skull fracture, no headache.
The CATCH rule shows criteria for high- and moderate-risk intracranial injuries and recommends CT as necessary
when the following conditions are met.
High risk: GCS <15 at 2 hours after injury, suspected open or depressed skull fracture, history of worsening headache,
irritability on examination.
Moderate risk: Any sign of basal skull fracture, large hematoma of the scalp, dangerous mechanism of injury.
In children with minor head trauma, the risk of intracranial injury should be evaluated using the above criteria, and CT
should be performed only in high-risk patients. CT should not be performed otherwise from the viewpoints of exposure
and medical cost.
Index words and secondary materials used as references
A search of PubMed was performed using “children”, “minor head injury”, “trauma”, and “CT” as keywords. Also,
Evidence-based imaging, Springer, 2011 and Evidence-based imaging in Pediatrics 2010 were used as references.
References
1) Greenes DS et al: Clinical Indicators of Intracranial Injury in Head-injured Infants. Pediatrics 104: 861-867, 1999 (Level 2)
12
The Japanese imaging guideline 2013
CQ 005
Table: CHALICE rule
Loss of consciousness of >5 min duration
History of amnesia of > 5 min duration
Abnormal drowsiness
≥3 vomits
Suspicion of abuse
Seizure in a patient with no history of epilepsy
GCS <14, GCS <15 in those aged <1 year
Suspicion of penetrating or depressed skull injury or tense fontanelle
Signs of basal skull fracture (bleeding from the ear, panda eyes, CSF leakage, Battle’s sign)
Neurological abnormalities
Subcutaneous hematoma or bruise >5 cm in diameter in those aged <1 year
Dangerous mechanism of injury such as high-energy trauma
*Close examination using CT is necessary if any of the above items is positive.
2) Palchak MJ et al: A decision rule for identifying children at low risk for brain injuries after blunt head trauma. Ann Emerg Med 42: 492-506,
2003 (Level 2)
3) Haydel MJ et al: Prediction of intracranial injury in children aged five years and older with loss of consciousness after minor head injury due to
nontrivial mechanisms. Ann Emerg Med 42: 507-514, 2003 (Level 2)
4) Oman JA et al: Performance of a decision rule to predict need for computed tomography among children with blunt head trauma. Pediatrics
117: e238-246, 2006 (Level 2)
5) Boran BO et al: Evaluation of mild head injury in a pediatric population. Pedeatr Neurosurg 42: 203-207, 2006 (Level 2)
6) Atabaki SM et al: A clinical decision rule for cranial computed tomography in minor pediatric head trauma. Arch Pediatr Adolesc Med 162: 439445, 2008 (Level 2)
7) Dunning J et al: A meta-analysis of variables that predict significant intracranial injury in minor head trauma. Arch Dis Child 89: 653-659, 2004
(Level 1)
8) Maguire JL et al: Should a head-injured child receive a head CT scan? A systematic review of clinical prediction rules. Pediatrics 124: e145154, 2009 (Level 1)
9) Dunning J et al: Derivation of the children’s head injury algorithm for the prediction of important clinical events decision rule for head injury in
children. Arch Dis Child 91: 885-891, 2006 (Level 2)
10) Kuppermann N et al: Identification of children at very low risk of clinically-important brain injuries after head trauma: a prospective cohort study.
Lancet 374: 1160-1170, 2009 (Level 2)
11) Osmoid MH et al: CATCH: a clinical decision rule for the use of computed tomography in children with minor head injury. CMAJ 182: 341-348,
2010 (Level 2)
12) Pickering A et al: Clinical decision rules for children with minor head injury: a systematic review. Arch Dis Child 96: 414-421, 2011 (Level 1)
13
The Japanese imaging guideline 2013
1. Brain and nervous system
6
Is MRI appropriate for head trauma with persistent
disturbance of consciousness?
Recommendation
grade
B
C1
B Detection of brain contusion and diffuse axonal injury after head trauma
C1 Neurological prognosis of head traum
MRI is recommended, because it has excellent detectability for brain contusion and
diffuse axonal injury after head trauma.
Since MRI is occasionally useful for the prediction of the neurological prognosis of
head trauma, it may be considered.
Background/objective
CT findings after head trauma are occasionally negative despite persistence of disturbance of consciousness. If there
is such dissociation between neurological symptoms and CT findings, MRI is often performed for further examination.
Various MRI sequences have been reported to be useful for such evaluation. How sensitive MRI is for detecting lesions
of head trauma, and how useful it is for the prediction of the neurological prognosis, are evaluated.
Comments
1) CT and MRI
For the diagnosis of brain hemorrhage, brain contusion, and diffuse axonal injury (DAI) in head trauma, MRI shows
higher contrast resolution and detectability than CT.1-5) However, DAI often escapes detection by regular MRI sequences
such as T1- and T2-weighted imaging and needs to be interpreted cautiously.3-5) Dionei et al. compared CT and MRI in 55
patients with head trauma and reported that T2-weighted, T2*-weighted, and FLAIR MRI sequences were significantly
more sensitive for detecting acute subdural hematoma, traumatic subarachnoid hemorrhage, brain contusion, and DAI.1)
2) FLAIR and diffusion-weighted imaging
Among common MRI sequences, FLAIR and diffusion-weighted imaging are sensitive for detecting lesions such as
non-hemorrhagic DAI. Ashikaga et al. retrospectively evaluated FLAIR and T2-weighted images in 56 patients and
reported that the sensitivity of FLAIR imaging was comparable to, or higher than, that of T2-weighted imaging for
detecting DAI, brain contusion, and subdural hematoma in all patients.6) Also, Kinoshita et al. retrospectively compared
the sensitivity of FLAIR and diffusion-weighted imaging for DAI in 36 patients and reported that they were comparable,
suggesting the usefulness of both sequences.7)
3) T2*- and magnetic susceptibility-weighted imaging
DAI is often manifest as small hemorrhagic lesions, and T2*- or magnetic susceptibility-weighted imaging, which
strongly reflects differences in the magnetic susceptibility, may be performed for its detection. T2*-weighted imaging
has a higher detectability for DAI than other sequences and shows excellent sensitivity for small lesions.8,9) Scheid et
al. detected DAI at a total of 233 lesions in 66 patients with head trauma by T2-weighted imaging but at 608 lesions
by T2*-weighted imaging and reported that the latter sequence was significantly more sensitive.9) Moreover, Tong et
al. compared the number of DAI lesions detected by T2*- and magnetic susceptibility-weighted imaging in 7 patients
with severe head trauma and reported that the detectability of the latter sequence was significantly higher with a mean
number of DAI lesions detected per patient being 28±8 and 134±27, respectively (Figure).10) Also, small petechial
hemorrhages are occasionally detected by magnetic susceptibility-weighted imaging in the brain parenchyma of
individuals who repeatedly sustain minor head traumas such as boxers, suggesting that small lesions of DAI can also be
detected by magnetic susceptibility-weighted imaging in head trauma patients.11)
4) Neurological prognosis
Regarding the neurological prognosis according to DAI and the Glasgow Coma Scale, there are reports that the
number of lesions detected by T2*-weighted imaging was not correlated with outcome9) but the findings of magnetic
susceptibility-weighted imaging were correlated with the outcome as, for example, disturbance of consciousness
persisted with increases in the number of detected lesions.12,13) It is recommended to perform magnetic susceptibilityweighted imaging, if possible.
Index words and secondary materials used as references
A search of PubMed was performed using “brain contusion”, “diffuse axonal injury”, “hemorrhage”, and “MRI” as key
words.
14
The Japanese imaging guideline 2013
CQ 006
Figure: Persistent disturbance of
consciousness after injury due to a
traffic accident
On magnetic susceptibility-weighted imaging,
a large number of petechial low signal areas
were observed in the splenium of corpus
callosum, and a diagnosis of diffuse axonal
injury was made.
References
1) Dionei FS et al: Clinical application of magnetic resonance in acute traumatic brain injury. Arq Neuropsiquiatr 66: 53-58, 2008 (Level 2)
2) Yokota H et al: Significance of magnetic resonance imaging in acute head injury. J Trauma 31: 351-357, 1991 (Level 3)
3) Mittl RL et al: Prevalence of MR evidence of diffuse axonal injury in patients with mild head injury and normal head CT findings. AJNR 15:
1583-1589, 1994 (Level 2)
4) Paterakis K et al: Outcome of patients with diffuse axonal injury: The significance and prognostic value of MRI in the acute phase. J Trauma
49: 1071-1075, 2000 (Level 2)
5) Chelly H et al: Diffuse axonal injury in patients with head injuries: an epidemiologic and prognosis study of 124 cases. J Trauma 71: 838-846,
2011 (Level 2)
6) Ashikaga R et al: MRI of head injury using FLAIR. Neuroradiology 39: 239-242, 1997 (Level 2)
7) Kinoshita T et al: Conspicuity of diffuse axonal injury lesions on diffusion-weighted MR imaging. Eur J Radiol 56: 5-11, 2005 (Level 3)
8) Scheid R et al: Comparative magnetic resonance imaging at 1.5 and 3 tesla for the evaluation of traumatic microbleeds. J Neurotrauma 24:
1811-1816, 2007 (Level 2)
9) Scheid R et al: Diffuse axonal injury associated with chronic traumatic brain injury: evidence from T2*-weighted gradient-echo imaging at 3T.
AJNR 24: 1049-1056, 2003 (Level 2)
10) Tong KA et al: Hemorrhagic shearing lesions in children and adolecents with posttraumatic diffuse axonal injury: improved detection and initial
results. Radiology 227: 332-339, 2003 (Level 3)
11) Hasiloglu ZI et al: Cerebral microhemorrhages detected by susceptibility-weighted imaging in amateur boxers. AJNR 32: 99-102, 2011 (Level
3)
12) Tong KA et al: Diffuse axonal injury in children: clinical correlation with hemorrhgic lesions. Ann Neurol 56: 36-50, 2004 (Level 2)
13) Jing Z et al: Hemorrhagic shearing lesions associated with diffuse axonal injury: application of T2 star-angiography sequence in the detection
and clinical correlation. Br J Neurosurg 25: 596-605, 2011 (Level 2)
15
The Japanese imaging guideline 2013
1. Brain and nervous system
7
Is neurodiagnostic imaging appropriate in patients
suspected to have febrile seizure?
Recommendation
grade
C1
C2
C1 For atypical or frequent seizures and seizures accompanied by neurological deficits
C2 For typical seizures
For atypical or frequent seizures and seizures accompanied by neurological deficits,
head MRI may be considered for evaluation. Head CT is useful as a test before
lumbar puncture and may be considered.
For typical seizures, diagnostic imaging (CT, MRI) is not recommended.
Background/objective
According to guidelines concerning febrile seizures,1,2) a febrile seizure is a paroxysmal disorder (including convulsive
and non-convulsive seizures) usually associated with a fever of 38℃ or higher occurring in early childhood without a
clear causative disorder such as infection of the central nervous system or metabolic disease.
A majority of patients with a febrile seizure are reported to have only 1 attack in their lifetime, and it is basically
considered to be a transient benign disorder. However, it is important to differentiate it from conditions that require
prompt and aggressive treatments such as encephalopathy and encephalitis and, if seizure is recurrent, to exclude
organic disorders. Whether or not diagnostic imaging should be performed when febrile seizure is suspected and
important diseases to be differentiated are evaluated.
Comments
Febrile seizure is considered to be the most frequently encountered type among convulsive disorders of children. In
Japan, its prevalence is reportedly 7-8%, which is slightly higher than that in Western countries (2-5%). Convulsive
attacks associated with febrile seizure are typically generalized attacks of convulsion such as generalized tonic-clonic
seizures. Partial seizures, seizure sustained for a prolonged period (10-15 minutes or longer), and seizures recurring
within 24 hours are considered to be atypical seizures and risk factors of epilepsy. In addition, clear neurological
abnormalities before the onset of febrile seizure, developmental retardation, and a familial history of epilepsy in parents
and siblings are factors related to the occurrence of epilepsy and recurrence of febrile seizure.
There are no reports with a high evidence level recommending diagnostic imaging (CT, MRI) for children with
febrile seizure showing typical attacks. While the definition of atypical attacks differs slightly, the American Academy
of Pediatrics (AAP) issued a statement recommending against CT or MRI for febrile seizure with typical attacks.3)
However, there may be positive imaging findings in atypical attacks.4)
Diseases from which febrile seizure needs to be differentiated from include bacterial/viral encephalitis/meningitis,
tuberculous encephalitis/meningitis, subdural/epidural abscess, brain abscess, and acute encephalopathy. In children,
clinical findings are often difficult to obtain, and diagnostic imaging plays a considerable role. A delay of the
diagnosis and treatment of these diseases, while they are observed less frequently than febrile seizure, decrease the life
expectancy/functional outcome prognosis, so early diagnosis and treatment are important.
Also, the above guidelines recommend aggressive lumbar puncture if encephalitis/meningitis is suspected, and
diagnostic imaging has significance in excluding intracranial space-occupying lesions that are contraindications of
lumbar puncture.
Acute viral encephalopathy5) is a disease exhibiting seizure and sudden disturbance of consciousness in the acute stage
of highly febrile viral infection. However, pathogenic viruses and clinicopathological classification do not show one-toone correspondence. Thus, a particular virus may cause diverse clinicopathological features, and various viruses may
cause the same clinicopathological features. Moreover, acute encephalopathy is often triggered by viral infection, but it
may also be caused by congenital metabolic abnormalities, non-viral infections such as bacterial infection, cat scratch
disease, and Q fever, and diseases other than infection such as autoimmune disorders.6,7)
Acute encephalopathy is caused by various mechanisms.8-10) Particularly, in the first episode of acute encephalopathy
with biphasic seizures showing no disturbance of consciousness, the differential diagnosis from simple febrile seizure
is difficult, and it is important to detect high intensity signals in the subcortical white matter (bright tree appearance) by
diffusion-weighted imaging before the occurrence of recurrent partial seizures 4-5 days after the onset.9)
Splenial lesions11) appear in various diseases and situations including after drug administration, and lesions distributed
within the splenium and white matter to Rolando’s area are known to be reversible in acute encephalitis/encephalopathy
patients.12)
In the chronic stage, MRI reportedly disclosed hippocampal atrophy in 6 of the 15 patients with febrile seizures
16
The Japanese imaging guideline 2013
CQ 007
showing atypical attacks, while the evidence level is not high.13) Febrile seizure patients are also reported to be at a
higher risk of developing epilepsy, and diagnostic imaging is considered to play a role in close evaluation in the chronic
stage if, for example, attacks are recurrent.14)
Index words and secondary materials used as references
A search of PubMed was performed using “febrile seizure”, “CT”, and “MRI” as key words. The guidelines listed as
References 1) and 2) and the recommendation listed as Reference 3) below were also used as references.
References
1) Fukuyama Y et al: Convulsive disorder. Guidelines for the management of febrile seizures. Jpn J Pediatrics 49: 207-215, 1996 (Level 5)
2) Seki T: Febrile convulsion. Recent knowledge and new guidance guideline. Progresses in Pediatric Neurology Vol. 26, Postgraduate
Education Committee, Japanese Society of Child Neurology: 139-152, 1997 (Level 5)
3) Subcommittee on Febrile Seizures: American Academy of Pediatrics. Neurodiagnostic evaluation of the child with a simple febrile seizure.
Pediatrics 127: 389-394, 2011 (Level 5)
4) Takanashi J et al: Diffusion MRI abnormalities after prolonged febrile seizures with encephalopathy. Neurology 66: 1304-1309, 2006 (Level 3)
5) Mizuguchi M et al: Acute encephalopathy associated with influenza and other viral infections. Acta Neurol Scand 115: 45-56, 2007 (Level 4)
6) Kubota H et al: Q fever encephalitis with cytokine profiles in serum and cerebrospinal fluid. Pedatr Infect Dis J 20: 318-319, 2001 (Level 4)
7) Ogura K et al: MR signal changes in a child with cat scratch disease encephalopathy and status epilepticls. Eur Neurol 51: 109-110, 2004
(Level 4)
8) Mizuguchi M.: Acute necrotizing encephalopathy of childhood: a novel form of acute encephalopathy prevalent in Japan and Taiwan. Brain
Dev 19: 81-92, 1997 (Level 4)
9) Takanashi J et al: Excitotoxicity in acute encephalopathy with biphasic seizures and late reduced diffusion. AJNR 30: 132-135, 2009 (Level 4)
10) Tada H et al: Clinically mild encephalitis/encephalopathy with a reversible splenial lesion. Neurology 63: 1854-1858, 2004 (Level 3)
11) Maeda M et al: Reversible splenial lesion with restricted diffusion in a wide spectrum of diseases and conditions. J Neuroradiol 33: 229-236,
2006 (Level 4)
12) Takanashi J et al: Differences in the time course of splenial and white matter lesions in clinically mild encephalitis/encephalopathy with a
reversible splenial lesion (MERS). J Neurol Sci 292: 24-27, 2010 (Level 4)
13) VanLandingham KE et al: Magnetic resonance imaging evidence of hippocampal injury after prolonged focal febrile convulsions. Ann Neurol
43: 413-426, 1998 (Level 3)
14) Neligan A et al: Long-term risk of developing epilepsy after febrile seizures: a prospective cohort study. Neurology 78: 1166-1170, 2012 (Level
3)
17
The Japanese imaging guideline 2013
1. Brain and nervous system
8
What imaging modalities are appropriate for the
diagnosis of temporal lobe epilepsy?
Recommendation
grade
B
C1
B MRI, SPECT
C1 CT
MRI is the first choice imaging modality for temporal lobe epilepsy and is recommended.
Ictal SPECT is recommended for the identification of epileptic foci.
While CT is less sensitive for detecting responsible lesions than MRI, it is useful for
detecting calcification and may be considered.
Background/objective
Epileptogenic lesions in temporal lobe epilepsy are classified into sclerosing lesions (neuronal loss and gliosis),
tumors, vascular anomalies, cortical dysplasia/brain anomalies, posttraumatic gliosis, and inflammatory lesions. The
significance of diagnostic imaging lies in the localization and qualitative diagnoses of these epileptogenic lesions. There
have been various reports concerning the usefulness of CT, MRI, and SPECT/PET for the diagnosis of temporal lobe
epilepsy. Their effectiveness is evaluated.
Comments
1) CT
Reports evaluating the usefulness of CT for detecting epileptogenic lesions have been few. According to a retrospective
report on CT including its comparison with MRI in children, the sensitivity of CT for the detection of responsible lesions
(31%) was lower than that of MRI (64%).1) However, the addition of CT is considered useful if lesions accompanied
by tissue calcification such as tumors and cavernous hemangiomas are suspected. CT is also selected if MRI cannot
be performed due to patient factors or the presence of a cardiac pacemaker and if there are signs of an elevation of the
intracranial pressure, suggesting conditions such as intracranial hemorrhage and the possible necessity of emergency
surgical treatment.
2) MRI
The most important disease related to temporal lobe epilepsy is hippocampal sclerosis (mesial temporal sclerosis).
As findings suggestive of hippocampal sclerosis, (1) atrophy and signal abnormality of the hippocampus, (2) reduced
delineability of the internal structure (striation) of the hippocampus, (3) loss of digitations in the hippocampal head, and
(4) rotational abnormalities of the body of hippocampus have been reported using MRI at various magnetic intensities
(Figure).2) Of these findings, rotational abnormalities of the body of hippocampus is frequently observed also in healthy
individuals and needs caution.3)
Hippocampal atrophy is basically evaluated visually by comparison with the opposite hippocampus. However, caution
is necessary because there are cases of bilateral hippocampal sclerosis. There are also reports that atrophy cannot be
detected in about 15-30% of the patients with temporal lobe epilepsy.4,5) Concerning quantitative evaluation of the
hippocampal region, there have been a number of reports including those on the method to determine the hippocampal
volume by manually setting the region of interest and whole-brain analysis using voxel-based morphometry.6-8) However,
there is also a report that visual qualitative evaluation is more useful for the diagnosis,9) and, presently, quantitative
analysis is not used for the diagnosis on an individual basis.
The sensitivity and specificity for the diagnosis of temporal lobe epilepsy reach about 80-90% by combining findings
of hippocampal atrophy with abnormal signals in T2-weighted and FLAIR images.10,11) Regarding reduced delineability
of the internal structure (striation) of the hippocampus, temporal lobe epilepsy can be diagnosed with a sensitivity of 76%
and a specificity of 80% by T2-weighted imaging using 3T MRI, and its sensitivity is reported to be higher than that of
hippocampal atrophy (44%) or abnormal signals on T2-weighted imaging (48%).12) The sensitivity and specificity of
loss of digitations in the hippocampal head using a 1.5T system have been reported to be 92 and 100%, respectively, and
the finding was reported to be observed frequently in atrophied hippocampi13) but has recently been reported using a 7T
system to be unrelated to the presence or absence of atrophy.3)
Hippocampal sclerosis is often complicated by disorder of neuroblast migration, and local lesions are often observed
at sites other than the hippocampus. Therefore, it is necessary to scan the whole brain. The addition of contrastenhanced MRI is unnecessary for the diagnosis of atrophic lesions of the brain including hippocampal sclerosis or brain
anomalies. However, contrast-enhanced MRI is necessary if brain tumor, cerebrovascular anomalies, or inflammation
are suspected for their qualitative diagnosis.
18
The Japanese imaging guideline 2013
CQ 008
B
C
Figure: Refractory epilepsy observed from early childhood
A
A Coronal FLAIR image B, C Coronal T2-weighted image
In the coronal FLAIR image, the left hippocampus shows high
signal intensity and mild atrophy compared with the opposite
hippocampus (A). In the coronal T2-weighted image, the internal
structure (striation, → ) is more clearly delineated in the right
(normal, B) compared with left (affected, C) hippocampus.
In surgical treatment, functional MRI (fMRI) may be considered to identify the localization of verbal and memory
functions. There have been many reports supporting the superiority of fMRI compared with the conventional Wada test
(Amytal test) from the viewpoints of invasiveness and reliability of the test itself,14-16) and the Wada test may be replaced
by fMRI in the future.
3) SPECT/PET
SPECT or PET is used to identify the sites showing changes in the blood flow or metabolism in epileptogenic foci.
Iomazenil SPECT, by which benzodiazepine receptors are visualized, is also performed. Presently, the most widely
employed modality is interictal brain perfusion SPECT. Its sensitivity is only 40-60%,17-19) and the interpretation of
images is not necessarily in agreement among readers. The sensitivity of interictal PET has been reported to reach 84%,
but it is lower than that of ictal SPECT (≥90%).17-19) However, as ictal SPECT images are modified by various factors
including the seizure type, duration of seizure, radionuclide, and timing of its injection, it is often difficult to identify
epileptogenic foci by SPECT alone. Presently, these functional brain imaging techniques are performed supplementarily
with morphological evaluation using MRI or in preparation for surgery.
Index words and secondary materials used as references
A search of PubMed was performed using “CT”, “MRI”, and “temporal lobe epilepsy” as key words.
References
1) Sinclair DB et al: Pathology and neuroimaging in pediatric temporal lobectomy for intractable epilepsy. Pediatric Neurosurgery 35: 239-246, 2001 (Level 3)
2) Henry TR et al: Hippocampal sclerosis in temporal lobe epilepsy: findings at 7T. Radiology 261: 199-209, 2011 (Level 4)
3) Bajic D et al: Incomplete inversion of the hippocampus-a common developmental anomaly. Eur Radiol 18: 138-142, 2008 (Level 4)
4) Carne RP et al: MRI-negative PET-positive temporal lobe epilepsy: a distinct surgically remediable syndrome. Brain 127: 2276-2285, 2004 (Level 3)
5) Jackson GD et al: Hippocampal sclerosis without detectable hippocampal atrophy. Neurology 44: 42-46, 1994 (Level 5)
6) Mackay CE et al: Quantitative magnetic resonance in consecutive patients evaluated for surgical treatment of temporal lobe epilepsy. Magn Reson Imaging 18:
1187-1199, 2000 (Level 5)
7) Keller SS et al: Voxel-based morphometric comparison of hippocampal and extrahippocampal abnormalities in patients with left and right hippocampal atrophy.
Neuroimage 16: 23-31, 2002 (Level 3)
8) Bonilha L et al: Voxel-based morphometry reveals gray matter network atrophy in refractory medial temporal lobe epilepsy. Arch Neurol 61: 1379-1384, 2004
(Level 3)
9) Cheon JE et al: MR of hippocampal sclerosis: comparison of qualitative and quantitative assessments. AJNR 19: 465-468, 1998 (Level 3)
10) Jack CR et al: Mesial temporal sclerosis: diagnosis with fluid-attenuated inversion-recovery versus spin-echo MR imaging. Radiology 199: 367-373, 1996
(Level 3)
11) Kim JH et al: Fast spin-echo MR in hippocampal sclerosis: correlation with pathology and surgery. AJNR 16: 627-636, 1995 (Level 3)
12) Hanamiya M et al: Partial loss of hippocampal striation in medial temporal lobe epilepsy: pilot evaluation with high-spatial-resolution T2-weighted MR imaging
at 3.0T. Radiology 251: 873-881, 2009 (Level 3)
13) Oppenheim C et al: Loss of digitations of the hippocampal head on high-resolution fast spin-echo MR: a sign of mesial temporal sclerosis. AJNR 19: 457-463,
1998 (Level 3)
14) Binder JR et al: Determination of language dominance using functional MRI: a comparison with the Wada test. Neurology 46: 978-987, 1996 (Level 4)
15) Fernandez G et al: Intrasubject reproducibility of presurgical language lateralization and mapping using fMRI. Neurology 60: 969-975, 2003 (Level 4)
16) Lehericy S et al: Functional MR evaluation of temporal and frontal language dominance compared with the Wada test. Neurology 54: 1625-1633, 2000 (Level 4)
17) Spencer SS et al: The relative contributions of MRI, SPECT, and PET imaging in epilepsy. Epilepsia 35: S72-89, 1994 (Level 3)
18) Devous MD Sr et al: SPECT brain imaging in epilepsy: a meta-analysis. J Nucl Med 39: 285-293, 1998 (Level 3)
19) Newton MR et al: SPECT in the localization of extratemporal and temporal seizure foci. J Neurol Neurosurg Psychiatry 59: 26-30, 1995 (Level 3)
19
The Japanese imaging guideline 2013
1. Brain and nervous system
9
Are CT and MRI appropriate for patients with an
apparent first unprovoked seizure?
Recommendation
grade
C1
C1 CT, MRI (patients in whom focal neurological deficits or disturbance of
consciousness persist for a prolonged time after a seizure)
C1 MRI (patients with an apparent first unprovoked seizure)
Imaging examination such as CT and MRI may be considered in patients exhibiting
focal neurological deficits or disturbance of consciousness for a prolonged time after
a seizure.
While scientific evidence to recommend routine imaging examination for patients with
an apparent first unprovoked seizure is insufficient, MRI is occasionally useful and
may be considered.
Background/objective
Seizure is the name of a symptom characterized by involuntary and paroxysmal contraction of muscles of the whole
or part of the body, and epilepsy is the name of a disease in which symptoms including seizure are caused by excessive
neuronal excitation. In this article, an apparent first seizure is defined as a seizure without a history of epilepsy or
an acute pathological condition such as head trauma, stroke, drug poisoning, and electrolyte abnormality and with
normalization of neurological functions after the episode.1) Unprovoked seizures are classified as epilepsy in 40-50%
of the patients by subsequent close examinations.1) What imaging modalities are recommended for patients with an
apparent first unprovoked seizure was evaluated.
Comments
In evaluating imaging examinations, the detection rate of lesions and effects on the therapeutic strategy must be
considered. In a cohort study by Shinnar et al.,2) imaging examinations were performed in 218 (CT in 159, MRI in 59)
of the 411 children who exhibited an apparent first unprovoked seizure, and abnormalities were noted in 45 (21%). The
lesion detection rate was higher on MRI (34%) than on CT (22%), but the treatment in the acute stage was changed in
only 4 (1.8%).
In an evidence-based review of children with a first nonfebrile seizure (many of them examined by CT alone) carried
out by the American Academy of Neurology,3) abnormalities that caused changes in the treatment were detected by
CT in 0-7% of the children. On CT, abnormalities were noted more frequently in adults (18-34%), and the therapeutic
effectiveness of imaging studies was lower in children than in adults.2,4-8) This review included a case series study
of adults and children by King et al.,4) in which imaging examination was performed in 277 (92%) of 300 patients
with a first episode of seizure (MRI in 263, CT alone in 14), resulting in the detection of lesions in 38 (by MRI in 36
(14%) and by CT in 2 (14%)). Of these patients, 17 had tumors, and the treatment was changed. Of the 38 patients
with a lesion, CT was performed in 28, and lesions in agreement with the MRI findings were observed in only 12
patients. The American Academy of Neurology also reported an evidence-based review of adults with an apparent first
unprovoked seizure,1) according to which abnormalities were detected in 1-57% (mean: 15%) by CT, and the results
affected the therapeutic strategy in 1-47% (mean: 10%).9-15) In older individuals, in particular, the possibility of detecting
abnormalities was higher than in children, and imaging studies were considered to be sufficiently worth evaluating.1)
Concerning comparison between CT and MRI, there is a retrospective study by Kollar et al.16) Of the 84 patients with
an apparent first unprovoked seizure, 21 underwent CT alone, and 6 underwent MRI alone, and abnormalities were
detected in 16 (76%) and 4 (67%), respectively. In 57 patients, both CT and MRI were performed, and abnormalities
were detected by MRI but not by CT in 12 (21%) and by both CT and MRI in 17 (30%); MRI had a significantly high
diagnostic value than CT (p<0.0001).
Thus, while more lesions are detected by MRI than by CT, the detection of lesions does not necessarily lead to changes
in treatment, so the evidence supporting routine neuroimaging is considered insufficient. However, the possibility
of detection of abnormalities by imaging studies increases if there are focal seizures or focal neurological deficits. 2)
Imaging examination by CT or MRI should be performed in patents who show focal neurological deficits after a seizure
persisting for a prolonged time or clouded consciousness lingering over several hours after a seizure. MRI is preferable
if possible. Moreover, although there is no urgency, evaluation using MRI should be considered in patients with
unexplained cognitive or motor dysfunctions, partial seizures, EEG findings contradicting benign childhood epilepsy, or
primary generalized epilepsy, and children aged less than 1 year.17)
20
The Japanese imaging guideline 2013
CQ 009
Index words and secondary materials used as references
A search of PubMed was performed using “CT”, “MRI”, and “first unprovoked seizure” as key words.
References
1) Krumholz A et al: Practice parameter: evaluating an apparent unprovoked first seizure in adults (an evidence-based review). Neurology 69:
1996-2007, 2007 (Level 3)
2) Shinnar S et al: Neuroimaging abnormalities in children with an apparent first unprovoked seizure. Epilepsy Res 43: 261-269, 2001 (Level 2)
3) Hirtz D et al: Practice parameter: evaluating a first nonfebrile seizure in children. Neurology 55: 616-623, 2000 (Level 3)
4) King MA et al: Epileptology of the first-seizure presentation: a clinical, electroencephalographic, and magnetic resonance imaging study of 300
consecutive patients. Lancet 352: 1007-1011, 1998 (Level 3)
5) Garvey MA et al: Emergency brain computed tomography in children with seizures: who is most likely benefit? J Pediatr 133: 664-669, 1998
(Level 4)
6) Stroink H et al: The first unprovoked, untreated seizure in childhood: a hospital based study of the accuracy of diagnosis, rate of recurrence,
and long term outcome after recurrence: dutch study of epilepsy in childhood. J Neurol Neurosurg Psychiatry 64: 595-600, 1998 (Level 3)
7) Berg AT et al: Status epilepticus in children with newly diagnosed epilepsy. Ann Neurol 45: 618-623, 1999 (Level 2)
8) McAbee GN et al: Results of computed tomography in “neurologically normal” children after initial onset of seizures. Pediatr Neurol 5: 102-106,
1989 (Level 4)
9) Hopkins A et al: The first seizure in adult life: value of clinical features, electroencephalography, and computerised tomographic scanning in
prediction of seizure recurrence. Lancet 1: 721-726, 1988 (Level 2)
10) Schoeneberger RA et al: Indication for computed tomography of the brain in patients with first uncomplicated generalized seizure. BMJ 309:
986-989, 1994 (Level 4)
11) Das CP et al: Risk of recurrence of seizures following a single unprovoked idiopathic seizure. Neurol India 48: 357-360, 2000 (Level 4)
12) Edmondstone WM: How do we manage the first seizure in adults? J R Coll Physicians Lond 29: 289-294, 1995 (Level 4)
13) Forsgren L et al: Electroencephalographic and neuroradiological findings in adults with newly diagnosed unprovoked seizures. Eur Neurol 31:
61-67, 1991 (Level 3)
14) Hui ACF et al: Recurrence after a first untreated seizure in the Hong Kong Chinese population. Epilepsia 42: 94-97, 2001 (Level 4)
15) Van Donselaar CA et al: Value of the electroencephalogram in adult patients with untreated idiopathic first seizure. Arch Neurol 49: 231-237,
1992 (Level 4)
16) Kollar B et al: Solotaly epileptic seizures in the clinical practice: Part 2: findings of various modifications of EEG examination and imaging
methods in patients who experienced solitary unprovoked epileptic seizure. Neuroendocrinol Lett 30: 487-490, 2009 (Level 4)
17) Byron B et al: Neuroimaging of Seizures, Evidence-based Imaging: Improving the Quality of Imaging in Patient Care. p245-259, Revised ed,
Springer, 2011 (Level 2)
21
The Japanese imaging guideline 2013
1. Brain and nervous system
10
What imaging modalities are appropriate for patients
presenting with subacute/chronic symptoms and suspected
to have an intracranial space-occupying lesion?
Recommendation
grade
B
MRI is recommended
If MRI cannot be performed promptly in an emergency situation, CT is recommended.
Background/objective
Generally, CT and MRI are used widely for imaging studies of intracranial space-occupying lesions, but there are
no clear guidelines concerning which examination should be performed first. The usefulness of CT and MRI was
evaluated in intracranial space-occupying lesions in patients with a subacute/chronic presentation, excluding stroke
and traumatic lesions. While clinical symptoms suggestive of an intracranial space-occupying lesion vary widely, they
include generalized symptoms, which are typically headache, seizure, and impairment of cognitive function, and local
neurological symptoms, which are typically local hyposthenia, sensory disturbance, and impairment of vision or visual
field.1)
Comments
For most intracranial abnormalities, the sensitivity of MRI is comparable to, or higher than, that of CT.1-6)
MRI is superior in contrast resolution and delineation of details compared with CT and can scan cross-sections of
arbitrary planes. It is also excellent in detecting asymptomatic lesions.1,2,5-8) Moreover, MRI excels in delineating areas
surrounded by bones and permits more accurate evaluation of lesions in the posterior cranial fossa, brainstem, and
middle cranial fossa (Figure).2,9-11) Regarding sellar and suprasellar lesions, MRI is superior to CT in evaluating the
state of surrounding structures such as the optic nerve, optic chiasm, and internal carotid artery.7,8) However, CT is more
useful for detecting calcification in lesions and evaluating associated bony changes.1,10,12)
Kent et al. reviewed the literature comparing MRI with other modalities including CT and reported that some studies
showed that MRI affected the therapeutic approaches but exerted no major effect on the quality of life.2) The hardware
of both CT and MRI has been markedly improved during the past 20 years, but CT can still be performed more quickly
than MRI in most cases. Also, MRI is more expensive than CT and may not be performed promptly depending on the
facility. CT suffices for detecting a large intracranial mass or hemorrhage that requires immediately intervention.1-3) It
must also be noted that some implanted metal devices such as a cardiac pacemaker are contraindications for MRI. CT,
however, involves X-ray exposure, and unnecessarily performing it must be avoided.
The use of an iodine-based contrast agent in CT and a gadolinium-based contrast agent in MRI are both useful for
improving the delineability for intracranial tumors and evaluating the entire picture of lesions.1,13-16) Generally, contrastenhanced MRI has higher lesion detectability and delineability than contrast-enhanced CT. Contrast enhancement is
clearer by contrast-enhanced MRI than by contrast-enhanced CT in primary intracerebral tumors, typically, glioma
and many intracranial tumors such as metastatic tumors, meningioma, and schwannoma, and MRI is more useful for
the evaluation of the area of involvement of lesions (Figure).1,2,16-20) According to many reports, the detection rates,
particularly, of brain and meningeal metastases are higher by contrast-enhanced MRI than by contrast-enhanced
CT.3,16-18,20) Therefore, in close evaluation of intracranial masses using a contrast agent, contrast-enhanced MRI is
recommended.
The evaluation of large meningioma and schwannoma is often possible also by non-contrast MRI.13) It must, however,
be remembered that contrast-enhancement is not observed in all intracranial tumors.
Index words and secondary materials used as references
A search of PubMed was performed using “brain”, “intracranial”, “central nervous system”, “tumor or neoplasm or
mass or occupying”, “CT”, “MR”, and “sensitivity or specificity”, as keywords and the literature with a large number of
cases and a high evidence level were preferentially selected. Evidence-Based Imaging: Optimizing Imaging in Patient
Care. Medina LS and Blackmore C (eds), Springer, 2011 was also used as a reference.
References
1) Hutter A et al: Brain neoplasms: epidemiology, diagnosis, and prospects for cost-effective imaging. Neuroimaging Clin N Am 13: 237-250, 2003
(Level 2)
2) Kent DL et al: The clinical efficacy of magnetic resonance imaging in neuroimaging. Ann Intern Med 120: 856-871, 1994 (Level 2)
3) Medina LS et al: Adults and children with headache: evidence-based diagnostic evaluation. Neuroimaging Clin N Am 13: 225-235, 2003 (Level 2)
4) Kucharczyk W et al: Central nervous system tumors in children: detection by magnetic resonance imaging. Radiology 155: 131-136, 1985 (Level 4)
22
The Japanese imaging guideline 2013
CQ 010
A
B
C
D
Figure: Left acoustic schwannoma
A Non-contrast CT B Non-contrast bone-window CT C MRI T2-weighted image
D MRI Contrast-enhanced T1-weighted image
The diagnosis of the presence of the mass is possible by both CT and MRI, but the
entire contour of the lesion is delineated most clearly by contrast-enhanced MRI.
Dilation of the internal auditory meatus is clearly observed by bone-window CT.
5) Runge Price AC et al: Primary glioma: diagnosis with magnetic resonance imaging. J Comput Tomogr 10: 325-334, 1986 (Level 3)
6) Orrison WW et al: Comparison of CT, low-field-strength MR imaging, and high-field-strength MR imaging. Work in progress. Radiology 181: 121127, 1991 (Level 3)
7) Lee BC et al: Sellar and juxtasellar lesion detection with MR. Radiology 157: 143-147, 1985 (Level 4)
8) Karnaze MG et al: Suprasellar lesions: evaluation with MR imaging. Radiology 161: 77-82, 1986 (Level 3)
9) Lee BC et al: MR imaging of brainstem tumors. AJNR 6: 159-163, 1985 (Level 4)
10) Barloon TJ et al: Lesions involving the fourth ventricle evaluated by CT and MR: a comparative study. Magn Reson Imaging 7: 635-642, 1989
(Level 3)
11) Loneragan R et al: Magnetic resonance imaging evaluation of cerebellopontine angle tumours. Australas Radiol 33: 47-55, 1989 (Level 4)
12) Schubeus P et al: Intracranial meningiomas: how frequent are indicative findings in CT and MRI? Neuroradiology 32: 467-473, 1990 (Level 3)
13) Felix R et al: Brain tumors: MR imaging with gadolinium-DTPA. Radiology 156: 681-688, 1985 (Level 3)
14) Haughton VM et al: Sensitivity of Gd-DTPA-, enhanced MR Imaging of Benign Extraaxial Tumors. Radiology 166: 829-833, 1988 (Level 3)
15) Elster AD et al: Is Gd-DTPA required for routine cranial MR imaging? Radiology 173: 231-238, 1989 (Level 3)
16) Sze G et al. Detection of brain metastases: comparison of contrast-enhanced MR with unenhanced MR and enhanced CT. AJNR 11: 785-791,
1990 (Level 3)
17) Sze G et al: MR imaging of the cranial meninges with emphasis on contrast enhancement and meningeal carcinomatosis. AJR 153: 1039-1049,
1989 (Level 3)
18) Chamberlain MC et al: Leptomeningeal metastasis: a comparison of gadolinium-enhanced MR and contrast-enhanced CT of the brain. Neurology
40: 435-438, 1990 (Level 3)
19) Schürner W et al: Intracranial meningiomas. Comparison of plain and contrast-enhanced examinations in CT and MRI. Neuroradiology 32: 12-18,
1990 (Level 4)
20) Davis P et al: Diagnosis of cerebral metastases: double-dose delayed CT vs contrast-enhanced MR imaging. AJNR 12: 293-300, 1991 (Level 3)
23
The Japanese imaging guideline 2013
1. Brain and nervous system
11
Is CT or MRI appropriate in adults with primary
headaches?
Recommendation
grade
C1
C2
C1 For atypical headaches, headaches otherwise unclassifiable, and trigeminal
autonomic cephalalgia
C2 Primary headaches not accompanied by neurological deficits
For atypical headaches, headaches otherwise unclassifiable, and trigeminal
autonomic cephalalgia, CT or MRI is occasionally useful and may be considered.
For primary headaches not accompanied by neurological deficits, CT or MRI is only
marginally useful and is not recommended.
Background/objective
The International Classification of Headache Disorders; 2nd Edition (ICHD-II) issued by the International Headache
Society (IHS) classifies headaches into primary and secondary headaches and cranial neuralgias, central or primary
facial pain, and other headaches. Primary headaches are classified into migraine, tension-type headache, cluster headache
and other trigeminal autonomic cephalalgias, and other primary headaches. Secondary headaches include headaches
attributed to various conditions such as trauma, vascular disorders, non-vascular intracranial disorders, infection, and
psychiatric disorder. Generally, primary headaches are considered to be synonymous with chronic headaches, but their
diagnosis relies primarily on the history and close evaluation of findings on neurological examinations, and the role of
imaging modalities is considered to be small. In actual clinical settings, however, CT or MRI is often performed before
classification of headaches, and the assessment of primary headaches has not become a common practice. In this section,
the effectiveness of neuroimaging for the diagnosis of primary headaches is evaluated.
Comments
Since the reports evaluating the usefulness of neuroimaging for the diagnosis of primary headaches are limited to
observational studies such as cohort and case-control studies, its usefulness is estimated from their results.
In 1985, Joseph et al.1) evaluated 48 patients who underwent CT or MRI for headache and reported brain tumors in 5
and arteriovenous malformation in 1. Of these patients who exhibited abnormalities on imaging, 5 showed neurological
abnormalities, and 1 presented with headache on exertion, an unclassifiable headache. Also, Weingerten et al.2) reviewed
100,800 adults with migraine and reported that the detection rate of patients who complained of chronic headache but
showed no neurological deficits and were found to need surgical treatment by CT was about 0.01%.
In 1994, the American Academy of Neurology issued guidelines for the neuroimaging diagnosis of headaches without
neurological deficits.3) Their proposal was based on the evaluation by Fishberg et al.4) reported in the same year. They
reviewed 17 reports published in 1974-1991 and evaluated the findings of 897 times of CT or MRI performed in
migraine patients. As a result, only 4 patients (0.4%) showed abnormalities requiring treatment, i.e., 3 with brain tumors
and 1 with arteriovenous fistula. On the basis of these results, the guideline commented, “The necessity of neuroimaging
for patients with typical migraine is low.” However, admitting that there are organic disorders that require treatment, it
stated, “Atypical headaches, a history of seizure, and neurological deficits can be indications for CT or MRI.”
In 2004, Sandrini et al. 5) presented guidelines concerning the usefulness of neurological and neuroimaging
examinations in patients with non-acute headaches on the basis of a review of the literature. The guidelines were
revised in 2010, and a second edition is now available.6) In this revised edition, a prospective study in 1,876 headache
patients with a non-acute onset by Sempere et al.7) is cited. While all patients underwent CT or MRI, only 1.2% of them
exhibited important organic disorders, and only 0.9% of the patients with headache not accompanied by neurological
deficits were found to have intracranial disorders. In this report, the authors concluded that headache patients
infrequently have intracranial lesions and that factors that suggest such lesions are neurological findings, clinical course,
and history of present illness.
In 2005, Tsushima et al. 8) evaluated MR images of 306 patients with chronic headache not accompanied by
neurological deficits and reported that no abnormality was noted in 169, mild abnormalities were noted in 135, and
important organic disorders were detected in only 2 (0.7%), namely, 1 with pituitary adenoma and 1 with chronic
subdural hematoma.
Thus, all reports were negative about the usefulness of imaging examinations for chronic headaches without
neurological deficits but admitted some necessity for atypical headaches and headaches otherwise unclassifiable.
Recently, group-based studies in migraine patients have reported that migraine in women is a risk factor of deep
white matter lesions and that migraines with predictive signs increase the risk of asymptomatic ischemic lesions of the
brain.9,10) However, no relationship between the detected lesions and headache has not been established, and further
evaluation is necessary.
24
The Japanese imaging guideline 2013
C Q 0 11
Willbrink et al.11) reviewed 56 case reports of trigeminal autonomic cephalalgias characterized by frequent attacks of
headache of a short duration accompanied by unilateral autonomic symptoms of the face and noted secondary causes
associated with organic lesions such as brain tumor and vascular lesions in many patients. On the basis of these findings,
they reported that neuroimaging is indicated if trigeminal autonomic cephalalgia is suspected by appropriate assessment.
Also, it is recommended to perform modalities appropriate for the evaluation of cervical vessels and parasellar or
paranasal sinus regions, if necessary, in addition to routine head MRI.
Index words and secondary materials used as references
A search of PubMed was performed using “chronic headache”, “diagnostic imaging”, “guideline”, “migraine”,
and “cephalalgia” as key words. Also, the Headache Classification Committee, International Headache Society: The
International Classification of Headache Disorders; 2nd Edition (ICHD-II) was used as a reference.
References
1) Joseph R et al: Intracranial space-occupying lesions in attending a migraine clinic. Practitioner 229: 477-481, 1985 (Level 4)
2) Weingarten S et al: The effectiveness of cerebral imaging in the diagnosis of chronic headache. Arch Intern Med 152: 2457-2462, 1992 (Level
3)
3) Practice parameter: the utility of neuroimaging in the evaluation of headache in patients with normal neurologic examinations (summary statement): report of the quality standards subcommittee of the American Academy of Neurology. Neurology 44: 1353-1354, 1994 (Level 2)
4) Fishberg BM: The utility of neuroimaging in the evaluation of headache in patients with normal neurologic examinations. Neurology 44: 11911197, 1994 (Level 2)
5) Sandrini G et al: Neurophysiological tests and neuroimaging procedures in non-acute headache: guidelines and recommendations. Eur J
Neurol 11: 217-224, 2004 (Level 3)
6) Sandrini G et al: Neurophysiological tests and neuroimaging procedures in non-acute headache, 2nd ed. Eur J Neurol 18: 373-381, 2011
(Level 3)
7) Sempere AP et al: Neuroimaging in the evaluation of patients with non-acute headache. Cephalgia 25: 30-35, 2005 (Level 2)
8) Tsushima Y, Endo K: MR imaging in the evaluation of chronic or recurrent headache. Radiology 235: 575-579, 2005 (Level 2)
9) Swartz RH, Kern RZ: Migraine is associated with magnetic resonance imaging white matter abnormalities: a meta-analysis. Arch Neurol 61:
1366-1368, 2004 (Level 2)
10) Etminan M et al: Risk of ischemic stroke in people with migraine: systematic review and meta-analysis of observational studies. BMJ 330: 63,
2005 (Level 2)
11) Wilbrink LA et al: Neuroimaging in trigeminal autonomic cephalgias: when, how, and of what? Curr Opin Neurol 22: 247-253, 2009 (Level 3)
25
The Japanese imaging guideline 2013
1. Brain and nervous system
12
What imaging modalities are appropriate for detecting
metastatic brain tumors?
Recommendation
grade
B
If metastatic brain tumors are suspected, contrast-enhanced MRI is recommended.
Background/objective
In cancer patients, the presence or absence of brain metastasis is important for the determination of the therapeutic
strategy, and the exact number, size, and site of brain metastatic foci are necessary for the selection of treatments. CT
and MRI are used frequently for their evaluation, but the modality performed first may differ among facilities. In this
section, the modality that should be performed as the first choice for the evaluation of brain metastases in cancer patients
suspected to have metastatic brain tumors is evaluated.
Comments
Since the reports evaluating the usefulness of imaging modalities for metastatic brain tumors are limited to those of
observational studies such as cohort and case-control studies, it is estimated on the basis of their results.
Since the late 1980s, there have been a number of comparative studies of CT and MRI for the detection of metastatic
brain tumors.1-6) According to a report in which contrast-enhanced CT and contrast-enhanced MRI were compared in 50
consecutive patients suspected to have parenchymal brain metastases, more metastatic foci were detected by contrastenhanced MRI than by contrast-enhanced CT in 8 of the 27 patients found to have metastases, but no metastatic foci
were identified in 6 by contrast-enhanced MRI.3) Also, contrast-enhanced MRI was excellent in detecting metastatic
foci in the posterior cranial fossa and cortex. In a report that compared the detectability for brain metastases of CT
using a contrast agent at 2-fold the usual dose, T2-weighted MRI, and contrast-enhanced T1-weighted MRI using a
contrast agent at a normal dose in 23 patients suspected to have brain metastases, 37, 40, and 67 metastatic foci could
be identified, respectively.4) In a study comparing the detectability for brain metastases of contrast-enhanced CT, T1weighted MRI, T2-weighted MRI, and contrast-enhanced T1-weighted MRI using a contrast agent at a usual and 3-fold
doses, decreasing numbers of metastatic foci were detected by contrast-enhanced T1-weighted MRI at a 3-fold dose,
contrast-enhanced T1-weighted MRI at a usual dose, contrast-enhanced CT, T2-weighted MRI, and non-enhanced T1weighted imaging in this order. The detectability was significantly higher in contrast-enhanced T1-weighted MRI at a
3-fold dose compared with the other imagings, and the difference was particularly notable in the detection of metastatic
lesions 5 mm or less in diameter.5) In a report prospectively evaluating contrast-enhanced CT and contrast-enhanced
T1-weighted MRI using a contrast agent at 2-fold the usual dose and a 1.5T system in 134 consecutive patients who
underwent the examination for staging of lung cancer, metastases were identified in 19 by contrast-enhanced MRI and in
12 by contrast-enhanced CT, with a significant difference.6) Since these reports consistently indicated the superiority of
contrast-enhanced MRI, it should be recommended as the first choice imaging modality for the evaluation of metastatic
brain tumors.
The dose of the contrast agent, scan timing, size of the metastatic focus, magnetic field strength, and scanning sequence
have been evaluated as factors that affect the detectability of lesions on contrast-enhanced MRI. There have been a few
reports that the sensitivity for brain metastases was increased by administering the contrast agent at 3-fold a usual dose
compared with usual dose.5,7-10) According to a report evaluating the effects of the dose of the contrast agent, interval
between the administration of the contrast agent and scanning, and size of the metastatic focus on the delineability
of lesions at 1.5T in 45 patients with metastatic brain tumors, all metastatic foci larger than 10 mm in diameter could
be identified regardless of the dose of the contrast agent or the interval between the administration and scanning, but
the detectability of lesions 10 mm or less was affected by the dose of the contrast agent and the interval between the
administration and scanning.8) About twice as many metastatic foci less than 5 mm in diameter were detected by scans
20 minutes compared with immediately after the administration of the contrast agent, about 3 times more metastatic foci
could be delineated at 3-fold the usual dose in scans immediately after the administration, and more metastatic lesions
were delineated in scans immediately after the administration of the contrast agent at 3-fold the usual dose than in
scans 20 minutes after the administration at the usual dose. From these results, the report concluded that the dose of the
contrast agent exerts the greatest effect on the detectability of small lesions.8) In a report comparing the delineability of
brain metastases between 3-fold the usual dose and usual dose and between magnetic field strengths of 1.5 and 3T, the
detectability was highest by scanning at 3T and 3-fold the usual dose.9) For metastatic foci less than 5 mm in diameter,
the detectability was significantly higher with 3-fold the usual dose than usual dose at both magnetic field strengths.
On the other hand, in a report prospectively evaluating 136 consecutive patients suspected to have brain metastasis
26
The Japanese imaging guideline 2013
CQ 012
at 1.5T, tripling the dose was not useful in all patients, because false positives increased, and tripling the dose was
recommended only for lesions that are unclear at a usual dose and solitary metastases.11) In Japan, the administration
of an MR contrast agent is permitted at a maximum of 2-fold the usual dose for patients suspected to have brain
metastases. Therefore, administering a contrast agent at 2-fold the usual dose in patients showing unclear results at the
usual dose or solitary metastases is recommended.
Concerning the MRI procedure at 3.0T for imaging of brain metastases, 3-dimensional sequences such as 3-D gradient
echo and 3-D fast spin echo sequences have been reported to be useful.12-14) Nephrogenic systemic fibrosis (NSF) has
been widely recognized recently as a serious adverse effect of gadolinium-based contrast agents.15) Therefore, contrast
agents should be administered carefully with evaluation of renal function.
Index words and secondary materials used as references
A search of PubMed was performed using “brain metastasis”, “CT”, and “MRI” as key words. Evidence-Based
Imaging: Improving the Quality of Imaging in Patient Care, Springer, 2011 was also used as a reference.
References
1) Russell EJ et al: Multiple cerebral metastases: detectability with Gd-DTPA-enhanced MR imaging. Radiology 165: 609-617, 1987 (Level 3)
2) Sze G et al: Intraparenchyma brain metastases: MR imaging versus contrast-enhanced CT. Radiology 168: 187-194, 1988 (Level 2)
3) Sze G et al: Detection of brain metastases: comparison of contrast-enhanced MR with unenhanced MR and enhanced CT. AJNR 1: 785-791,
1990 (Level 3)
4) Davis PC et al: Diagnosis of cerebral metastases: double-dose delayed CT vs contrast-enhanced MR imaging. AJNR 12: 293-300, 1991
(Level 3)
5) Akeson P et al: Brain metastases--comparison of gadodiamide injection-enhanced MR imaging at standard and high dose, contrast-enhanced
CT and non-contrast-enhanced MR imaging. Acta Radiol 36: 300-306, 1995 (Level 3)
6) Suzuki K et al: Magnetic resonance imaging and computed tomography in the diagnoses of brain metastases of lung cancer. Lung Cancer 46:
357-360, 2004 (Level 3)
7) Yuh WT et al: Phase III multicenter trial of high-dose gadoteridol in MR evaluation of brain metastases. AJNR 15: 1037-1051, 1994 (Level 2)
8) Yuh WT et al: The effect of contrast dose, imaging time, and lesion size in the MR detection of intracerebral metastasis. AJNR 16: 373-380,
1995 (Level 2)
9) Ba-Ssalamah A et al: Effect of contrast dose and field strength in the magnetic resonance detection of brain metastases. Invest Radiol 38:
415-422, 2003 (Level 3)
10) Trattnig S et al: The optimal use of contrast agents at high field MRI. Eur Radiol 16: 1280-1287, 2006 (Level 5)
11) Sze G et al: Comparison of single- and triple-dose contrast material in the MR screening of brain metastases. AJNR 19: 821-828, 1998 (Level
2)
12) Kakeda S et al: Detection of brain metastasis at 3T: comparison among SE, IR-FSE and 3D-GRE sequences. Eur Radiol 17: 2345-2351, 2007
(Level 2)
13) Kato Y et al: Usefulness of contrast-enhanced T1-weighted sampling perfection with application-optimized contrasts by using different flip
angle evolutions in detection of small brain metastasis at 3T MR imaging: comparison with magnetization-prepared rapid acquisition of gradient echo imaging. AJNR 30: 923-929, 2009 (Level 2)
14) Nagao E et al: 3D turbo spin-echo sequence with motion-sensitized driven-equilibrium preparation for detection of brain metastases on 3T MR
imaging. AJNR 32: 664-670, 2011 (Level 2)
15) Wang Y et al: Incidence of nephrogenic systemic fibrosis after adoption of restrictive gadolinium-based contrast agent guidelines. Radiology
260: 105-111, 2011 (Level 2)
27
The Japanese imaging guideline 2013
1. Brain and nervous system
13
What MRI techniques are appropriate for patients
suspected to have primary parenchymal tumor of the
brain?
Recommendation
grade
A
B
C1
A Contrast-enhanced MRI
B Diffusion-weighted imaging
C1 Perfusion imaging, MR spectroscopy
Contrast-enhanced MRI is strongly recommended because it provides information
useful for the evaluation of the site, properties, and degree of malignancy and
differential diagnosis of primary parenchymal tumors of the brain.
Diffusion-weighted imaging is recommended, because it is useful for the evaluation
of the properties and degree of malignancy and differential diagnosis of primary
parenchymal tumors of the brain.
Since useful information not obtained by conventional MRI sequences may be
acquired by the use of advanced imaging techniques such as perfusion imaging and
MR spectroscopy, they may be worth considering.
Background/objective
In addition to regular MR sequences including T1-weighted, T2-weighted, and FLAIR imaging, techniques such as
contrast-enhanced MRI, diffusion-weighted imaging, perfusion imaging, and MR spectroscopy (MRS) are available for
the examination of primary parenchymal tumors of the brain such as glioma (Figure). There have been various reports
concerning the usefulness of these methods. In this section, the significance of the addition of contrast-enhanced MRI,
diffusion-weighted imaging, and advanced imaging techniques to conventional MR sequences is evaluated.
Comments
When primary brain tumors are suspected by CT or non-contrast MRI, contrast-enhanced MRI using a gadoliniumbased contrast agent is important for the evaluation of the site, properties, degree of malignancy and differential
diagnosis of the lesions.1,2) Specifically, in glioma, the presence of a contrast-enhanced area and inclusion of an area
of ring-like enhancement are useful as findings suggestive of a highly malignant lesion. Also, contrast-enhanced
MRI is necessary for the determination of the biopsy site and extent of surgical resection and planning of radiation
therapy. Multiple contrast-enhanced lesions observed on contrast-enhanced MRI suggest metastatic brain tumors,
brain abscesses, multiple sclerosis, etc. rather than primary parenchymal tumors of the brain. If the ring of ring-like
enhancement is interrupted in the gray mater, a demyelinated lesion rather than a tumor is suspected.
Although the incidence of adverse events due to a gadolinium-based contrast agent is very low at 0.4-0.76%, 3,4)
nephrogenic systemic fibrosis (NSF) has been reported as a serious adverse event in nephropathy patients and has also
been observed in Japan.5) Terminal nephropathy on long-term hemodialysis, an estimated glomerular filtration rate
(eGFR) of less than 30 mL/min/1.73 m2, and acute renal failure are contraindications for the use of a gadolinium-based
contrast agent, and its unnecessary administration in other conditions must also be avoided.5)
Diffusion-weighted imaging, which can be performed in a scanning time of about 1 minute and readily permits
quantitative evaluation, has been accepted widely and is also useful for the examination of brain tumors. The apparent
diffusion coefficient (ADC) calculated from diffusion-weighted images is useful for the differentiation between brain
abscesses and tumoral lesions with necrosis,6) estimation of the degree of malignancy in glial tumors,7,8) differential
diagnosis of primary brain tumors,9,10) differential diagnosis of 3 brain tumors, i.e., highly malignant glioma, malignant
lymphoma, and metastatic brain tumors,11,12) and prognosis of malignant lymphoma and astrocytoma.13,14)
In perfusion imaging, the relative cerebral blood volume (rCBV) is often used for the evaluation of brain tumors.
In perfusion analysis, a semi-quantitatively standardized tumor blood flow (normalized CBV) is often used by
calculating the ratio of the rCBV in the tumor area relative to that in the contralateral normal brain. In glioma, the
rCBV in the tumor is positively correlated with the tumor vascular bed and is useful for the evaluation of the degree of
malignancy.15-19) It is also reportedly useful for the differential diagnosis of glioma from other brain tumors and tumorlike lesions20-22) and the evaluation of the therapeutic effect and outcome after treatment of glioma.23,24)
On MRS, proton is usually used as the target, and N-acetyl aspartic acid (NAA), choline (Cho), creatine (Cr), and
lactic acid (Lac) are primarily examined in brain tumors. NAA, a metabolite present exclusively in neurons, decreases
in various diseases. Cho is a metabolite and a material of phospholipids necessary for cell membrane metabolism. It is
considered to be correlated with disruption and enhancement of cell membrane metabolism and, in glioma, increases
with the degree of malignancy. MRS is useful for the estimation of the degree of malignancy of glioma 25,26) and
differentiation between glioblastoma and brain abscess. Also, an increase in the Cho/Cr ratio in the periphery of a tumor
showing no contrast enhancement suggests invasive malignant tumor and is useful for its differentiation from metastatic
28
The Japanese imaging guideline 2013
CQ 013
A
Cho
B
Lac
Cr
NAA
C
D
E
Figure: Glioblastoma
A T2-weighted image B Contrast-enhanced T1-weighted image C ADC map D Perfusion-weighted image
(relative CBV map) E MR spectroscopy
In the T2-weighted image, a cystic mass is observed on the left side of the splenium (A), and marked capsule-like
ring enhancement and enhancement of solid components are observed in the contrast-enhanced T1-weighted image
(B). In the ADC map, the ADC value is lower in solid components than in the capsule (C). In the perfusion-weighted
image, the rCBV are increased in the contrast-enhanced area (D). MR spectroscopy shows an increase in choline
(Cho), a decrease in N-acetyl aspartic acid (NAA), and an increase in lactic acid (Lac) compared with creatine (Cr)
as a standard, which are typical findings in malignant glioma (E).
brain tumors.27)
Index words and secondary materials used as references
A search of PubMed was performed using “glioma”, “contrast enhanced MRI”, “diffusion-weighted”, “perfusion
MRI”, and “MR spectroscopy” as key words. Joint Committee for Drafting the Guidelines for the Implementation
of CT/MR Perfusion Imaging eds.: Guidelines for the Implementation of CT/MR Perfusion Imaging 2006, Japanese
Society for Magnetic Resonance in Medicine Study Group Committee for the Evaluation of the Clinical Utility of
Proton MRS eds.: Clinical Utility Consensus Guidelines of Proton MRS 2009, and Medina L eds.: Evidence-Based
Imaging: Improving the Quality of Imaging in Patient Care: 2011 were also used as references.
References
1) Runge VM et al: Central nervous system: review of clinical use of contrast media. Top Magn Reson Imaging 12: 231-263, 2001 (Level 5)
2) Essig M et al: MR imaging of neoplastic central nervous system lesions: review and recommendations for current practice. AJNR 33: 803-817,
2011 (Level 5)
3) Forsting M, Palkowitsch P: Prevalence of acute adverse reactions to gadobutrol--a highly concentrated macrocyclic gadolinium chelate: review
of 14, 299 patients from observational trials. Eur J Radiol 74: e186-192, 2010 (Level 3)
4) Morgan DE et al: Assessment of adverse reaction rates during gadoteridol-enhanced MR imaging in 28, 078 patients. Radiology 259: 109-116,
2011 (Level 3)
5) Pharmaceutical and Food Safety Bureau, Ministry of Health, Labour and Welfare: Pharmaceuticals and Medical Devices Safety Information
No. 285: http://www1.mh1w.go.jp/kinkyu/iyaku_j/anzenseijyouhou/285.pdf, 2011 (Level 5)
6) Desprechins B et al: Use of diffusion-weighted MR imaging in differential diagnosis between intracerebral necrotic tumors and cerebral
abscesses. AJNR 20: 1252-1257, 1999 (Level 4)
7) Lee EJ et al: Preoperative grading of presumptive low-grade astrocytomas on MR imaging: diagnostic value of minimum apparent diffusion
coefficient. AJNR 29: 1872-1877, 2008 (Level 3)
8) Murakami R et al: Grading astrocytic tumors by using apparent diffusion coefficient parameters: superiority of a one- versus two-parameter
29
The Japanese imaging guideline 2013
1. Brain and nervous system
pilot method. Radiology 251: 838-845, 2009 (Level 3)
9) Yamasaki F et al: Apparent diffusion coefficient of human brain tumors at MR imaging. Radiology 235: 985-991, 2005 (Level 3)
10) Rumboldt Z et al: Apparent diffusion coefficients for differentiation of cerebellar tumors in children. AJNR 27: 1362-1369, 2006 (Level 3)
11) Kitis O et al: Minimum apparent diffusion coefficients in the evaluation of brain tumors. Eur J Radiol 55: 393-400, 2005 (Level 3)
12) Toh CH et al: Primary cerebral lymphoma and glioblastoma multiforme: differences in diffusion characteristics evaluated with diffusion tensor
imaging. AJNR 29: 471-475, 2008 (Level 3)
13) Barajas RF et al: Diffusion-weighted MR imaging derived apparent diffusion coefficient is predictive of clinical outcome in primary central nervous system lymphoma. AJNR 31: 60-66, 2010 (Level 3)
14) Murakami R et al: Malignant supratentorial astrocytoma treated with postoperative radiation therapy: prognostic value of pretreatment quantitative diffusion-weighted MR imaging. Radiology 243: 493-499, 2007 (Level 3)
15) Maeda M et al: Tumor vascularity in the brain: evaluation with dynamic susceptibility-contrast MR imaging. Radiology 189: 233-238, 1993
(Level 3)
16) Aronen HJ et al: Cerebral blood volume maps of gliomas: comparison with tumor grade and histologic findings. Radiology 191: 41-51, 1994
(Level 3)
17) Sugahara T et al: Correlation of MR imaging blood volume maps with histologic and angiographic determination of vascularity of gliomas. AJR
171: 1479-1486, 1998 (Level 3)
18) Knopp EA et al: Glial neoplasms: dynamic contrast-enhanced T2*-weighted MR imaging. Radiology 211: 791-798, 1999 (Level 3)
19) Law M et al: Glioma grading: sensitivity, specificity, and predictive values of perfusion MR imaging and proton MR spectroscopic imaging compared with conventional MR imaging. AJNR 24: 1989-1998, 2003 (Level 3)
20) Cha S et al: Dynamic contrast-enhanced T2*-weighted MR imaging of tumefactive demyelinating lesions. AJNR 22: 1109-1116, 2001 (Level 3)
21) Law M et al: High-grade gliomas and solitary metastases: differentiation by using perfusion and proton spectroscopic MR imaging. Radiology
222: 715-721, 2002 (Level 3)
22) Hakyemez B et al: Evaluation of different cerebral mass lesions by perfusion-weighted MR imaging. J Magn Reson Imaging 24: 817-824, 2006
(Level 3)
23) Law M et al: Low-grade gliomas: dynamic susceptibility-weighted contrast-enhanced perfusion MR imaging--prediction of patient clinical
response. Radiology 238: 658-667, 2006 (Level 3)
24) Hirai T et al: Prognostic value of perfusion MR imaging of high-grade astrocytomas: long-term follow-up study. AJNR 29: 1505-1510, 2008
(Level 3)
25) Stadlbauer A et al: Preoperative grading of gliomas by using metabolite quantification with high spatial resolution proton MR spectroscopic
imaging. Radiology 238: 958-969, 2006 (Level 3)
26) Zonari P et al: Multimodal MRI in the characterization of glial neoplasms: the combined role of single-voxel MR spectroscopy, diffusion imaging
and echo-planar perfusion imaging. Neuroradiology 49: 795-803, 2007 (Level 3)
27) Lai PH et al: In vivo differentiation of aerobic brain abscesses and necrotic glioblastomas multiforme using proton MR spectroscopic imaging.
AJNR 29: 1511-1518, 2008 (Level 3)
30
The Japanese imaging guideline 2013
CQ 014
14
What imaging modalities are appropriate for
diagnosing Alzheimer’s disease?
Recommendation
grade
B
B MRI, SPECT
MRI is recommended, because it can detect atrophy of the medial temporal lobe
characteristic of Alzheimer’s disease and is also useful for diagnosing diseases that
cause cognitive impairment other than Alzheimer’s disease.
Brain perfusion SPECT is recommended, because it can delineate reduced blood
flow in the bilateral temporal and parietal lobes and posterior cingulate gyrus,
characteristic of Alzheimer’s disease
Background/objective
The prevalence of dementia is increasing worldwide, and the increase in mild dementia, particularly Alzheimer disease
(AD), associated with aging of the population is also a social issue in Japan. In this section, the usefulness of MRI, brain
perfusion SPECT, and PET for diagnosing AD is evaluated.
Comments
With the development of diagnostic imaging techniques, it has become possible to detect mild brain atrophy and
decreases in the blood flow or metabolism associated with dementia, and the role of imaging techniques in the diagnosis
of AD has changed from a supplementary tool to exclude of dementing disorders other than AD to an important means
for early diagnosis. Moreover, statistical image analysis concerning the brain volume, cerebral blood flow, and sugar
metabolism and amyloid PET are reported to have high predictive precision regarding the conversion of mild cognitive
impairment (MCI) to AD and are expected to make clinical contributions in the future.
1) MRI
A decrease in neurons is observed in the medial temporal lobe, resulting in atrophy of the brain parenchyma, from an
early stage of AD (Figure 1). In a meta-analysis of 12 papers evaluating atrophy of the medial temporal region using
MRI, AD patients could be discriminated from normal subjects at a sensitivity of 85% and a specificity of 88%.1) By
statistical image analysis using voxel-based morphometry (VBM), atrophy has been demonstrated in the posterior
cingulate gyrus, parietal lobe (precuneus), fusiform gyrus, and on the medial side of, and below, the frontal lobe as well
as the medial temporal lobe (hippocampus, entorhinal area).2) Conventionally, special software was necessary for VBM
analysis, but voxel-based specific regional analysis system for Alzheimer’s disease (VSRAD) for simple data analysis
has become available in Japan since 2006. The accuracy of the diagnoses by this technique with the hippocampus
and entorhinal area as a region of interest was 87.8%.3) As for MR techniques other than those for the morphological
diagnosis, the usefulness of 1H-MR spectroscopy and diffusion tensor imaging, which reflect changes in brain tissue in
AD, has been reported. By the former technique using the myo-inositol/N-acetyl aspartate (MI/NAA) ratio, AD could be
differentially diagnosed from healthy individuals at a sensitivity of 83% and a specificity of 98%.4) By the latter method,
a decrease in the diffusion anisotropy in the limbic system and uncinated fasciculus is reported to be a characteristic
finding.5)
2) Brain perfusion SPECT
In AD patents, the blood flow is reduced in the temporal and parietal lobes and from the precuneus to the posterior
cingulate gyrus compared with age-matched healthy individuals, and this can be detected by brain perfusion SPECT
(Figure 2). In a large-scale prospective study, AD patients and normal subjects could be differentiated by brain
perfusion SPECT with a sensitivity of 89% and a specificity of 80%.6) Compared with standard clinical examinations,
brain perfusion SPECT is inferior in sensitivity (74% vs. 81%) but superior in specificity (91% vs. 70%). In addition,
brain perfusion SPECT, which can discriminate AD from dementing disorders other than AD (frontotemporal dementia,
vascular dementia) with sensitivity and specificity of 70-79%, is also useful for discriminating AD from other dementing
disorders.7)
3) PET (18F-FDG PET/amyloid PET)
In Japan, the application of these procedures to AD patients is not covered by medical insurance. However, these
modalities are mentioned as they are reportedly useful for the diagnosis of AD. PET can detect decreases in glucose
metabolism in the posterior cingulate gyrus, precuneus, and parietal-temporal association area in AD patients. The
sensitivity and specificity of PET for discrimination of AD from normal individuals are 86-96 and 80-90%, respectively,
and its diagnostic performance is higher than that of brain perfusion SPECT.8-10) The diagnostic accuracy can be
31
The Japanese imaging guideline 2013
1. Brain and nervous system
Figure 1: Alzheimer’s disease
MRI Coronal FLAIR image Atrophy
of the bilateral medial temporal lobes
(hippocampi, parahippocampal gyrus).
Inferior
R
R-lateral
L
L
Superior
L
Posterior
L-lateral
R
L-medial
R
Anterior
20
R
30
R-medial
L
40
Figure 2: Alzheimer’s diseas
Brain perfusion SPECT (99mTc-ECD) Statistical analysis images: easy Z-score
imaging system (eZIS) Decreases in the blood flow in disease-specific areas
(posterior cingulate gyrus, precuneus, parietal region).
improved further (sensitivity: 95-97%, specificity: 100%) if it is combined with a statistical image analysis technique
such as three-dimensional stereotactic surface projection (3D-SSP).11) Amyloid PET is a technique to visually represent
accumulation of amyloid β protein in the brain of AD patients, and there have been a number of reports using 11C-PIB.
While its diagnostic sensitivity is high at 89%,12) accumulation of 11C-PIB may also be observed in some (10-30%)
of healthy elderly people, degenerative dementias other than AD such as dementia with Lewy bodies, and amyloid
angiopathy, and the specificity of amyloid PET is slightly lower than those of SPECT, MRI, and PET.13) Since the halflife of 11C is extremely short (20 minutes), the facilities that can perform amyloid PET using 11C-PIB are presently
limited. For the future, the routine clinical use of diagnostic preparations labeled with 18F, which has a longer half-life, is
anticipated.14)
Index words and secondary materials used as references
A search of PubMed was performed using “Alzheimer disease”, “diagnosis”, and “MRI or SPECT or PET” as key
words by restricting the search targets with human, meta-analysis, practice guideline, randomized controlled trial,
32
The Japanese imaging guideline 2013
CQ 014
and review. Also, Joint Committee for the Preparation of the Treatment Guidelines for Dementing Disorders, Societas
Neurologica Japonica eds.: The Treatment Guidelines for Dementing Disorders 2010 was used as a reference.
References
1) Scheltens P et al: Structural magnetic resonance imaging in the practical-assessment of dementia: beyond exclusion. Lancet Neurol 1: 13-21,
2002 (Level 3)
2) Karas GB et al: A comprehensive study of gray matter loss in patients with Alzheimer’s disease using optimized voxel-based morphometry.
Neuroimage 18: 895-907, 2003 (Level 4)
3) Hirata Y et al: Voxel-based morphometry to discriminate early Alzheimer’s disease from controls. Neurosci Lett 15: 269-274, 2005 (Level 4)
4) Shonk TK et al: Probable Alzheimer disease: diagnosis with proton MR spectroscopy. Radiology 195: 65-72, 1995 (Level 4)
5) Nakata Y et al: Tract-specific analysis for investigation of Alzheimer disease: a brief review. Jpn J Radiol 28: 494-501, 2010 (Level 4)
6) Jobst KA et al: Accurate prediction of histologically confirmed Alzheimer’s disease and the differential diagnosis of dementia: the use of
NINCDS-ADRDA and DSM-III-R criteria, SPECT, X-ray CT, and Apo E4 in medial temporal lobe dementias: Oxford Project to Investigate
Memory and Aging. Int Psychogeriatr 10: 271-302, 1998 (Level 3)
7) Dougall NJ et al: Systematic review of the diagnostic accuracy of 99 mTc-HMPAO-SPECT in dementia. Am J Geriatr Psychiatry 12: 554-570,
2004 (Level 3)
8) Zakzanis KK et al: A meta-analysis of structural and functional brain imaging in dementia of the Alzheimer’s type: a neuroimaging profile.
Neuropsychol Rev 13: 1-18, 2003 (Level 3)
9) Patwardhan MB et al: Alzheimer disease: operating characteristics of PET-a meta-analysis. Radiology 231: 73-80, 2004 (Level 3)
10) Bohnen NI: Effectiveness and safety of 18F-FDG PET in the evaluation of dementia: a review of the recent literature. J Nucl Med 53: 59-71,
2012 (Level 3)
11) Minoshima S et al: A diagnostic approach in Alzheimer’s disease using three dimensional-stereotactic surface projections of fluorine-18-FDG
PET. J Nucl Med 36: 1238-1248, 1995 (Level 4)
12) Edison P et al: Amyloid, hypometabolism, and cognition in Alzheimer disease: an [11C]PIB and [18F]FDG PET study. Neurology 13: 501-508,
2007 (Level 3)
13) Jack CR Jr et al: Alzheimer’s Disease Neuroimaging Initiative: serial PIB-MRI in normal, mild cognitive impairment and Alzheimer’s disease:
implications for sequence of pathological events in Alzheimer’s disease. Brain 132 (Pt 5): 1355-1365, 2009 (Level 4)
14) Barthel H et al: Cerebral amyloid-βPET with florbetaben (18F) in patients with Alzheimer’s disease and healthy controls: a multicentre phase 2
diagnostic study. Lancet Neurol: 10: 424-435, 2011 (Level 3)
33
The Japanese imaging guideline 2013
1. Brain and nervous system
15
What imaging modalities are appropriate for normal
pressure hydrocephalus?
Recommendation
grade
B
C1
B CT, MRI
C1 Brain perfusion SPECT
CT and, particularly, MRI, which are morphological imaging techniques, are
recommended, because they can delineate morphological abnormalities
characteristic of idiopathic normal pressure hydrocephalus (iNPH) and are useful
for its discrimination from other disorders that cause cognitive impairment including
Alzheimer’s disease.
Brain perfusion SPECT is also useful for discrimination of iNPH from other disorders
and may be worth considering.
Background/objective
While iNPH is “a treatable dementia”, the symptoms of which can be alleviated by CSF shunt surgery, its
differentiation from other disorders that cause similar symptoms is a prerequisite for evaluating indications for
this treatment. Various reports are observed concerning neuroimaging of iNPH. In this section, the usefulness of
neuroimaging techniques for the diagnosis of iNPH is evaluated.
Comments
1) Basic morphological changes in iNPH
In iNPH, characteristic findings described as “disproportionately enlarged subarachnoid-space hydrocephalus: DESH”
are observed, and they are useful for discrimination from other diseases presenting as ventricular dilation associated
with brain atrophy. In addition to ventricular dilation with an Evans index (maximum width between the frontal horns
of the lateral ventricles/maximum transverse internal diameter of the skull at the same level) exceeding 0.3, the findings
indicate uneven distribution of the subarachnoid space, i.e., narrowing at the high convexity and longitudinal fissure
of the cerebrum and widening at the sylvian fissure and basilar cistern (Figure). According to a prospective cohort
study performed in Japan to clarify the clinical significance of these findings (study of idiopathic normal pressure
hydrocephalus on neurological improvement: SINPHONI), their validity was confirmed by an 80% response rate to
VP shunt.1) In addition, an epidemiological study in Japan has demonstrated the presence of elderly people who show
morphological changes similar to those in DESH, though they are asymptomatic (asymptomatic ventriculomegaly with
features of iNPH on MRI: AVIM), and caution is necessary in the diagnosis.2)
2) CT
Generally, CT exceeds MRI in few respects. However, it is possible to evaluate morphological abnormalities in DESH
and other disorders such as local dilation of cerebral sulci, narrowing of the posterior half of the cingulate sulcus, and
sharpened callosal angle by preparing coronal and sagittal images using multi-planar reconstitution technique due to
improvements in special resolution associated with increases in detector rows.3,4)
3) MRI
Changes around the ventricles and in deep white matter are not essential for the diagnosis of iNPH and are also
observed in other disorders.1,3,5) While the flow void phenomenon of the cerebral aqueduct is frequently observed in
iNPH, it is a non-specific finding also noted in other diseases causing cognitive dysfunction. 3,5,6) The measurement
of the CSF flow rate by phase contrast MRI has been reported to be sensitive for the diagnosis of iNPH,7,8) but its
diagnostic value has not been established. Although changes in the diffusion anisotropy ratio and diffusion coefficient
in the cerebral white mater observed on diffusion tensor and diffusion-weighted imaging and a decrease in the N-acetyl
aspartate/creatine (NAA/Cr) ratio detected by 1H-MRS are useful for discrimination of iNPH patients from normal
individuals, they are also observed in other dementing disorders, and their diagnostic value remains unsettled. It is
possible to objectively evaluate findings reflecting DESH, i.e., dilation of the lateral ventricles and sylvian fissures and
narrowing of the high-convexity subarachnoid space, by statistical image analysis.11,12)
4) Brain perfusion SPECT
On brain perfusion SPECT, decreases in the blood flow are observed not only around the corpus callosum and sylvian
fissure but also in the cerebral cortex in various patterns, i.e., anterior-dominant, posterior-dominant, and diffuse.13)
Statistical image analysis suggests relative increases in the blood flow in the high-convexity and median regions in
addition to decreases in the blood flow, presumably reflecting a decrease in the subarachnoid space and an increase in
the density of the gray matter due to DESH.14) Such findings have been reported to be useful for discrimination of iNPH
34
The Japanese imaging guideline 2013
CQ 015
Figure: Normal pressure hydrocephalus
On coronal T2-weighted image, ventricular dilation,
narrowing of high-convexity sulci, enlargement of
the sylvian fissures, and decreases in the callosal
angle are observed.
from other dementing disorders including Alzheimer’s disease.13,14)
Index words and secondary materials used as references
A search of PubMed was performed using “idiopathic normal pressure hydrocephalus”, “CT”, “MRI”, “SPECT”,
“scintigraphy”, “cisternography”, “cerebral blood flow”, “MR spectroscopy”, and “imaging” as key words. The
Japanese Society of NPH iNPH Treatment Guidelines Preparation Committee eds: iNPH Treatment Guidelines, 2nd
edition was also used as a reference.
References
1) Hashimoto M et al: Study of INPH on neurological improvement (SINPHONI): diagnosis of idiopathic normal pressure hydrocephalus is supported by MRI-based scheme: a prospective cohort study. Cerebrospinal Fluid Res 7: 18, 2010 (Level 4)
2) Iseki C et al: Asymptomatic ventriculomegaly with features of idiopathic normal pressure hydrocephalus on MRI (AVIM) in the elderly: a prospective study in a Japanese population. J Neurol Sci 277: 54-57, 2009 (Level 4)
3) Ishii K et al: Clinical impact of the callosal angle in the diagnosis of idiopathic normal pressure hydrocephalus. Eur Radiol 18: 2678-2683, 2008
(Level 3)
4) Adachi M et al: Upper midbrain profile sign and cingulate sulcus sign: MRI findings on sagittal images in idiopathic normal-pressure hydrocephalus, Alzheimer’s disease, and progressive supranuclear palsy. Radiat Med 24: 568-572, 2006 (Level 4)
5) Algin O et al: Proton MR spectroscopy and white matter hyperintensities in idiopathic normal pressure hydrocephalus and other dementias. Br
J Radiol 83: 747-752, 2010 (Level 3)
6) Algin O et al: Morphologic features and flow void phenomenon in normal pressure hydrocephalus and other dementias. Are they really significant? Acad Radiol 16: 1373-1380, 2009 (Level 3)
7) Luetmer PH et al: Measurement of cerebrospinal fluid flow at the cerebral aqueduct by use of phase-contrast magnetic resonance imaging:
technique validation and utility in diagnosing idiopathic normal pressure hydrocephalus. Neurosurgery 50: 534-542, 2002 (Level 3)
8) Al-Zain FT et al: The role of cerebrospinal fluid flow study using phase contrast MR imaging in diagnosing idiopathic normal pressure hydrocephalus. Acta Neurochir Suppl 102: 119-123, 2008 (Level 3)
9) Hattingen E et al: Diffusion tensor imaging in patients with adult chronic idiopathic hydrocephalus. Neurosurgery 66: 917-924, 2010 (Level 4)
10) Tullberg M et al: White matter diffusion is higher in Binswanger disease than in idiopathic normal pressure hydrocephalus. Acta Neurol Scand
120: 226-234, 2009 (Level 4)
11) Ishii K et al: Voxel-based analysis of gray matter and CSF space in idiopathic normal pressure hydrocephalus. Dement Geriatr Cogn Disord
25: 329-335, 2008 (Level 3)
12) Yamashita F et al: Detection of changes in cerebrospinal fluid space in idiopathic normal pressure hydrocephalus using voxel-based morphometry. Neuroradiology 52: 381-386, 2010 (Level 3)
13) Sasaki H et al: Cerebral perfusion pattern of idiopathic normal pressure hydrocephalus studied by SPECT and statistical brain mapping. Ann
Nucl Med 21: 39-45, 2007 (Level 3)
14) Kobayashi S et al: Two-layer appearance on brain perfusion SPECT in idiopathic normal pressure hydrocephalus. A qualitative analysis by
using easy Z-score Imaging System, eZIS. Dement Geriatr Cogn Disord 28: 330-337, 2009 (Level 3)
35
The Japanese imaging guideline 2013
02
Head and neck
1
The Japanese imaging guideline 2013
2. Head and neck
16
Is MRI appropriate for the evaluation of the cause of
sensorineural hearing loss?
Recommendation
grade
B
Since MRI has a high detection power for vestibular schwannoma and is excellent in
delineating other inner ear/brain pathologies, it is recommended for the evaluation of
the cause of sensorineural hearing loss. It is also useful and recommended for the
evaluation of indications for the cochlear implant.
Background/objective
Sensorineural hearing loss is caused by various inner ear/brain pathologies including vestibular schwannoma. The
cochlear implant has become popular as a treatment for sensorineural hearing loss, and opportunities to perform imaging
examinations for the evaluation of its indications are increasing.
CT and MRI are often performed as diagnostic imaging techniques for sensorineural hearing loss. In this section,
whether or not these examinations are necessary in all patients presenting with sensorineural hearing loss, what are
examination procedures useful for initiating treatment, whether or not they are medico-economically efficient, and the
usefulness of MRI are evaluated.
Comments
In examination of unilateral progressive sensorineural hearing loss, MRI is often performed after otorhinological
examinations such as audiography and the auditory brainstem response (ABR) test. It is difficult to detect vestibular
schwannoma 1 cm or less in diameter by the ABR test alone, and about 10% of the patients have been reported to
be overlooked by an audiographic protocol aimed at vestibular schwannoma screening, indicating limitations in the
detectability of the disease by an otorhinological study alone.1,2) Regarding the cost of examination, a combination of the
ABR test and MRI is more expensive than contrast-enhanced MRI alone, and contrast-enhanced MRI is more expensive
than non-contrast MRI.1) However, the frequency of MRI examination may be reduced by performing audiography or
the ABR test, and the clinical significance of otorhinological examinations before MRI is not small.3)
Contrast-enhanced MRI is presently a standard MRI procedure for the evaluation of vestibular schwannoma. However,
in consideration of the recent improvements in MRI devices and imaging techniques, it may be possible to perform
initial screening by non-contrast MRI using high-resolution 3D heavily T2-weighted images.1,4-6) By comparison with
contrast-enhanced T1-weighted imaging, the sensitivity and specificity of non-contrast-enhanced 3D heavily T2-weighted
imaging for vestibular schwannoma have been reported to be 89-100% and 94-99.7%, respectively.7,8) However, the
detectability of vestibular schwannoma by this procedure depends markedly on the image quality and image reading
ability of the radiologist.1) Schwannoma also occurs, though rarely, in the labyrinth such as the cochlea, but false
negatives are rare on 3D heavily T2-weighted imaging. On contrast-enhanced MRI, however, false positives may occur
in disorders including labyrinthitis4,9,10) (Figure).
Since an onset pattern similar to that of sudden sensorineural hearing loss (SSHL) is observed in 10-20% of the
patients with vestibular schwannoma, it is necessary to evaluate and exclude vestibular schwannoma by MRI in patients
with SSHL.6) Sensorineural hearing loss is caused by labyrinthitis, trauma, brain tumor, cerebrovascular disorders,
multiple sclerosis, and superficial siderosis as well as vestibular schwannoma. MRI is superior to CT in the evaluation
of these disorders except for the diagnosis of temporal bone fracture.11-15)
For diagnostic imaging of unilateral or asymmetric sensorineural hearing loss in children, the modality must be selected
by understanding the characteristics of CT and MRI.12-15) CT is effective for delineating calcification, ossification,
decalcification, and abnormalities of the vestibular aqueduct, and MRI is superior in the evaluation of the cranial
nerves and membranous labyrinth. Also, CT is less expensive than MRI and can be performed in a shorter period, but it
involves X-ray exposure. MRI requires a long imaging time and may require sedation. In imaging examination before
cochlear implant surgery, the identification of the cochlear nerve, presence or absence of calcification or fibrosis of the
cochlea, presence or absence of inner ear anomalies, and their severity are information important for the evaluation of
indications and selection of candidates, and MRI is more effective than CT for the evaluation of the nerves and early
cochlear obstruction after meningitis.14)
Index words and secondary materials used as references
A search of PubMed was performed using “sensorineural hearing loss”, “hearing loss”, “vestibular schwannoma”,
“acoustic neurinoma”, “acoustic neuroma”, and “MRI” as key words, further limited to results with a date greater than
year 1990. The Japan Radiological Society and Japanese College of Radiology eds.: Guidelines for Diagnostic Imaging
2003 was also used as a reference.
2
The Japanese imaging guideline 2013
CQ 016
Figure Vestibular Schwannoma 3D heavily
T2-weighted image
A mass ( → ) is observed in the left internal
auditory meatus.
References
1) Fortnum H et al: The role of magnetic resonance imaging in the identification of suspected acoustic neuroma: a systematic review of clinical
and cost-effectiveness and natural history. Health Technol Assess 13: 1-154, 2009 (Level 1)
2) Cueva RA: Auditory brainstem response versus magnetic resonance imaging for the evaluation of asymmetric sensorineural hearing loss.
Laryngoscope 114: 1686-1692, 2004 (Level 3)
3) Newton JR et al: Magnetic resonance imaging screening in acoustic neuroma. Am J Otolaryngol 31: 217-220, 2010 (Level 3)
4) Annesely-Williams DJ et al: Magnetic resonance imaging in the investigation of sensorineural hearing loss: is contrast enhancement still necessary? J Laryngol Otol 115: 14-21, 2001 (Level 3)
5) Schmalbrock P et al: Assessment of internal auditory canal tumors: a comparison of contrast-enhanced T1-weighted and steady state
T2-weighted gradient echo MR imaging. AJNR 20: 1207-1213, 1999 (Level 3)
6) Stachler RJ et al: Clinical practice guideline: sudden hearing loss. Otolaryngol Head Neck Surg 146: S1-35, 2012 (Level 5)
7) Naganawa S et al: MR imaging of the inner ear: comparison of a three-dimensional fast spin-echo sequence with use of a dedicated quadrature-surface coil with gadolinium-enhanced spoiled gradient-recalled sequence. Radiology 208: 679-685, 1998 (Level 3)
8) Hermans R et al: MRI screening for acoustic neuroma without gadolinium: value of 3DFT-CISS sequence. Neuroradiology 39: 593-598, 1997
(Level 4)
9) Salzman KL et al: Intralabyrinthine scwannomas: imaging diagnosis and classification. AJNR 33: 104-109, 2012 (Level 5)
10) Tieleman A et al: Imaging of intralabyrinthine schwannomas: a retrospective study of 52 cases with emphasis on lesion growth. AJNR 29: 898905, 2008 (Level 3)
11) Swartz JD et al: Sensorineural hearing deficits: a systematic approach based on imaging findings. Radiographics 16: 561-574, 1996 (Level 5)
12) Simons JP et al: Computed tomography and magnetic resonance imaging in pediatric unilateral and asymmetric sensorineural hearing loss.
Arch Otolaryngol Head Neck Surg 132: 186-192, 2006 (Level 3)
13) Trimble K et al: Computed tomography and/or magnetic resonance imaging before pediatric cochlear implantation? Developing an investigative strategy. Otol Neurotol 28: 317-324, 2007 (Level 3)
14) Parry DA et al: Advantages of magnetic resonance imaging over computed tomography in preoperative evaluation of pediatric cochlear
Implant Candidates. Otol Neurotol 26: 976-982, 2005 (Level 4)
15) Huang BY et al: Pediatric Sensorineural Hearing Loss, Part 1: practical aspects for neuroradiologists. AJNR 33: 211-217, 2012 (Level 5)
3
The Japanese imaging guideline 2013
2. Head and neck
17
What imaging modalities are appropriate when an
intraocular tumor is suspected?
Recommendation
grade
B
C1
B MRI
C1 CT
MRI is recommended, because it shows higher tissue contrast than CT.
CT has a high detection power for calcification and is useful for the diagnosis of
retinoblastoma, so its use for the initial diagnosis may be considered. However,
the regular and frequent use of CT for the follow-up after treatment or its use for
screening of children for retinoblastoma is not recommended.
Background/objective
Regarding orbital/ocular disorders, CT is often performed in patents with orbital trauma and those who cannot be
sedated. Before the 1990s, CT was used frequently for the examination of orbital/ocular disorders, but MRI has become
widely available today, and the frequency of CT examinations for intraocular tumors has decreased due to X-ray
exposure and the lack of tissue contrast. In this section, CT and MRI are compared to evaluate what imaging modalities
should be selected for typical intraocular tumors (retinoblastoma frequently affecting children and malignant melanoma
frequently affecting adults).
Comments
1) Retinoblastoma
Of the retinoblastomas, 95% are diagnosed by the age of 5 years, and 56-72% are detected due to leukocoria. Since the
prognosis of retinoblastoma is markedly affected by the early diagnosis and treatment, diagnostic imaging is important.
Retinoblastoma is characteristically accompanied by calcification ( ≥ 90%), and CT, which has a higher detection power
for calcification than MRI or ultrasonography, is useful for its diagnosis.1-4) However, some question about the use of
CT as the first choice in consideration of X-ray exposure in the neonatal period/early childhood.5,6) As there is a report
that the detectability of calcification of retinoblastoma is about 96% by CT, 95% by ultrasonography, and 89% even by
MRI if sequences sensitive for calcification such as T2 star-weighted imaging are added,6) CT may not be indispensable
for the diagnosis of retinoblastoma. Also, there are retinoblastomas that show no clear mass formation or calcification,
and such lesions are difficult to diagnose without MRI or ultrasonography.1) At the very least, frequent CT examination
for the follow-up after treatment for retinoblastoma or the use of CT for screening of children for retinoblastoma is not
recommended.
Retinoblastoma presents a hyperdense image on CT, and contrast enhancement is observed in 27.5% of the patients, but
it is a non-specific finding.2,3) Also, the prognosis of retinoblastoma is affected by the presence or absence of choroidal
invasion, optic nerve invasion, intracranial infiltration, and dissemination. While choroidal and optic nerve invasion can
also be evaluated by CT, it can better be evaluated by MRI with high tissue contrast, and ultrasonography is superior for
the evaluation of minute extraocular infiltration.1-4,7) If a tumor infiltrates the vitreous body and subretinal space, it may
cause retinal detachment, and the differentiation between the tumor and subretinal effusion becomes necessary. MRI is
more effective than CT for this purpose.1-4) The administration of an iodine-based contrast medium is necessary for the
CT evaluation of tumor invasion, and MRI should be considered first line also from the viewpoint of X-ray exposure.
Bilateral retinoblastoma occurs in 25%, and trilateral retinoblastoma (retinoblastoma involving the bilateral retinae and
the pineal body or suprasellar region) occurs in 5-15%, of the patients with hereditary retinoblastoma. MRI is superior
to CT for the evaluation of intracranial infiltration of the tumor, presence or absence of suprasellar or pineal lesions, and
dissemination.1,5)
Diseases that exhibit white pupil and need discrimination from retinoblastoma include persistent hyperplastic primary
vitreous (PHPV) and Coats’ disease. This differentiation can be made by MRI with high tissue contrast.1,4)
2) Malignant choroidal melanoma
Chroidal melanoma tends to be hyperdense on CT and shows mild-moderate contrast enhancement on contrastenhanced CT.8-10) While the tumor can also be delineated by CT, MRI with high tissue contrast is superior. Melanoma
in particular often emits characteristic signals on MRI2,9,10) (Figure). MRI and ultrasonography surpasses CT in the
evaluation of extraocular infiltration of tumors.2,9,11) They are also more effective than CT for the separation and
discrimination of associated retinal detachment from tumor.9,10) Although melanomas 2 mm or less in diameter are
reportedly difficult to delineate by CT or MRI,8,10) they may be visualized by MRI due to the recent development of MRI
techniques and coils and the increased availability of MRI with a static magnetic field of 1.5T or above. There is no
4
The Japanese imaging guideline 2013
CQ 017
Figure: Ocular tumor (malignant melanoma)
T2-weighted image
A mass, which is hypointense compared with
the surrounding vitreous body, is observed in the
medial region of the right eye ball ( → ). It was a
malignant melanoma of the choroid.
evidence for recommending CT as the first choice imaging modality when malignant choroidal melanoma is suspected.
Index words and secondary materials used as references
A search of PubMed was performed using “retinoblastoma”, “uveal melanoma”, “ocular tumor”, “CT”, and “MRI” as
key words. The Japan Radiological Society and Japanese College of Radiology eds.: Guidelines for Diagnostic Imaging
2003 was also used as a reference.
References
1) Chung EM et al: From the archives of the AFIP: pediatric orbit tumors and tumorlike lesions: neuroepithelial lesions of the ocular globe and
optic nerve. RadioGraphics 27: 1159-1186, 2007 (Level 5)
2) Peyster RG et al: Intraocular tumors: evaluation with MR imaging. Radiology 168: 773-779, 1988 (Level 4)
3) Olivercorna H et al: CT diagnosis of retinoblastoma with histopathologic correlations. Eur Radiol 4: 307-313, 1994 (Level 4)
4) Beets-Tan RGH et al: Retinoblastoma: CT and MRI. Neuroradiology 36: 59-62, 1994 (Level 4)
5) de Graaf P et al: Guidelines for imaging retinoblastoma: imaging principles and MRI standardization. Pediatr Radiol 42: 2-14, 2012 (Level 5)
6) Galluzzi P et al: Is CT still useful in the study protocol of retinoblastoma? AJNR 30: 1760-1765, 2009 (Level 4)
7) Brrise HJ et al: Relevance of CT and MRI in retinoblastoma for the diagnosis of postlaminar invasion with normal-size optic nerve: a retrospective study of 150 patients with histological comparison. Pediatri Radiol 37: 649-656, 2007 (Level 4)
8) Mafee MF et al: Malignant uveal melanoma and similar lesions studied by computed tomography. Radiology156: 403-408, 1985 (Level 4)
9) Mafee MF et al: Malignant uveal melanoma and simulating lesions: MR imaging evaluation. Radiology 160: 773-780, 1986 (Level 4)
10) Matsumoto S et al: MR imaging of intraocular lesions: a comparison with CT. Jpn J Radiol Sco 52: 721-728, 1992 (Level 4)
11) Scott IU et al: Evaluation of imaging techniques for detection of extraocular extension of choroidal melanoma. Arch Ophthalmol 116: 897-899,
1998 (Level 4)
5
The Japanese imaging guideline 2013
2. Head and neck
18
Is MRI appropriate for pretreatment staging (T-stage)
of hypopharyngeal cancer?
Recommendation
grade
C1
MRI is recommended for the evaluation of invasion to cartilage, cervical esophagus,
and carotid artery associated with anterior/inferior infiltration of hypopharyngeal
cancer. However, its usefulness relative to CT has not been defined, and its
complementary use with other examinations is necessary.
Background/objective
Concerning the T stage of hypopharyngeal cancer, TNM Classification of Malignant Tumours, Sixth Edition classifies
invasion to the thyroid cartilage, cricoid cartilage, and median structures and soft tissues of the neck such as the
hyoid bone, thyroid gland, and esophagus as T4a, and invasion to the prevertebral fascia and mediastinum or invasion
circumferentially surrounding the carotid artery as T4b, and accurate evaluation by imaging techniques is important. In
this section, whether or not MRI is recommended for imaging examination for pretreatment T staging is evaluated by
comparing MRI with CT and PET.
Comments
For the preoperative imaging examination of hypopharyngeal cancer, CT is the first choice because of its superior
cost effectiveness, simplicity, and evaluation of cartilage invasion.1,2) Regarding pretreatment staging (T-staging), there
have been few studies with a high evidence level exclusively on hypopharyngeal cancer, but many studies including
laryngeal cancer, which is anatomically similar, and the prognosis of which largely depends on the presence or absence
of cartilage invasion, have been reported.
In studies comparing preoperative CT and MRI for the evaluation of cartilage invasion in laryngeal cancer, MRI was
more sensitive but less specific than CT because of overestimation of inflammatory changes.3,4) Also, the addition of
erosion and lysis of cartilage to the diagnostic criteria of CT improves the sensitivity but decreases the specificity.5) In a
report using MD-CT, also, no significant improvement in the diagnostic accuracy was noted.6)
The area from the posterior cricoid cartilage to the cervical esophagus is more clearly delineated by MRI than CT due
to greater tissue contrast.1) Also, the specificity was reported to have improved markedly by discriminating inflammatory
changes as hyperintensity on T2-weighted imaging and higher contrast than tumor on T1-weighted imaging from
tumor invasion as equal contrast.7) Therefore, MRI is suggested to become a modality comparable to CT for accurate
evaluation of cartilage invasion.
Regarding invasion to the larynx and cervical esophageal region, the tumor volume tends to be overestimated on CT
and MRI due to modification of findings by inflammatory changes.8) Also, FDG-PET tends to underestimate the tumor
volume than CT or MRI,9) and MRI is inferior to CT in the evaluation of invasion to the lateral or posterior pharyngeal
wall but is advantageous in the evaluation of longitudinal invasion10) (Figure).
Thus, it is considered important to comprehensively evaluate the extent of involvement and distant metastasis of tumor
by using CT, MRI and PET findings complementarily in addition to physical and endoscopic findings on otorhinological
examination.
Index words and secondary materials used as references
A search of PubMed was performed using “larynx”, “hypopharynx”, “head and neck”, “carcinoma”, “MRI”, and “CT”
as key words and further limited to studies since 1982. The Japan Society for Head and Neck Cancer eds: Guidelines for
the Management of Head and Neck Cancer 2009 was also used as a reference.
References
1) Schmaluss IM et al: Postcrinoid region and cervical esophagus: Normal appearance at CT and MR imaging. Radiology 214: 237-246, 2000
(Level 4)
2) Becker M et al: Imaging of the larynx, hypopharynx. Eur J Radiol 66: 460-479, 2008(Level 5)
3) Becker M et al: Neoplastic invasion of the laryngeal cartilage: comparison of MR imaging and CT with histopathologic correlation. Radiology
194: 661-669, 1995 (Level 4)
4) Zbären P et al: Pretherapeutic staging of laryngeal carcinoma. Clinical findings, computed tomography, and magnetic resonance imaging compared with histopathology. Cancer 77: 1263-1273, 1996 (Level 3)
5) Becker M et al: Neoplastic invasion of the laryngeal cartilage: reassessment of criteria for diagnosis at CT. Radiology 203: 521-532, 1997
(Level 4)
6) Li B et al: Overstaging of cartilage invasion by multidetector CT scan for laryngeal cancer and its potential effect on the use of organ preserva-
6
The Japanese imaging guideline 2013
C Q 01 8
A
B
C
Figure: Hypopharyngeal cancer (T4a N2b M0)
A MRI T2-weighted image B MRI Coronal STIR image C Contrast-enhanced CT: On T2-weighted imaging, a tumor
slightly more hyperintense than muscle considered to have developed from the left piriform recess is observed ( → ). On the
coronal image, infiltration from the mesopharynx to the supraglottal cavity is obvious. Enlarged lymph node aggregate at the
left internal jugular level. No invasion of the thyroid cartilage was noted on CT.
tion with chemoradiation. Br J Radiol 84: 64-69, 2011 (Level 4)
7) Becker M et al: Neoplastic invasion of laryngeal cartilage: reassessment of criteria for diagnosis at MR imaging. Radiology 249: 551-559, 2008
(Level 4)
8) Banko B et al: Diagnostic significance of magnetic resonance imaging in preoperative evaluation of patients with laryngeal tumors. Eur Arch
Otorhinolaryngol 268: 1617-1623, 2011 (Level 4)
9) Daisne JF et al: Tumor volume in pharyngolaryngeal squamous cell carcinoma: comparison at CT, MR imaging, and FDG PET and validation
with surgical specimen. Radiology 233: 93-100, 2004 (Level 4)
10) Srinivasan A et al: Utility of pretreatment mean apparent diffusion coefficient and apparent diffusion coefficient histograms in prediction of outcome to chemoradiation in head and neck squamous cell carcinoma. J Comput Assist Tomogr 36: 131-137, 2012 (Level 4)
7
The Japanese imaging guideline 2013
2. Head and neck
19
What are imaging modalities appropriate for the evaluation of the effects of
chemoradiotherapy for head and neck squamous cell carcinoma? (Which of CT, MRI, and
PET are useful for the efficacy evaluation, and when should they be performed?)
Recommendation
grade
B
C1
B CT, MRI, PET
Images that serve as a baseline are necessary for long-term observation following
chemoradiotherapy, and CT is recommended for this purpose. CT images about 6-8
weeks after the end of treatment are appropriate as baseline images.
MRI is recommended to obtain baseline images for the follow-up of cancers occurring
near the skull base. Baseline MR imaging should be obtained about 12-16 weeks
after the end of treatment.
PET shows high sensitivity and negative predictive value in the diagnosis of
recurrence and is recommended. The time appropriate for PET examination is 6-8
weeks after the end of treatment, because the sensitivity and positive predictive value
are low early following the end of treatment (within 4 weeks).
C1 CT, MRI
CT or MRI may be considered for evaluating the response to the chemotherapy
regimen during chemoradiotherapy, evaluating the radiosensitivity of the lesion during
radiotherapy, or follow-up immediately after the end of treatment.
A recommended interval of follow-up imaging is 3-4 months during the first 2 years,
when recurrence is considered likely, and 4-6 months during the next 3-5 years for
both CT and MRI.
Background/objective
Since head and neck squamous cell carcinoma may be cured completely by chemoradiotherapy, it is an important
treatment along with surgery, but the methods for the evaluation of its effects and follow-up vary among facilities, and
a variety of imaging techniques are selected. In this section, imaging modalities efficient and preferable for follow-up
examinations are evaluated.
Comments
Usually clinical examinations such as gross examination, endoscopy, and palpation are performed first to evaluate
the response to the chemotherapy regimen or to confirm the radiosensitivity of the lesion during chemoradiotherapy.
Ultrasonography, CT, or MRI is used to examine deep areas not approached by clinical examinations or objectively
measure the tumor size.1-4) While there is no evidence concerning indications for these modalities, guidelines for the
evaluation of therapeutic effects in solid tumors (RECIST Guidelines5)) recommend CT. However, if the lesion has been
delineated more accurately by MRI before treatment, the evaluation using MRI is acceptable. However, it is necessary
to perform CT or MRI using the same protocols as before treatment.
Images after chemoradiotherapy often differ considerably compared with pretreatment images due to the effects of
inflammation. Therefore, images that serve as a baseline are necessary for long-term follow-up.1,4) CT images about 6-8
weeks after the end of treatment are considered desirable as baseline images, but MR images are useful for the followup of cancers near the skull base.1,3,4) To obtain baseline images, it is recommended to perform MRI about 12-16 weeks
after the end of treatment.1,4)
A recommended interval of follow-up imaging is 3-4 months during the first 2 years, when recurrence is considered
likely, and 4-6 months during the next 3-5 years for both CT and MRI.1)
FDG-PET is the best modality for diagnosing the recurrence after treatment.6,7) However, its sensitivity and positive
predictive value have been invariably reported to be low early after the end of treatment (within 4 weeks).8-11) The
appropriate timing for FDG-PET is 6-8 weeks or more after treatment though it somewhat varies among reports. While
the appropriate timing of PET for long-term follow-up is reportedly12 months after treatment, after 21 and 33 months
are recommended for further follow-up by PET.1)
Although there are papers suggesting the usefulness of FDG-PET, MR spectroscopy, and measurement of ADC values
by diffusion-weighted MRI for the prognosis, the prognosis is excluded from the present guidelines.
Index words and secondary materials used as references
A search of PubMed was performed using “head and neck squamous cell carcinoma”, “evaluation after treatment”,
8
The Japanese imaging guideline 2013
CQ 019
“diagnostic imaging”, “MRI”, and “CT” as key words.
References
1) Manikantan K et al: Making sense of post-treatment surveillance in head and neck cancer: when and what of follow-up. Cancer Treat Rev 35:
744-753, 2009 (Level 1)
2) van den Broek GB et al: Response measurement after intraarterial chemoradiation in advanced head and neck carcinoma: magnetic resonance imaging and evaluation under general anesthesia? Cancer 106: 1722-1729, 2006 (Level 3)
3) Mukherji SK, Wolf GT: Evaluation of head and neck squamous cell carcinoma after treatment. AJNR 24: 1743-1746, 2003 (Level 5)
4) Lell M et al: Head and neck tumor: imaging recurrent tumor and post-therapeutic change with CT and MRI. Eur J Radiol 33: 239-247, 2000
(Level 3)
5) Therasse P et al: New guidelines to evaluate the Response to Treatment in Solid Tumors (RECIST Guideline). J Natl Cancer Inst 92: 205-216,
2000 (Level 5)
6) Malone JP et al: Early prediction of response to chemoradiotherapy for head and neck cancer: reliability of restaging with combined positron
emission tomography and computed tomography. Arch Otolaryngol Head Neck Surg, 2009 (Level 3)
7) Martin RC et al: Accuracy of positron emission tomography in the evaluation of patients treated with chemoradiotherapy for mucosal head and
neck cancer. Head Neck 31: 244-250, 2009 (Level 3)
8) Abqral R et al: Dose 18F-FDG PET/CT improve the detection of posttreatment recurrence of head and neck squamous cell carcinoma in
patients negative for disease on clinical follow-up? J Nucl Med 50: 24-29, 2009 (Level 4)
9) Horiuchi C et al: Early assessment of clinical response to concurrent chemoradiotherapy in head and neck carcinoma using fluoro-2-deoxy-dglucose positron emission tomography. Auris Nasus Larynx 35: 103-108, 2008 (Level 2)
10) Andrade RS et al: Posttreatment assessment of response using FDG-PET/CT for patients treated with definitive radiation therapy for head and
neck cancers. Int J Radiat Oncol Biol Phys 65: 1315-1322, 2006 (Level 3)
11) Kitagawa Y et al: Prospective comparison of 18F-FDG PET with conventional imaging modalities (MRI, CT, and 67Ga scintigraphy) in assessment of combined intraarterial chemotherapy and radiotherapy for head and neck carcinoma. J Nucl Med 44: 198-206, 2003 (Level 3)
9
The Japanese imaging guideline 2013
2. Head and neck
20
Is MRI appropriate for pretreatment staging
(T-staging) of oral cancer?
Recommendation
grade
C1
Although MRI is useful for the evaluation of the extent of invasion, no significant
difference compared with CT has been demonstrated. Also, while CT is considered
useful for the evaluation of bone cortex invasion, superficial invasion is not a criterion
for T4 stage in gingival cancer.
Background/objective
For the pretreatment staging of oral cancer, clinical interview, inspection, and palpation are performed first, and
diagnostic imaging is employed to objectively evaluate and record infiltration into deep areas and surrounding tissues.
CT evaluation is hampered by metal artifacts due to dental filling materials, and artifacts due to movements such as
respiration and swallowing pose problems in MRI.1-3) This section compares the recommendation levels of CT and MRI
as imaging modalities for the pretreatment T staging
Comments
In comparative studies with CT regarding T staging, MRI has been reported to have excellent sensitivity and
accuracy, but no statistical significance has been shown.3,4) Generally, MRI is excellent in soft tissue delineation and
is recommended for imaging evaluation of the extent of invasion.2-4) Also, in comparative studies with the addition of
FDG-PET, MRI has been shown to be useful for the preoperative evaluation of oral cancers, and FDG-PET has been
reported to provide little additional information contributing to T staging.5,6)
As for site-specific evaluations, in tongue cancer, it is necessary to study invasion into the tongue and surrounding
tissues. In the evaluation of the depth of early tongue cancer, a correlation between MRI measurements and histological
findings has been demonstrated using the thickness and depth of tumor from the mucosal surface as indices.7-10) A
correlation between the depth determined by MRI and cervical lymph node metastasis has also been reported.7-10)
Floor of mouth cancer and mandibular gingival cancer infiltrate into the mandible from an early stage. In maxillary
gingival cancer and hard palate cancer, invasion to the maxilla, maxillary sinus, and nasal cavity must be evaluated. In
the TNM classification of gingival cancer, superficial invasion to the bone cortex or alveolar region is not a criterion to
stage a lesion as T4 (Figure). Concerning the depth of mandibular gingival cancer, the Guidelines for the Management
of Oral Cancers 2009 proposed a classification by the mandibular canal. According to comparative studies of CT and
MRI for the evaluation of mandibular invasion,4,11-13) the sensitivity was 42-79% and 58-100%, specificity was 82100% and 73-97%, and accuracy was 74-92% and 86-94%, respectively, and the results varied among patients and
with the imaging equipment and method.12) However, there are many reports that MRI has high sensitivity4,11-13) but low
specificity.4,11,12) There is also a report that, with the addition of reconstructed images, the sensitivity, specificity, and
accuracy of CT for mandibular invasion are higher than those of MRI.14) Generally, CT and MRI are considered useful
for the evaluation of bone cortex and bone marrow invasion, respectively,1,2) and MRI is recommended for the T staging.
Regarding deep oral invasion, coronal images are occasionally useful for examining soft tissues and the mandible.2,15)
Contrast agents are used to more clearly delineate the extent of invasion of oral cancers, but precontrast T1-weighted
imaging is recommended in early floor of mouth cancer, which is visualized as a soft tissue mass replacing the
sublingual glands, to obtain contrast between the tumor and sublingual glands.15) Precontrast T1-weighted images are
also recommended for the evaluation of bone marrow invasion.1,2)
Index words and secondary materials used as references
A search of PubMed was performed using “oral”, “tongue”, “gingival”, “mandibular”, “squamous cell carcinoma”,
“MRI”, and “CT” as key words. The Japan Society for Oral Tumors/Japanese Society of Oral and Maxillofacial
Surgeons eds: Guidelines for the Management of Oral Cancers 2009 was also used as a reference.
References
1) Beil CM et al: Oral and oropharyngeal tumors. Eur J Radiol 66: 448-459, 2008 (Level 5)
2) Sigal R et al: CT and MR imaging of squamous cell carcinoma of the tongue and floor of the mouth. Radiographics 16: 787-810, 1996 (Level
5)
3) Leslie A et al: Staging of squamous cell carcinoma of the oral cavity and oropharynx: a comparison of MRI and CT in T- and N-staging. J
Comput Assist Tomogr 23: 43-49, 1999 (Level 3)
4) Wiener E et al: Comparison of 16-slice MSCT and MRI in the assessment of squamous cell carcinoma of the oral cavity. Eur J Radiol 58: 113-
10
The Japanese imaging guideline 2013
CQ 020
Figure: Stage T3 mandibular gingival cancer
(T1-weighted image)
In the TNM classification of gingival cancers,
superficial invasion to the bone cortex or alveolar
region is not a criterion for stage T4. In this case,
invasion to the alveolar region ( → ) is suggested,
but the lesion was staged as T3 due to its maximum
diameter on the mucosal surface, which was >4 cm.
118, 2006 (Level 4)
5) Dammann F et al: Rational diagnosis of squamous cell carcinoma of the head and neck region: comparative evaluation of CT, MRI, and
18FDG PET. AJR 184: 1326-1331, 2005 (Level 2)
6) Seitz O et al: 18F-Fluorodeoxyglucose-PET/CT to evaluate tumor, nodal disease, and gross tumor volume of oropharyngeal and oral cavity
cancer: comparison with MR imaging and validation with surgical specimen. Neuroradiology 51: 677-686, 2009 (Level 3)
7) Iwai H et al: Magnetic resonance determination of tumor thickness as predictive factor of cervical metastasis in oral tongue carcinoma.
Laryngoscope 112: 457-461, 2002 (Level 3)
8) Preda L et al: Relationship between histologic thickness of tongue carcinoma and thickness estimated from preoperative MRI. Eur Radiol 16:
2242-2248, 2006 (Level 3)
9) Jung J et al: Significant invasion depth of early oral tongue cancer originated from the lateral border to predict regional metastases and prognosis. Int J Oral Maxillofac Surg 38: 653-660, 2009 (Level 4)
10) Park JO et al: Diagnostic accuracy of magnetic resonance imaging (MRI) in the assessment of tumor invasion depth in oral/oropharyngeal
cancer. Oral Oncol 47: 381-386, 2011 (Level 2)
11) van den Brekel MWM et al: Assessment of tumour invasion into the mandible: the value of different imaging techniques. Eur Radiol 8: 15521557, 1998 (Level 4)
12) Gu DH et al: CT, MR, (18) F-FDG PET/CT, and their combined use for the assessment of mandibular invasion by squamous cell carcinomas
of the oral cavity. Acta Radiol 51: 1111-1119, 2010 (Level 2)
13) Vidiri A et al: Multi-detector row computed tomography (MDCT) and magnetic resonance imaging (MRI) in the evaluation of the mandibular
invasion by squamous cell carcinomas (SCC) of the oral cavity. Correlation with pathological data. J Exp Clin Cancer Res 29: 73, 2010 (Level
3)
14) Imaizumi A et al: A potential pitfall of MR imaging for assessing mandibular invasion of squamous cell carcinoma in the oral cavity. AJNR 27:
114-122, 2006 (Level 4)
15) Murakami R et al: MR imaging of squamous cell carcinoma of the floor of the mouth. Appearance of the sublingual and submandibular glands.
Acta Radiol 40: 276-281, 1999 (Level 4)
11
The Japanese imaging guideline 2013
2. Head and neck
21
Is MRI appropriate for the pretreatment staging
(T staging) of laryngeal cancer?
Recommendation
grade
C1
While MRI is considered useful for the evaluation of deep invasion, no significant
difference compared with CT has been shown.
Background/objective
The pretreatment staging of laryngeal cancer has been made conventionally by medical interview, inspection, and
palpation plus endoscopy, but images provided by CT or MRI are necessary for objectively evaluating the tumor
size and deep invasion. Moreover, as the sixth edition of the UICC TNM staging system began to classify not only
conditions with vocal cord fixation but also those showing invasion to the paraglottic space and/or slight erosion of the
thyroid cartilage as T3 (Figure), imaging evaluation has become more important.1) The usefulness of CT and MRI for
pretreatment T staging is compared.
Comments
According to studies in the 1990s comparing the effectiveness of preoperative CT and MRI for the evaluation of
cartilage invasion,2,3) the sensitivity was 66-67% and 89-94%, and the specificity was 87-94% and 74-84%, respectively.
MRI was superior in sensitivity but inferior in specificity due to overestimation of tumor due to inflammatory changes
compared with CT. There has recently been no comparative studies, and the usefulness of CT and MRI is evaluated
separately. In the reevaluation of cartilage invasion using CT,4) diagnostic criteria including erosion and lysis increased
the sensitivity but reduced the specificity. In a study using MDCT reported in 2011, no clear improvement was observed
in the diagnostic accuracy.5) There is also a report that arytenoid cartilage sclerosis, which is a CT diagnostic criterion,
is also observed in normal individuals or as a secondary change and is a non-specific finding.6) On the other hand, in
a study reevaluating MRI findings reported in 2008,7) the specificity was increased without reducing the sensitivity
by judging a condition in which cartilage shows a higher signal intensity than tumor on T2-weighted and postcontrast
T1-weighted imaging as inflammatory changes but a condition in which it is isointense as tumor invasion. In MRI
evaluation of cartilage invasion, it is necessary not only to note abnormal signals but also to use diagnostic criteria in
consideration of differentiation from inflammatory changes.
Submucosal pre-epiglottic and paraglottic invasion is delineated as a soft tissue image replacing fat tissue, and this
finding on CT and MRI has been reported to be highly sensitive and specific. 3,8) Concerning the evaluation of the
paraglottic space by MRI, overestimation due to inflammatory changes has been reported.9)
The primary treatment for pharyngeal cancer is radiotherapy for early cases and surgery for advanced cases. The
usefulness of pretreatment imaging examinations is evaluated according to pathological findings in surgical cases but
therapeutic efficacy in radiotherapy (±chemotherapy) cases. Concerning pre-radiotherapy MRI findings, invasion of
glottic cancer to the paraglottic space1,10) and invasion of supraglottic carcinoma to the pre-epiglottic space,11) which are
findings corresponding to stage T3, have been confirmed as prognostic factors related to local control. Also, abnormal
signals of the thyroid cartilage corresponding to stages T3 (slight erosion) and T4 (transmural invasion) are predictive
factors of the therapeutic efficacy.11,12) Moreover, the MRI diagnostic criteria for the discrimination between cartilage
invasion and inflammatory changes are also considered to be prognostic factors.13) Changes in the therapeutic strategy
should be evaluated in patients in whom the local control by radiotherapy is expected to be difficult, i.e., advanced
cases, but attention to the risk of losing the possibility of larynx preservation due to overestimation of MRI findings is
necessary.5)
Index words and secondary materials used as references
A search of PubMed was performed using “laryngeal”, “glottis”, “squamous cell carcinoma”, “MRI”, and “CT” as key
words and further limited to studies since 1990. The Japan Society for Head and Neck Cancer eds: The Guidelines for
the Management of Head and Neck Cancers 2009 was also used as a reference.
References
1) Murakami R et al: Prognostic factors of glottic carcinomas treated with radiation therapy: value of the adjacent sign on radiological examinations in the sixth edition of the UICC TNM staging system. Int J Radiat Oncol Biol Phys 61: 471-475, 2005 (Level 3)
2) Becker M et al: Neoplastic invasion of the laryngeal cartilage: comparison of MR imaging and CT with histopathologic correlation. Radiology
194: 661-669, 1995 (Level 2)
12
The Japanese imaging guideline 2013
CQ 021
Figure: Stage T3 glottic cancer (contrastenhanced T1-weighted image)
A l e s i o n i s d i a g n o s e d a s s t a g e T3 i f t h e r e i s
paraglottic space invasion ( → ) even without vocal
cord fixation. Also, the stage of glottis cancer is T3
if there is only superficial invasion to the thyroid
cartilage and T4 if it ruptures the thyroid cartilage.
3) Zbaren P et al: Pretherapeutic staging of laryngeal carcinoma. Clinical findings, computed tomography, and magnetic resonance imaging compared with histopathology. Cancer 77: 1263-1273, 1996 (Level 3)
4) Becker M et al: Neoplastic invasion of the laryngeal cartilage: reassessment of criteria for diagnosis at CT. Radiology 203: 521-532, 1997
(Level 2)
5) Li B et al: Overstaging of cartilage invasion by multidetector CT scan for laryngeal cancer and its potential effect on the use of organ preservation with chemoradiation. Br J Radiol 84: 64-69, 2011 (Level 2)
6) Agada FO et al: Computerised tomography vs. pathological staging of laryngeal cancer: a 6-year completed audit cycle. Int J Clin Pract 58:
714-716, 2004 (Level 4)
7) Becker M et al: Neoplastic invasion of laryngeal cartilage: reassessment of criteria for diagnosis at MR imaging. Radiology 249: 551-559, 2008
(Level 2)
8) Loevner LA et al: Can radiologists accurately predict preepiglottic space invasion with MR imaging? AJR 169: 1681-1687, 1997 (Level 4)
9) Banko B et al: Diagnostic significance of magnetic resonance imaging in preoperative evaluation of patients with laryngeal tumors. Eur Arch
Otorhinolaryngol 268: 1617-1623, 2011 (Level 4)
10) Murakami R et al: Early glottic squamous cell carcinoma. Predictive value of MR imaging for the rate of 5-year local control with radiation
therapy. Acta Radiol 41: 38-44, 2000 (Level 3)
11) Ljumanovic R et al: Supraglottic carcinoma treated with curative radiation therapy: identification of prognostic groups with MR imaging.
Radiology 232: 440-448, 2004 (Level 3)
12) Castelijns JA et al: Predictive value of MR imaging-dependent and non-MR imaging-dependent parameters for recurrence of laryngeal cancer
after radiation therapy. Radiology 196: 735-739, 1995 (Level 3)
13) Ljumanovic R et al: MR imaging predictors of local control of glottic squamous cell carcinoma treated with radiation alone. Radiology 244: 205212, 2007 (Level 3)
13
The Japanese imaging guideline 2013
2. Head and neck
22
Is the use of a contrast agent appropriate in CT for
paranasal sinus disease?
Recommendation
grade
B
C2
D
B For the diagnosis of paranasal sinus disease suspected to be tumor, the use of a
contrast agent on CT is recommended if the diagnosis cannot be made by MRI or if
MRI is unavailable.
C2 The evidence that the use of a contrast agent on CT as the initial imaging
examination contributes to the diagnosis of paranasl sinus disease is insufficient, and
it is not recommended.
D When CT is performed before functional endoscopic sinus surgery for chronic
sinusitis, the use of a contrast agent is unnecessary and is not recommended.
Background/objective
While the necessity of CT as an imaging modality for paranasal sinus disease should be evaluated first by comparing it
with other examinations including MRI and endoscopy, CT is used frequently today for screening of chronic sinusitis.
The usefulness of coronal CT as an examination before endoscopic surgery for chronic sinusitis has been established
with the recent development of endoscopic sinus surgery (ESS). 1-3) Under these circumstances, the use of a contrast
agent has no benefit and contrast use is unnecessary.
The objective of the use of CT for screening of chronic sinusitis is diagnosing complications such as mucocele/pyocele,
abscess, fungal infection, and tumors as well as preoperative roadmapping.4,5) CT is also performed in postoperative
follow-up to evaluate the persistence or recurrence of the tumor or inflammation. Whether or not the use of a contrast
agent in addition to non-contrast CT improves the diagnosability of these conditions is evaluated.
Comments
Concerning the necessity or usefulness of the use of a contrast agent in CT for paranasal sinus disease, there is no
study comparing the diagnostic power between contrast-enhanced and non-contrast CT, and the evidence is insufficient.
In diagnostic imaging of paranasal sinus disease, CT surpasses plain X-ray study or MRI in the evaluation of details
of anatomical bony structures and their changes due to space-occupying lesions. Particularly in ESS, coronal CT is
reported to be useful and is recommended.6) However, there is no report indicating the advantage of the use of a contrast
agent in ESS, and it is considered unnecessary (Figure). In the differential diagnosis of paranasal sinus disease, also,
the usefulness of CT depends entirely on its excellence in the evaluation of bone morphology such as the presence or
absence of destruction of anatomical bony structures7) and detection of calcification associated with fungal sinusitis,4)
and, for this purpose, also, there is no sufficient evidence supporting the use of a contrast agent.
Regarding individual diseases, also, there are a number of reports discussing the characteristics of CT images, but
none has suggested the benefit of the use of a contrast agent. As for the differential diagnosis of paranasal sinus disease,
however, there is a report suggesting the usefulness of contrast-enhanced MRI,5) and the use of a contrast agent is
considered appropriate if CT is performed for the differential diagnosis when MRI examination is impossible.8,9) There
is also a report that contrast-enhanced CT was useful for the differential diagnosis of inverted papilloma.10)
Index words and secondary materials used as references
A search of PubMed was performed using “paranasal sinus”, “maxillary sinus”, “CT”, “contrast media”, and “contrast
enhanced CT” as key words. The Japan Radiological Society and Japanese College of Radiology eds: Guidelines for
Diagnostic Imaging 2007 was also used as a reference.
References
1) Maroldi R et al: Paranasal sinus imaging. Eur J Radiol 66: 372-386, 2008(Level 5)
2) Baum U et al: Imaging of head and neck tumors - methods: CT, spiral-CT, multislice-spiral CT. Eur J Radiol 33: 153-160, 2000(Level 5)
3) Ide C et al: Chronic sinusitis: the role of imaging. Acta Otorhinolaryngol Belg 51: 247-258, 1997 (Level 5)
4) Seo YJ et al: Radiologic characteristics of sinonasal fungus ball: an analysis of 119 cases. Acta Radiol 52: 790-795, 2011 (Level 4)
5) Lanzieri CF et al: Use of gadolinium-enhanced MR imaging for differentiating mucocele from neoplasms in the paranasal sinuses. Radiology
178: 425-428, 1991 (Level 3)
14
The Japanese imaging guideline 2013
CQ 022
Figure: Chronic maxillary sinusitis
In patients who have mild clinical symptoms and are suspected to have simple chronic
sinusitis as this case, contrast-enhanced CT is unnecessary. If CT is performed before ESS
for chronic sinusitis, reconstructed coronal images are also necessary.
6) Hahnel S et al: Relative value of MR imaging as compared with CT in the diagnosis of inflammatory paranasal sinus disease. Radiology 210:
171-176, 1999 (Level 4)
7) Han MH et al: Cystic expansile masses of the maxilla: Differential diagnosis with CT and MR. AJNR 16: 333-338, 1995 (Level 4)
8) Som PM et al: Ethmoid sinus disease: CT evaluation in 400 cases. Part 2. Postoperating findings. Radiology 159: 599-604, 1986 (Level 3)
9) Som PM et al: Ethmoid sinus disease: CT evaluation in 400 cases. Part 1. Nonsurgical patients. Radiology 159: 591-597, 1986 (Level 3)
10) Dammann F et al: Inverted papilloma of the nasal cavity and the paranasal sinuses: using CT for primary diagnosis and follow up. AJR 172:
543-548, 1999 (Level 3)
15
The Japanese imaging guideline 2013
2. Head and neck
23
Is MRI appropriate in paranasal sinus diseases other
than tumor?
Recommendation
grade
B
C2
B MRI is recommended for patients suspected to have intraorbital extension of
inflammation or intracranial complications, immunodeficient patients, and patients with
fungal or unilateral sinusitis (excluding those clearly diagnosed to have odontogenic
maxillary sinusitis by CT).
C2 In usual sinusitis, there is no clear evidence indicating the usefulness of MRI
compared with CT, and MRI is not recommended.
Background/objective
CT has conventionally played a central role in diagnostic imaging of paranasal sinus diseases. Recently, MRI with
higher tissue contrast resolution has been increasingly used for its evaluation, and MRI findings in various paranasal
sinus diseases have been reported, but its indications are unclear. In this section, indications for MRI in paranasal sinus
diseases, particularly, sinusitis, are evaluated.
Comments
There have been few studies that evaluated the indications for MRI concerning all paranasal sinus diseases. This
is probably because paranasal sinus diseases include various pathological entities such as inflammatory and tumoral
lesions, each of which has multiple important evaluation items, and comprehensive evaluation of indications for MRI
is difficult. Presently, when paranasal sinus disease is suspected, clinical symptomatic and rhinoscopic examinations
are performed first, and conservative treatments are carried out. If the disease resists conservative treatments, or
complications are suspected, and if surgery is considered necessary, CT is the first choice imaging examination.1-3) CT is
superior to MRI in imaging of minute bony structures and anatomical changes and as an examination before functional
endoscopic sinus surgery.4)
There is a report suggesting the usefulness of MRI compared with CT in unilateral sinusitis, which is considered to
be of clinical importance, for the diagnosis of its complication by tumor and discrimination between tumor matrix and
the area of secondary obstructive inflammation.5) Therefore, MRI may be indicated if tumor cannot be excluded by
the clinical course or findings including images obtained to that point. It has also been reported that the accuracy of
the diagnoses of chronic sinusitis and mucocele (pyocele) by preoperative CT was 75 and 85%, respectively, but that
all lesions that were difficult to diagnose by CT were nevertheless diagnosed by MRI.5) Concerning the diagnosis of
intracranial complications of sinusitis, the accuracy was reportedly 92% by CT and 100% by MRI, also indicating the
superiority of MRI.6) MRI is also considered to be indicated when symptoms suggest intracranial complications.
In acute sinusitis, an approach based on the clinical history and physical findings is necessary. While there is no report
presenting evidence concerning the usefulness of diagnostic imaging, coronal CT has been recommended in patients
with persisting symptoms and for preoperative examination.3) However, the usefulness of MRI is unclear.7)
In fungal sinusitis, hyperdensity in CT and marked hypointensity in T2-weighted imaging of MRI are important for the
diagnosis, but the latter is considered more specific, and MRI has been reported to be useful for the imaging diagnosis
of fungal sinusitis (Figure).8,9)
Index words and secondary materials used as references
A search of PubMed was performed using “paranasal sinusitis”, “non-neoplastic disease”, “complication”, and “MRI”
as key words.
References
1) Fatterpekar GM et al: Imaging the paranasal sinuses: where we are and where we are going. Anat Rec (Hoboken) 291: 1564-1572, 2008
(Level 5)
2) Mafee MF et al: Imaging of rhinosinusitis and its complications: plain film, CT, and MRI. Clin Rev Allergy Immunol 30: 165-186, 2006 (Level 5)
3) Toyoda K: Imaging of the paranasal sinus. Nihon Igaku Hoshasen Gakkai Zasshi 65: 197-206, 2005 (Level 5)
4) Hähnel S et al: Relative value of MR imaging as compared with CT in the diagnosis of inflammatory paranasal sinus disease. Radiology 210:
171-176, 1999 (Level 3)
5) Ikeda K et al: Unilateral sinonasal disease without bone destruction. Differential diagnosis using diagnostic imaging and endonasal endoscopic
16
The Japanese imaging guideline 2013
CQ 023
A
B
Figure: Non-invasive fungal sinusitis
A Plain CT B T2-weighted image: Non-contrast CT (A) shows a hypo- to isodense area in
the right maxillary sinus. Although calcification is unclear, a hypointense area is noted in the
sinus in the T2-weighted image, and fungal sinusitis is suggested. MRI is also useful in such
cases.
biopsy. Arch Otolaryngol Head Neck Surg 123: 198-200, 1997 (Level 3)
6) Younis RT et al: The role of computed tomography and magnetic resonance imaging in patients with sinusitis with complications.
Laryngoscope 112: 224-229, 2002 (Level 3)
7) Reider JM et al: Clinical inquiries. Do imaging studies aid diagnosis of acute sinusitis? J Fam Pract 52: 565-567, 2003 (Level 5)
8) Zinreich SJ et al: Fungal sinusitis: diagnosis with CT and MR imaging. Radiology 169: 439-444, 1988 (Level 2)
9) Som PM et al: Sinonasal esthesioneuroblastoma with intracranial extension: marginal tumor cysts as a diagnostic MR finding. AJNR 15: 12591262, 1994 (Level 3)
17
The Japanese imaging guideline 2013
2. Head and neck
24
Is CT appropriate for the follow-up of benign
paranasal sinus disease? (If CT is performed, what
are the appropriate followup length/intervals?)
Recommendation
grade
C1
CT may be considered for the follow-up of sinusitis and polyps. No clear conclusion
has been reached at the present as to the length and intervals of follow-up imaging
examinations.
Note) MRI rather than CT is recommended for the follow-up of papilloma.
Background/objective
Many paranasal sinus diseases are benign, and, if surgery is necessary, a satisfactory outcome can be obtained by
endoscopic surgery. However, these diseases often recur. Sinusitis and polyps are the most frequent benign diseases
that require follow-up. Papilloma (including inverted papilloma) is a benign tumor that is likely to recur. Following the
established guidelines, the usefulness of imaging examinations for these diseases was evaluated, and which of CT and
MRI is more useful and when it should be performed were evaluated by a review of the literature.1-4)
Comments
1) Sinusitis/polyps
In patients who underwent CT of the paranasal sinuses, no correlation was observed between the patient complaint
score and CT score or between pathological findings of chronic sinusitis and the severity of CT findings.5-7) However, in
chronic sinusitis patients, the Lund Mackay system for CT has high sensitivity, and CT, along with the history of present
illness and physical findings, contributes to the accurate diagnosis of chronic sinusitis.8,9)
In the follow-up after endoscopic surgery, no difference compared with preoperative findings is observed on CT, but
this does not deny its usefulness. CT is also performed postoperatively. CT is particularly significant in evaluating
whether or not the ostiomeatal unit is obstructed in patients with persistent symptoms and for comparison with the
preoperative condition. The CT score as an objective index showed no marked improvement after compared with before
surgery, but improvements were observed in the total score of all sinuses, each maxillary sinus, and ethmoid sinus.10)
If repeat endoscopic surgery (modification surgery) is performed, the Lund Mackay system for CT is also applied as a
supplementary diagnostic tool.7) There was a report that, for follow-up, both endoscopy and CT were performed 1 month
after endoscopic surgery, but no clear reason for this interval was mentioned.10)
Follow-up is generally performed according to changes in symptoms, and endoscopy or CT is often considered
depending on the findings.10-12)
2) Papilloma
For the follow-up of sinonasal papilloma, examination of symptomatic changes and endoscopy are essential, and CT is
added as a supplementary diagnostic procedure.13-17) CT is performed first both before and after surgery, and MRI is also
performed before and after surgery in patients with expansive lesions.18)
Concerning recurrent papilloma, since there are reports that the recurrent mass could be identified, and the area of
involvement could be determined, more accurately by MRI than by CT, MRI is recommended more strongly.18,19)
Index words and secondary materials used as references
A search of PubMed was performed using “paranasal sinus”, “inflammation”, “benign tumor”, “follow up”, and “MRI”
as key words. The Japan Radiological Society and Japanese College of Radiology eds: Guidelines for Diagnostic
Imaging 2007 was also used as a reference.
References
1) Rosenfeld RM et al: Clinical practice guideline: adult sinusitis. Otolaryngol Head Neck Surg 137: 1-31, 2007 (Level 5)
2) Bhattacharyya N: Radiographic stage fails to predict symptom outcomes after endoscopic sinus surgery for chronic rhinosinusitis.
Laryngoscope 116: 18-22, 2006 (Level 2)
3) Moon IJ et al: Mucosal cysts in the paranasal sinuses: long-term follow-up and clinical implications. Am J Rhinol Allergy 25: 98-102, 2011
(Level 3)
4) Mackle T et al: Endoscopic treatment of sinonasal papilloma: a 12 year review. Acta Otolaryngol 128: 670-674, 2008 (Level 4)
5) Cousin JN et al: Is there a correlation between radiographic and histologic findings in chronic sinusitis? J Otolaryngol 29: 170-173, 2000 (Level
3)
6) Bhattacharyya T et al: Relationship between patient-based descriptions of sinusitis and paranasal sinus computed tomographic findings. Arch
Otolaryngol Head Neck Surg 123: 1189-1192, 1997 (Level 3)
7) Bhattacharyya N: Test-retest reliability of computed tomography in the assessment of chronic rhinosinusitis. Laryngoscope 109: 1055-1058,
18
The Japanese imaging guideline 2013
CQ 024
1999 (Level 3)
8) Bhattacharyya N, Fried MP: The accuracy of computed tomography in the diagnosis of chronic rhinosinusitis. Laryngoscope 113: 125-129,
2003 (Level 3)
9) Arango P, Kountakis SE: Significance of computed tomography pathology in chronic rhinosinusitis. Laryngoscope 111: 1779-1782, 2001
(Level 3)
10) Franzen G, Klausen OG: Post-operative evaluation of functional endoscopic sinus surgery with computed tomography. Clin Otolaryngol Allied
Sci 19: 332-339, 1994 (Level 3)
11) Saidi IS et al: Pre- and postoperative imaging analysis for frontal sinus disease following conservative partial middle turbinate resection. Ear
Nose Throat J 77: 326-334, 1998 (Level 4)
12) Danielsen A, Olofsson J: Endoscopic endonasal sinus surgery: a long term sinus surgery. Acta Otolaryngol 116: 611-619, 1996 (Level 4)
13) Lee TJ et al: Endoscopic surgery for recurrent inverted papilloma. Laryngoscope 114: 106-112, 2004 (Level 3)
14) Tomenzoli D et al: Different endoscopic surgical strategies in the management of inverted papilloma of the sinonasal tract: experience with 47
patients. Laryngoscope 114: 193-200, 2004 (Level 4)
15) Kraft M et al: Long-term results of endonasal sinus surgery in sinonasal papilloma. Laryngoscope 113: 1541-1547, 2003 (Level 4)
16) Petit P et al: Radiological follow-up of inverted papilloma. Eur Radiol 10: 1184-1189, 2000 (Level 5)
17) Klossek JM et al: Diffuse nasal polyposis: postoperative long-term results after endoscopic sinus surgery and frontal irrigation. Otolaryngol
Head Neck Surg 117: 355-361, 1997 (Level 4)
18) Dammann F et al: Inverted papilloma of the nasal cavity and the paranasal sinuses: using CT for primary diagnosis and follow-up. AJR 172:
543-548, 1999 (Level 2)
19) Hahnel S et al: Relative value of MR imaging as compared with CT in the diagnosis of inflammatory paranasal sinus disease. Radiology 210:
171-176, 1999 (Level 3)
19
The Japanese imaging guideline 2013
2. Head and neck
25
Is plain radiography useful for the diagnosis of adult
paranasal sinus disease?
Recommendation
grade
C1
Plain radiography may be performed, but there is little evidence that it is of diagnostic
value.
Background/objective
The present guidelines were prepared using the same clinical questions as those used in the evidence-based Guidelines
for Diagnostic Imaging edited by the Japan Radiological Society and Japanese College of Radiology Joint Guidelines
Committee (JRS/JCR Joint Guidelines Committee) published in 2007. Compared with those days, plain radiography of
the paranasal sinuses appears to have nearly ceased to be performed as the first examination of patients with paranasal
sinus-related complaints at the outpatient clinic (primarily the ENT clinic) at least in the university hospital level.
However, in local facilities, plain radiography (a combination of Waters view, Coldwell view or its modification, and
lateral view or Waters view alone) is still frequently performed as the first imaging study. Depending on the findings by
plain radiography, CT, or MRI, or both are performed. However, the diagnostic power of plain radiography is limited,
and CT as well as plain radiography is performed in many of (1) patients with relatively severe symptoms, (2) those who
resist conservative treatments, and (3) those with recurrence after remission. MRI may also be performed depending
on the findings by CT. Such an examination procedure is inefficient in both time and cost and increases the radiation
exposure. Therefore, the usefulness of plain radiography in paranasal sinus disease was reevaluated by an additional
review of the literature.1-3)
Comments
Uncomplicated acute paranasal sinusitis is usually diagnosed on the basis of symptoms, the course, and clinical
findings including those by anterior rhinoscopy, and conservative treatments such as the administration of antibiotics and
decongestion are performed. Usually, diagnostic imaging is unnecessary. If the symptoms are severe, plain radiography
may be indicated. However, the possibility of overlooking lesions in the ethmoid sinus should be considered.4-10)
Outpatient examinations including plain radiography are screening tests and are required to have high sensitivity. For
this reason, plain radiography, which is not sensitive, should not be performed on a routine basis if acute paranasal
sinusitis is suspected.9,11)
In chronic sinusitis, the role of imaging modalities differs according to the severity of symptoms and the presence or
absence of complications. There is a report that clinical findings, anterior rhinoscopy, endoscopy, and plain radiography
suffice for the diagnosis alone. However, CT (direct coronal images or reconstructed coronal images obtained by
multiplanar reconstruction (MPR)) should be considered first by omitting plain radiography if the condition exhibits
severe symptoms, is complicated by diabetes, etc., or resists conservative treatments and may be an indication of
functional endoscopic sinus surgery.12)
However, in such situations, it may be impossible to immediately perform CT, or the facility may not be equipped with
CT. Some papers have also suggested problems with the costs (NHI points) of CT and plain radiography. There was no
clear evidence concerning the usefulness of, and radiation exposure involved in, coronal reconstruction by multislice
CT. At some facilities, nasal/paranasal sinus endoscopy has been replaced by plain radiography for screening of patients
for chronic or recurrent sinusitis.
There was no evidence that plain radiography is useful for the diagnosis of tumoral lesions.
If CT is performed by omitting plain radiography, radiation exposure due to CT should be considered. There is a report
that the total exposure dose varies with the protocol and equipment and depends on the tube voltage and mAs (the mean
exposure dose of the lens in direct coronal imaging is 70.3 mGy at 475 mAs, 17.6 mGy at 210 mAs, and 4.7 mGy at 30
mAs). The exposure dose of the lens in direct coronal imaging was reported by Stammberger et al. to be 12-90 mGy but
by Rowe-Jones et al. to be a mean of 9.81 mGy (SD: ±5.62). It is necessary to examine in each CT system whether or
not a diagnostic power (resolution) sufficient for endoscopic surgery can be maintained even when the tube voltage and
mAs are reduced.
Index words and secondary materials used as references
A search of PubMed was performed using “plain radiography” and “paranasal sinus” as key words. The Japan
Radiological Society and Japanese College of Radiology eds: Guidelines for Diagnostic Imaging 2007 was also used as
a reference.
20
The Japanese imaging guideline 2013
CQ 025
References
1) Fatterpekar GM et al: Imaging the paranasal sinuses: where we are and where we are going. Anat Rec (Hoboken) 291: 1564-1572, 2008
(Level 5)
2) Mafee MF et al: Imaging of rhinosinusitis and its complications: plain film, CT, and MRI. Clin Rev Allergy Immunol 30: 165-186, 2006 (Level 5)
3) Cagici CA et al: Three-slice computerized tomography for the diagnosis and follow-up of rhinosinusitis. Eur Arch Otorhinolaryngol 262: 744750, 2005 (Level 3)
4) Aalokken TM et al: Conventional sinus radiography compared with CT in the diagnosis of acute sinusitis. Dentomaxillofac Radiol 32: 60-62,
2003 (Level 2)
5) Okuyemi KS, Tsue TT: Radiologic imaging in the management of sinusitis. Am Fam Physician 66: 1882-1886, 2002 (Level 5)
6) Lund VJ et al: Imaging for endoscopic sinus surgery in adults. J Laryngol Otol 114: 395-397, 2000 (Level 5)
7) Roberts DN et al: The diagnosis of inflammatory sinonasal disease. J Laryngol Otol 109: 27-30, 1995 (Level 3)
8) Iinuma T et al: Radio-opacity of the paranasal sinuses. Conventional views and CT. Rhinology 32: 134-136, 1994 (Level 3)
9) Burke TF et al: Comparison of sinus x-rays with computed tomography scans in acute sinusitis. Acad Emerg Med 1: 235-239, 1994 (Level 3)
10) Laranne JE et al: Diagnostic value of plain radiographs in chronic maxillary sinusitis: a comparison between radiological and endoscopic findings in 75 patients. Rhinology 30: 205-215, 1992 (Level 3)
11) Yousem DM: Imaging of sinonasal inflammatory disease. Radiology 188: 303-314, 1993, Review (Level 5)
12) Kaluskar SK et al: The role of CT in functional endoscopic sinus surgery. Rhinology 31: 49-52, 1993 (Level 3)
21
The Japanese imaging guideline 2013
2. Head and neck
26
Is CT appropriate for the preoperative diagnosis of
parotid gland tumor?
Recommendation
grade
C1
CT is not recommended for the evaluation of parotid gland tumors because its
contrasting ability is poor and because it is prone to artifacts due to dental prostheses
and dentures. However, it may be considered if MRI cannot be performed.
Background/objective
Ultrasonography, CT, and MRI are typical imaging modalities used to examine the parotid gland. Recently, as the
number of detector rows has been increased, scanning at a thinner slice thickness and in a shorter period and observation
of multiple planes by image reconstruction has been facilitated. However, there are problems with CT of the parotid
glands such as that artifacts due to dental prostheses are likely to occur, that delineation of tumor is difficult due to poor
contrast, that the discrimination of benign and malignant tumors is difficult, and that the procedure involves exposure.
In consideration of these factors, the usefulness of CT for the preoperative evaluation of parotid gland tumors was
evaluated.
Comments
Inspection, palpation, cytological examination, and biopsy can be performed relatively easily in the parotid gland
region. If a tumoral lesion is suspected by inspection and palpation, ultrasonography, which can be performed readily
without radiation exposure, is considered appropriate as the first choice imaging modality. For the subsequent detailed
evaluation using CT or MRI, the modality that is superior in the delineation ability of tumor properties and differential
imaging of the tumor and surrounding tissues and more appropriate for local evaluation should be selected.
Since the 1980s, there have been reports that MRI is superior to CT in imaging of parotid gland tumors, and the
high tissue resolution of MRI has been mentioned as its reason.1-3) Due to high tissue resolution, MRI can visualize
parotid gland tumor, parotid gland parenchyma around the tumor, and surrounding structures.4) MRI has been reported
to have delineated the margins of tumors that appeared poorly marginated on CT (Figure),5) and Barsotti reported
a case of pleomorphic adenoma the morphology of which was unclear on preoperative contrast-enhanced CT. 6) The
poor delineation of the tumor was ascribed to the closeness of the X-ray absorption coefficient between the tumor and
surrounding parotid gland tissue. Pleomorphic adenoma is difficult to detect because of weak contrast enhancement in
the early phase of contrast-enhanced CT and the closeness of the absorption coefficient compared with the surrounding
parotid gland parenchyma.7) This tendency is stronger in younger individuals, in whom fat replacement of the parotid
gland parenchyma is not advanced. Thus, MRI has been considered useful for the evaluation of parotid gland tumors
since 1990 to the present, and Chiriste et al. recently reported that the usefulness of CT for the evaluation of salivary
gland tumors is limited.8)
Pleomorphic adenoma, which accounts for a high percentage of parotid gland tumors, frequently appears as a lobulated
mass with a circumferential capsule on MRI, and the capsules of malignant lesions, if they have capsules, are reportedly
non-circumferential.9,10) Also, by MRI, Warthin’s tumor is considered to be discriminated from other tumors using the
time-signal intensity curve of contrast-enhanced dynamic study, and pleomorphic adenoma and malignant lymphoma to
be differentiated from other tumors using the ADC value. Thus, MRI allows estimation of the nature of tumor tissue to
some extent and is also considered superior to CT in this respect.
Ginsberg et al. reported that MRI excels CT in the detection of perineural spread of tumors.11) Particularly, if malignant
tumor is suspected, MRI should be performed preferentially. If artifacts due to the denture or dental prosthetics appear
in CT, they reach the parotid gland, unavoidably deteriorating the image. In MRI, however, the area affected by artifacts
is narrower than in CT, being limited to the alveolar processes and intraoral structures, and the evaluation of the parotid
gland is less likely to be hindered.1)
However, MRI is poorer in delineation of bone lesions and calcification than CT. MRI can detect bone destruction if
it is evident but is not appropriate for the imaging of localized bone destruction or microcalcifications in the interior of
tumor observed in pleomorphic adenoma. These should be evaluated by CT.2,5,7,12)
Thus, MRI is considered to be more useful than CT for close examination of parotid tumors themselves with exception
of the evaluation of calcification and bone invasion.
Index words and secondary materials used as references
The Japana Centra Revuo Medicina was searched using “parotid gland tumor”, “preoperative”, and “CT” as key words,
and PubMed was searched using “superior”, “MRI”, “CT”, and “parotid” as key words. The Japan Radiological Society
and Japanese College of Radiology eds: Guidelines for Diagnostic Imaging 2003 was also used as a reference.
22
The Japanese imaging guideline 2013
CQ 026
A
B
Figure: Pleomorphic adenoma of the deep lobe of the parotid gland
The tumor is clearly delineated in the T1-weighted image (A), but its properties are
unclear due to artifacts of dental prostheses on contrast-enhanced CT (B).
References
1) Mandelblatt SM et al: Parotid masses: MR imaging. Radiology 163: 411-414, 1987 (Level 3)
2) Cassleman JW et al: Major salivary gland masses: comparison of MR imaging and CT. Radiology 165: 183-189, 1987 (Level 2)
3) Mirich DR et al: Benign pleomorphic adenomas of the salivary glands: surface coil MR imaging versus CT. J Comput Assist Tomogr 11: 620623, 1987 (Level 5)
4) Som PM et al: Benign and malignant parotid pleomorphic adenomas. CT and MR studies. J Comput Assist Tomogr 12: 65-69, 1988 (Level 5)
5) Som PM et al: Anatomy and pathology of the salivary glands. Head and Neck Imaging, Vol. 2, 5th ed. p2449-2609, Mosby, 2011 (Level 5)
6) Barsotti JB et al: Superiority of magnetic resonance over computed tomography for imaging parotid gland. Ann Otol Rhino Laryngol 103: 737740, 1994 (Level 5)
7) Kei PLet al: CT “invisible” lesion of the major salivary glands a diagnostic pitfall of contrast-enhanced CT. Clin Radiol 64: 744-746, 2009 (Level
3 or 4)
8) Christe A et al: MR imaging of parotid tumors: typical lesion characteristics in MR imaging improve discrimination between benign and malignant disease. AJNR 32: 1202-1207, 2011 (Level 2)
9) Tanaka H et al: Diagnostic imaging of the parotid gland tumors : Characteristics MR findings. Head and Neck Cancer 34: 365-371, 2008 (Level
3)
10) Tanaka H: The Usefulness of MR Imaging for Differential Diagnosis of the Salivary Gland Tumors. Jpn J Med Imaging 25: 179-193, 2006
(Level 3)
11) Ginsberg LE: MR imaging of perineural tumor spread. Neuroimaging Clin N Am 14: 663-677, 2004 (Level 5)
12) Branstter IV BF: Parotid space. Diagnostic imaging. Head and Neck, 2nd ed. I-5-2 - I5-5, Amirsys, 2011 (Level 5)
23
The Japanese imaging guideline 2013
2. Head and neck
27
What imaging modalities are appropriate for the postoperative follow-up of
squamous cell carcinoma of the head and neck region? (Which of CT, MRI, and
PET are useful for the follow-up and at what interval should they be performed?)
Recommendation
grade
B
C1
B
PET is recommended. It should be performed 6-8 weeks or more after surgery,
because the sensitivity and positive predictive value are low early after surgery (within
4 weeks) due to postoperative changes.
Baseline images are necessary for long-term follow-up, and CT or MRI is
recommended for this purpose. CT images obtained about 6-8 weeks post treatment
are desirable as baseline images. Also, MR images about 12-16 weeks post
treatment are recommended as baseline images.
C1
While the evidence about the timing of follow-up imaging is insufficient, a
recommended interval for both CT and MRI is every 3-4 months during the first 2
years, when recurrence is likely, and every 4-6 months during the next 3-5 years.
While evidence about long-term follow-up using PET is insufficient, it is recommended
from clinical and economic viewpoints to perform it about 12, 21, and 33 months after
surgery.
Background/objective
Squamous cell carcinoma of the head and neck region may be curatively treated by chemoradiotherapy, but radical
surgery is performed in patients with advanced cancer or those who respond poorly to chemoradiotherapy. The early
detection of postoperative recurrence is an important prognostic factor, but the follow-up method varies among facilities,
and many imaging modalities are selected. Imaging modalities efficient and suitable for the follow-up are evaluated.
Comments
Postoperative imaging findings differ considerably from preoperative ones due to the effects of organ reconstruction,
changes in the hemodynamics, and postoperative inflammation.1-4) Therefore, baseline images are necessary for the
long-term follow-up.1) CT images about 6-8 weeks post treatment are considered desirable as baseline images, but
MR images are useful as baseline images for the follow-up of cancer near the skull base.1,5) However, as the effects of
postoperative changes on MRI persist over a long period, it is desirable to obtain baseline images about 12-16 weeks
post treatment (Figure).1,5)
For the postoperative follow-up, it is recommended to perform both CT and MRI every 3-4 month during the first 2
years, when the recurrence is likely, and every 4-6 months during the next 3-5 years.1)
PET is the best modality to diagnose the recurrence after treatment. However, its sensitivity and positive predictive
value have been invariably reported to be low early after treatment (within 4 weeks). Despite some differences among
reports, it is recommended to perform PET 6-8 weeks or more after the treatment. The recommended timing of PET for
long-term follow-up is 12, 21, and 33 months after treatment.1)
Index words and secondary materials used as references
A search of PubMed was performed using “head and neck squamous cell carcinoma”, “post-surgical operation”, “follow
up”, “diagnostic imaging”, “CT”, “MRI”, and “PET” as key words.
References
1) Manikantan K et al: Making sense of post -treatment surveillance in head and neck cancer: when and what of follow-up. Cancer Treat Rev 35:
744-753, 2009 (Level 1)
2) Abqral R et al: Dose 18F-FDG PET/CT improve the detection of posttreatment recurrence of head and neck squamous cell carcinoma in
patients negative for disease on clinical follow-up? J Nucl Med 50: 24-29, 2009 (Level 4)
3) Hermans R.: Posttreatment imaging in head and neck cancer. Eur J Radiol 66: 501-511, 2008 (Level 5)
4) Mukherji SK, Wolf GT: Evaluation of head and neck squamous cell carcinoma after treatment. AJNR 24: 1743-1746, 2003 (Level 5)
5) Lell M et al: Head and neck tumor: imaging recurrent tumor and post-therapeutic change with CT and MRI. Eur J Radiol 33: 239-247, 2000
(Level 3)
24
The Japanese imaging guideline 2013
CQ 027
A
B
C
Figure: Images after surgery for hypopharyngeal cancer
Neck status post resection of the hypopharynx, larynx, and cervical esophagus and reconstruction by free flap transfer
for hypopharyngeal cancer. The figure shows contrast-enhanced CT images about 5 weeks after surgery (A, B:
transverse images, C: coronal reconstructed image). They serve as baseline images for the subsequent follow-up.
25
The Japanese imaging guideline 2013
2. Head and neck
28
Is PET appropriate for staging of head and neck
cancers?
Recommendation
grade
B
PET is not necessarily advantageous compared with CT or MRI regarding the T staging.
However, it is recommended as it can precisely characterize lesions concerning the N
and M staging and has excellent sensitivity, in particular. Furthermore, a combination
of PET and CT, which shows even higher diagnostic precision than PET alone, is
recommended.
Background/objective
For the pretreatment staging of head and neck cancers, PET has been introduced clinically at increasing facilities since
the late 1990s to 2000, and it is nearly established today as a modality indispensable for high-precision staging. In this
section, the usefulness of PET (referring here to 18F-FDG PET or PET/CT, which are widely performed) is compared
with that of other modalities including CT and MRI.
Comments
According to a meta-analysis of studies that evaluated the diagnostic ability of 18F-FDG PET in patients with head
and neck squamous cell carcinoma in a period of 1994-2007, the sensitivity was 79%, specificity was 86%, positive
likelihood ratio was 5.84, and negative likelihood ratio was 0.24. On comparison between PET and CT, the sensitivity
was 80 vs. 75%, and specificity was 86 vs. 79%1) on comparison between PET and CT/MRI, the lesion detection rate
was 0.973 vs. 0.928 (P=0.026), and the lymph node detection rate was 0.974 vs. 0.717 (P=0.02).2)
PET has generally higher diagnostic ability than conventional diagnostic methods. Particularly, for staging of lymph
nodes (N staging), the diagnostic precision of PET is higher than CT or MRI,3,4) and its diagnostic ability for lesions
considered borderline lesions on CT or MRI is excellent. 3) In addition, PET-CT fusion imaging and PET/CT are
significantly more sensitive and specific than PET alone and contributes to reducing the false positive rate.5)
On the other hand, for staging of primary lesions (T staging), PET tends to show high sensitivity but low specificity,3)
and the detection rate in patients in whom lymph node metastasis cannot be identified clinically (clinical N0) is
reportedly about 50%.1) There have been few studies comparing PET with other modalities by the site of head and neck
cancer, and no evidence that PET has absolute advantage over CT or MRI at particular sites has been obtained, but it
plays an important role in pretreatment staging concerning the determination of the N and M staging, which contribute
to the sensitivity and precision.
Concerning the evaluations using the SUV value obtained by PET, there have been reports that the disease-free
survival period differed significantly between SUVmax of ≥6.5 and <6.5,6) that the SUV value was significantly higher in
patients with extracapsular lymph node invasion (P<0.0007) and those with distant metastasis (P<0.05) and an SUVmax
of 1.0 or higher in the primary lesion was an exacerbating factor of the total survival rate,7) and that the diagnostic
precision was significantly improved (sensitivity: 79%, specificity: 99%) by the addition of a cutoff value of SUVmax
based on the lymph node size on PET (Figure).8)
Thus, while PET may not be advantageous for staging of head and neck cancers depending on the site and size of the
lesion, it is recommended as it provides more high-precision information compared with conventional examinations.
Index words and secondary materials used as references
A search of PubMed was performed using “head and neck cancer”, “PET”, “MRI”, and “CT” as key words and further
limited to studies since 2000.
References
1) Kyzas PA et al: 18F-fluorodeoxyglucose positron emission tomography to evaluate cervical node metastases in patients with head and neck
squamous cell carcinoma: a meta-analysis. J Natl Cancer Inst 100: 712-720, 2008 (Level 1)
2) Yen C et al: Staging of untreated squamous cell carcinoma of buccal mucosa with 18F-FDG PET: comparison with head and neck CT/MRI and
histopathology. J Nucl Med 46: 775-781, 2005 (Level 3)
3) Dammann F et al: Rational diagnosis of squamous cell carcinoma of the head and neck region: comparative evaluation of CT, MRI, and 18FDG
PET. AJR 184: 1326-1331, 2005 (Level 3)
4) Hannah A et al: Evaluation of 18F-fluorodeoxyglucose positron emission tomography and computed tomography with histopathologic
Correlation in the Initial Staging of Head and Neck Cancer. Ann Surg 236: 208-217, 2002 (Level 3)
26
The Japanese imaging guideline 2013
CQ 028
A
B
Figure: Hypopharyngeal cancer (cancer of the right piriform sinus) T4a N2c
CT (A) shows metastatic lymph nodes only on the right side, which is the affected side, and
the diagnosis was N2b. On PET (B), however, bilateral lymph node metastasis was suspected.
Surgery revealed bilateral metastases, and the stage was N2c.
5) Ishikita K et al: Additional value of integrated PET-CT over PET alone in the initial staging and follow up of head and neck malignancy. Ann Nucl
Med 24: 77-82, 2010 (Level 4)
6) Scott AM et al: PET changes management and improves prognostic stratification in patients with head and neck cancer: results of a multicenter
prospective study. J Nucl Med 49: 1593-1600, 2008 (Level 3)
7) Kubicek GJ et al: FDG-PET staging and importance of lymph node SUV in head and neck cancer. Head & Neck Oncology 2: 1-19, 2010 (Level 3)
8) Murakami R et al: Impact of FDG-PET/CT imaging on nodal staging for head-and-neck squamous cell carcinoma. Int J Radiation Oncology Biol
Phys 68: 377-382, 2007 (Level 3)
27
The Japanese imaging guideline 2013
2. Head and neck
29
Is MRI appropriate for the evaluation of cervical
lymph node metastasis?
Recommendation
grade
C1
MRI is recommended when the differential diagnosis of benign and malignant cervical
lymph node lesions is difficult by CT or ultrasonography.
Background/objective
Imaging examination of cervical lymph node metastasis is often performed by CT or ultrasonography. Contrastenhanced CT is used at many facilities to detect lymph node metastasis using diagnostic criteria based on the size
and internal morphologies of lymph nodes. Ultrasonography is used frequently as a screening test because of the
convenience and lack of radiation exposure. The wide use of these examinations may be ascribed to the short scanning
time and the availability of the equipment at many facilities. As for their problems, CT involves X-ray exposure, and
ultrasonography is dependent on the skill of the examiner and can scan only a narrow area at a time.
MRI is selected less frequently than CT or ultrasonography as the first choice imaging examination for cervical lymph
node metastasis. However, due to the recent improvements in MRI, increased clinical availability of machines with
1.5T or a high magnetic field strength, improvements in various imaging sequences including fat-suppressed imaging,
thinning of the available slice thickness, and realization of multiplanar image reconstruction, MRI has become a more
usable diagnostic tool than before. In consideration of these points, whether MRI, which has excellent tissue resolution,
is useful for the diagnosis of cervical lymph node metastasis is evaluated.
Comments
According to a report by Curtin et al., contrast-enhanced CT was superior to MRI in the evaluation of cervical lymph
node metastasis of head and neck squamous cell carcinoma using diagnostic criteria based on both the lymph node
size and a combination of the size and internal morphologies.1) Later, King et al. reported that MRI was comparable
to contrast-enhanced CT in detecting necrotic changes in lymph node metastasis of head and neck squamous cell
carcinoma.2) More recently, Sumi et al. reported that, in evaluating the presence or absence of cervical lymph node
metastasis of head and neck squamous cell carcinoma according to internal morphologies observed in metastatic nodes
such as cancer nests, necrosis, and keratinization, MRI showed a significantly higher detection power than contrastenhanced CT for lymph node metastasis 10 mm or less in short diameter.3) As a reason for these results, they suggested
that focal defects caused by lymph node metastasis have become more detectable due to the improvements in the
performance of recent MRI systems, which provide high-resolution images in a short period.
The hilum of lymph node, which contains fat, often presents as fat density on CT. However, as it contains not only
fat but also blood vessels, it is occasionally visualized at water density, making its discrimination from local defects
reflecting necrosis or tumor invasion difficult. This tendency is particularly notable in small lymph nodes 10 mm or less
in short diameter. On MRI, however, the hilum of lymph node is hyperintense in pre- and postcontrast T1-weighted
imaging regardless of the lymph node size, and this hyperintensity disappears if there are local defects. Therefore, MRI
is considered to be superior for the judgment of the presence or absence of focal defects.
For the presence diagnosis of, and screening for, lymph node metastasis by MRI, fast spin echo T2-weighted imaging
using fat suppression is appropriate, because many cervical lymph nodes are surrounded by adipose tissue, and
lymph nodes can be delineated clearly by fat suppression. Fat-suppressed T2-wighted imaging is also excellent for
the evaluation of interior properties of lymph nodes. Cancer nests in metastatic lymph nodes consist of cancer cells,
necrosis, and keratinization, and liquefactive necrosis is visualized as a hyperintense area in fat-suppressed T2-weighted
images. Coagulative necrosis and keratinization may present hypo- to medium intensity signals on fat-suppressed T2weighted imaging.3,4) Thus, fat-suppressed T2-weighted images show signals reflecting histological features in the
interior of metastatic lymph nodes.
Coronal fast short TI inversion recovery (STIR) imaging is also appropriate for screening of cervical lymph node
metastasis5) because of the relatively short imaging time (about 2 minutes) compared with fast spin echo fat-suppressed
T2-weighted imaging and resistance to susceptibility artifacts. In STIR images, signals emitted by lesions are not
specific to their malignancy or benignancy.6) Therefore, STIR imaging is not suited for the evaluation of internal
morphologies associated with the diagnosis of lymph node metastasis but is excellent in the size evaluation. It has also
been reported that the hyperintense area extending around lymph nodes (“flare” sign) in STIR and fat-suppressed T2weighted images and shaggy margin in contrast-enhanced T1-weighted images are useful for the diagnosis of extranodal
or extracapsular spread of lymph node metastasis.7,8)
A diagnostic method for lymph node metastasis being evaluated at present uses the ADC map obtained from diffusion28
The Japanese imaging guideline 2013
CQ 029
Maximum diameter in transverse CT image*
・15 mm(Levels IIA and IB)
・10 mm(other than the above)
Equal
Less
Central necrosis, local defect on CT
Absent
Present
More
MRI
Abnormal signals at the hilum of lymph node on fatsuppressed T2-weighted images
Disappearance of fat at the hilum of lymph node on
T1-weighted images
Present
Absent
Reactive enlargement
Metastasis
Maximum diameter:30-31 mm**
MRI
“Flare” sign on fat-suppressed T2-weighted images
“Shaggy margin” on contrast-enhanced T1-weighted images
Extranodal spread/
extracapsular invasion:Absent
Absent
Present
Less
Equal or more
Extranodal spread/
extracapsular invasion:Present
Figure: Flow chart for the diagnosis of cervical lymph node metastasis
* Som PM: Detection of metastasis in cervical lymph nodes: CT and MR criteria and differential diagnosis. AJR 158: 961-969,
1992
** Kojima K et al: MRI findings of extracapsular spread in cervical lymph node metastasis. Head and Neck Cancer 27: 713-716,
2001
weighted imaging. However, the variation with the magnetic field strength of the MRI system is large, and further
development of the study is anticipated.9,10)
The figure provides a flow chart for the diagnosis of cervical lymph node metastasis.
Index words and secondary materials used as references
The Japana Centra Revuo Medicina was searched using “cervical lymph node metastasis” and “MRI” as key words,
and PubMed was searched using “neck”, “nodes”, “metastasis”, and “MRI” as key words.
References
1) Curtin HD et al: Comparison of CT and MRI imaging in staging of neck metastasis. Radiology 207: 123-130, 1998 (Level 3)
2) King AD et al: Necrosis in metastatic neck nodes: diagnostic accuracy of CT, MR imaging, and US. Radiology 230: 720-726, 2004 (Level 3)
3) Sumi M et al: Diagnostic performances of MRI relative to CT for metastatic nodes of head and neck squamous cell carcinomas. J Magn Reson
Imaging 26: 1626-1633, 2007 (Level 2)
4) Nakamura T et al: Nodal imaging in the neck: Recent advances in US, CT and MR imaging of metastatic nodes. Eur Radiol 17: 1235-1241,
2007 (Level 4)
5) Kawai Y et al: Turbo shortτinversion recovery imaging for metastatic node screening in patients with head and neck cancer. AJNR 27: 12831287, 2006 (Level 2)
6) Kallenberger CJ et al: Fast STIR whole-body imaging in children. Radiographics 24: 1317-1330, 2004 (Level 4)
7) Kojima K et al: MRI findings of extracapsular spread in cervical lymph node metastasis. Head and Neck Cancer 27: 713-716, 2001(Level 3)
8) Kimura Y et al: MR imaging criteria for the prediction of extranodal spread of metastatic cancer in the neck. AJNR 29: 1355-1359, 2008 (Level 4)
9) Sumi M et al: Discrimination of metastatic cervical lymph nodes with diffusion weighted MR imaging in patients with head and neck cancer.
AJNR 24: 1627-1634, 2003 (Level 3)
10) Srinivasan A et al: Differentiation of benign and malignant pathology in head and neck using 3T apparent diffusion coefficient values: early
experience. AJNR 29: 40-44, 2008 (Level 4)
29
The Japanese imaging guideline 2013
03
Thoracic region
1
The Japanese imaging guideline 2013
3. Thoracic region
30
Is CT appropriate for the discrimination between adult
community-acquired pneumonia and non-infectious
diseases?
Recommendation
grade
C1
While scientific evidence of the usefulness of CT is insufficient, there are HRCT
findings characteristic of infectious and non-infectious diseases, and their
discrimination is possible to an extent.
Background/objective
There are various lung diseases that require differentiation from community-acquired pneumonia. In immunocompetent
individuals, they include pulmonary edema, eosinophilic pneumonia, hypersensitivity pneumonia, idiopathic interstitial
pneumonia, and drug-induced lung disorders.1) In immunodeficient individuals, in addition to these disorders, many
pathological conditions such as opportunistic infection and changes due to malignant neoplasm are considered.2) The
role of HRCT for the differential diagnosis of community-acquired pneumonia from these non-infectious disorders,
particularly acute respiratory disease exhibiting diffuse opacifications, was evaluated.
Comments
Many plain chest X-ray findings in community-acquired pneumonia overlap with those in diffuse lung diseases, and
there are no disease-specific findings. However, CT, particularly high-resolution CT (HRCT), has been reported to
provide additional information (Figures 1, 2).3,4)
According to a report of patients with community-acquired pneumonia who required hospitalization and underwent
CT,3) CT was useful for the detection of cavities and masses in the lesion undetected by plain chest radiography and
exclusion of masses suspected to be present by plain chest radiography, and the modality was suggested to be useful
for the exclusion of some diseases and collection of important information though it may fall short of differentially
diagnosing community-acquired pneumonia from infectious pneumonia. There was a questionnaire survey in
pulmonologists to clarify the state of the use and usefulness of HRCT in diffuse lung diseases.4) Of the valid answers
obtained from 230 pulmonologists, 67-89% affirmed the usefulness of HRCT for the diagnosis of diseases including
idiopathic interstitial pneumonia, eosinophilic pneumonia, Langerhans cell histiocytosis, lymphangioleiomyomatosis,
and bronchiectasis.
There are reports of 4 case series studies evaluating the discrimination between infectious and non-infectious diseases
by HRCT.2,5-7) These reports suggest common differential points in images. In an evaluation of acute pulmonary
parenchymal lesions that developed in immunocompetent patients,5) centrilobular nodules were the most important
finding for the differentiation between infectious and non-infectious diseases, and they were usually not observed in
non-infectious diseases. In addition, segmental distribution and the presence of wedge-shaped consolidations primarily
in the segmental bronchi were findings characteristic of infections.5) Also, in an evaluation of patients showing multiple
consolidations on plain chest radiography,6) HRCT findings important for the differentiation of infections from noninfectious diseases were centrilobular nodules and branched structures (i.e. tree-in-bud) due to mucus plugs in the
airway. Centrilobular branched structures are not observed in non-infectious lung diseases such as hypersensitivity
pneumonitis, pulmonary emphysema, obstructive bronchiolitis, and idiopathic organizing pneumonia.7) In a report of
patients with immunodeficiency not due to acquired immunodeficiency syndrome who developed acute lung disorders
including infection,2) the sensitivity and positive predictive value of CT for various diseases were 0.27-1.0 and 0.251.0, respectively, showing variation among diseases. Centrilobular lesions and lesions of the secondary lobule level
were frequent HRCT findings in bacterial pneumonia, and CT halo sign and cavities were observed frequently in
fungal infection and tuberculosis. Malignant tumors included leukemia, malignant lymphoma, and carcinomatous
lymphangiosis, and thickening of the bronchovascular bundles, nodes, and lymph node enlargement were observed
frequently in these disorders. Also, in immunocompromised patients who developed acute lung disorders,8) inflammatory
disorders (infections, in particular) were reported to be suspected when nodes were the primary finding.
In addition to the differential diagnosis, CT has been reported to be useful for collection of alveolar lavage fluid,
transbronchial lung biopsy, and determination and confirmation of the site of surgical biopsy and, thus, may contribute
to the discrimination between pneumonia and non-infectious disorders.
Index words and secondary materials used as references
A search of PubMed was performed using “pneumonia” and “computed tomography” as key words. Also, the Japan
Radiological Society and Japanese College of Radiology eds.: Guidelines for Diagnostic Imaging 2005 was used as a
reference.
2
The Japanese imaging guideline 2013
CQ 030
Figure 1: Bacterial pneumonia
(Pseudomonas aeruginosa )
Homogeneous infiltrative shadow showing
segmental distribution is observed on
the ventral side of the right lower lobe.
Thickening of the bronchial wall in the
neighborhood ( → ) and centrilobular
granular opacities ( ▲ ) are also noted.
Figure 2 Mycoplasma pneumonia
Centrilobular branched/granular opacity ( → ) and
acinar to lobular ground-glass opacity/infiltrative
opacity ( ▲ ) are noted in the right upper lobe
and part of the lower lobe. Thickening of the
bronchovascular bundles is also notable.
References
1) Shorr AF et al: Pulmonary infiltrates in the non-HIV-infected immunocompromised patient: etiologies, diagnostic strategies, and outcomes.
Chest 125: 260-271, 2004 (Level 4)
2) Emoto T et al: HRCT findings of pulmonary complications in non-AIDS immunocompromised patients: are they useful in differential diagnosis?
Radiat Med 21: 7-15, 2003 (Level 4)
3) Beall DP et al: Utilization of computed tomography in patients hospitalized with community-acquired pneumonia. Maryland Med J 47: 182-187,
1998 (Level 4)
4) Scatarige JC et al: Utility of high-resolution CT for management of diffuse lung disease: results of a survey of U.S. pulmonary physicians. Acad
Radiol 10: 167-175, 2003 (Level 4)
5) Tomiyama N et al: Acute parenchymal lung disease in immunocompetent patients: diagnostic accuracy of high-resolution CT. AJR 174: 17451750, 2000 (Level 4)
5) Johkoh T et al: Usefulness of high-resolution CT for differential diagnosis of multi-focal pulmonary consolidation. Radiat Med 14: 139-146,
1996 (Level 4)
6) Aquino SL et al: Tree-in-bud pattern: frequency and significance on thin-section CT. J Comput Assist Tomogr 20: 594-599, 1996 (Level 4)
7) Brown MJ et al: Acute lung disease in the immunocompromised host: CT and pathologic examination findings. Radiology 190: 247-254, 1994
(Level 4)
3
The Japanese imaging guideline 2013
3. Thoracic region
31
Is CT appropriate for the discrimination between
bacterial and atypical pneumonia?
Recommendation
grade
C1
CT is useful and may be considered for the discrimination between pneumococcal
pneumonia and Mycoplasma pneumoniae pneumonia, but the evidence of its
usefulness for the diagnosis of diseases caused by other microorganisms is limited.
Background/objective
The guidelines by the Japanese Respiratory Society recommend to treat pneumonia following discrimination of
atypical pneumonia from community-acquired pneumonia. Whether or not CT is useful for the discrimination between
bacterial and atypical pneumonia in adults was evaluated.
Comments
Primarily, CT findings were compared between pneumococcal pneumonia, which is the most frequent bacterial
pneumonia (Figure 1), and common atypical pneumonia (Mycoplasma pneumoniae , Chlamydia sp, and influenza
virus pneumonia) (Figure 2). Characteristics of pneumococcal pneumonia, Mycoplasma pneumoniae pneumonia,
and influenza virus pneumonia have been relatively established. Concerning the discrimination between bacterial and
atypical pneumonia using CT, 7 reports on retrospective comparative studies were found.
Tanaka et al. compared CT findings in 18 patients with bacterial pneumonia and 14 with atypical pneumonia.1) In
atypical pneumonia, centrilobular shadow, consolidation and ground-glass attenuation with lobular distribution were
observed more frequently than in bacterial pneumonia.
According to the report by Nambu et al. (24 patients with Chlamydia pneumoniae pneumonia, 30 with Mycoplasma
pneumoniae pneumonia, and 41 with pneumococcal pneumonia), thickening of bronchovascular bundles was noted
more frequently in Mycoplasma pneumoniae pneumonia and Chlamydia pneumoniae pneumonia than in pneumococcal
pneumonia..2)
In the evaluation of CT findings in a total of 114 patients including 35 with bacterial pneumonia, 28 with Mycoplasma
pneumoniae pneumonia, and 9 with viral pneumonia by Reittner et al., centrilobular nodules were observed more
frequently in Mycoplasma pneumoniae pneumonia and viral pneumonia than in bacterial pneumonia, and no
consolidation was noted in viral pneumonia.3)
Ito et al. compared CT findings in 94 patients with bacterial pneumonia (including 65 with pneumococcal pneumonia)
and 31 patients with atypical pneumonia (including 20 with Mycoplasma pneumoniae pneumonia and 7 with Chlamydia
pneumoniae pneumonia). Centrilobular nodules, thickening of bronchovascular bundles, and lobular opacity were
observed significantly more frequently in atypical pneumonia, and these findings were useful for its discrimination
form bacterial pneumonia. However, Chlamydia pneumoniae pneumonia and bacterial pneumonia were difficult to
differentiate.
Miller et al. evaluated CT findings in 93 patients with viral pneumonia and 22 with bacterial pneumonia and frequently
noted ground-glass opacity and diffuse air space consolidation in bacterial pneumonia.5)
According to the reports by Miyashita et al. (64 patients with Mycoplasma pneumoniae pneumonia and 68 with
pneumococcal pneumonia) and Nei et al. (36 patients with Mycoplasma pneumoniae pneumonia and 52 patients
with community-acquired pneumonia including 20 with pneumococcal pneumonia), bronchial wall thickening and
centrilobular nodules were also observed significantly more frequently in Mycoplasma pneumoniae pneumonia.
There are other reports concerning CT findings in pneumococcal pneumonia and Mycoplasma pneumoniae pneumonia,
and bronchial wall thickening and centrilobular nodules are considered to be useful for their discrimination..
Major reports on CT findings in Chlamydia pneumoniae pneumonia have been few. Compared with Mycoplasma
pneumoniae pneumonia, bronchial wall thickening and centrilobular nodules are observed less frequently, and lobular
ground-glass opacity and lobular consolidation are observed more frequently. However, its discrimination from
pneumococcal pneumonia is difficult.4)
As for influenza virus pneumonia, there are major reports concerning seasonal influenza virus and novel influenza virus
pneumonia that intralobular reticular opacity is observed frequently. Fujita et al. reported CT findings in 12 patients
with virus-associated pneumonia. In patients with mixed infection with bacteria pneumonia, segmental consolidation
was noted, and the consolidation could be discriminated from pure virus pneumonia. There have also been a number of
reports of similar finding (intralobular reticular opacity) in pneumonia due to other viruses such as adenovirus. CT may
be useful for the discrimination of virus and bacterial pneumonia.3,9)
4
The Japanese imaging guideline 2013
CQ 031
Figure 1: Pneumococcal pneumonia
Consolidations are noted in the bilateral lungs.
Bronchial wall thickening is unremarkable.
Figure 2: Mycoplasma pneumoniae
pneumonia
Bronchial wall thickening ( → ) and
centrilobular granular shadows are observed in
S2 of the right lung.
Index words and secondary materials used as references
A search of PubMed was performed using “pneumonia” and “computed tomography” as key words. The Japan
Radiological Society and Japanese College of Radiology eds: Guidelines for Diagnostic Imaging of Adult CommunityAcquired Pneumonia 2007; the Japanese Respiratory Society eds: Guidelines for the Management of Adult CommunityAcquired Pneumonia 2007; and the following documents were also used as references.
Murayama S: CT diagnosis of pulmonary infectious diseases. Kekkaku. 77: 79-86, 2002
Takahashi M et al: CT Findings of Pulmonary Infections. Jpn J Radiol Soc 59: 371-379, 1999
Ashizawa K, Uetani M: Bacterial pneumonia. Jpn J Clin Med. 28: 231-234, 2007
Tanaka H et al: Computed tomographic study on mycoplasma pneumoiae pneumonia. Jpn J Clin Radiol. 30: 979-986, 1985
References
1) Tanaka N et al: High resolution CT findings in community-acquired pneumonia. J Comput Assist Tomogr 20: 600-608, 1996 (Level 3)
2) Nambu A et al: Chlamydia pneumoniae: comparison with findings of Mycoplasma pneumoniae and Streptococcus pneumoniae at thin-section
CT. Radiology 238: 330-338, 2006 (Level 3)
3) Reittner P et al: Pneumonia: high-resolution CT findings in 114 patients. Eur Radiol 13: 515-521, 2003 (Level 3)
4) Ito I et al: Differentiation of bacterial and non-bacterial community-acquired pneumonia by thin-section computed tomography. Eur J Radiol 72:
388-395, 2009 (Level 3)
5) Miller WT Jr et al: CT of viral lower respiratory tract infections in adults: comparison among viral organisms and between viral and bacterial
infections. AJR 197: 1088-1095, 2011 (Level 3)
6) Miyashita N et al: Radiographic features of Mycoplasma pneumoniae pneumonia: differential diagnosis and performance timing. BMC Med
Imaging 9: 7, 2009 (Level 3)
7) Nei T et al: Mycoplasma pneumoniae pneumonia: differential diagnosis by computerized tomography. Intern Med 46: 1083-1087, 2007 (Level
3)
8) Okada F et al: Chlamydia pneumoniae pneumonia Mycoplasma pneumoniae pneumonia: comparison of clinical findings and CT findings. J
Comput Assist Tomogr 29: 626-632, 2005 (Level 4)
9) Fujita J et al: Chest CT findings of influenza virus-associated pneumonia in 12 adult patients. Influenza Other Respi Viruses 1: 183-187, 2007
(Level 3)
10) Agarwal PP et al: Chest radiographic and CT findings in novel swine-origin influenza A (H1N1) virus (S-OIV) infection. AJR 193: 1488-1493,
2009 (Level 3)
11) Marchiori E et al: High-resolution computed tomography findings from adult patient with influenza A (H1N1) virus-associated pneumonia. Eur J
Radiol 74: 93-98, 2010 (Level 4)
5
The Japanese imaging guideline 2013
3. Thoracic region
32
Is CT appropriate for the diagnosis of
pneumoconiosis?
Recommendation
grade
B
CT is useful for the diagnosing the presence, distribution, and severity of
pneumoconiosis lesions and complications and is recommended.
Background/objective
According to the Pneumoconiosis Law, plain chest radiography plays the central role in the diagnosis of
pneumoconiosis, and the severity of the disease is defined by the PR classification based on plain chest radiograms.
Clinically, however, CT findings are used complementarily for the diagnosis
Comments
In silicosis, there are reports that CT has excellent detection power for healing tendency and large opacities.1,2) CT has
also been reported to improve the inter-reader agreement rate.3) In patients exhibiting small round opacities classified
as “type p” on plain chest radiography, the addition of HRCT not only improves the detection rate of granular opacities
themselves4) but also allows the differentiation between the actual presence of small round opacities and the presence of
only fibrosis around respiratory bronchioles,5) making more accurate PR classification possible.
Regarding lung asbestosis, as the diagnosis of lung lesions in general is difficult by plain chest radiography alone if
pleural plaques are notable, the concomitant use of CT is desirable.6) A characteristic CT finding in lung asbestosis is
subpleural curvilinear opacity, which is observed frequently (Figure).7) Such mild fibrosis is impossible to visualize
without CT including HRCT.
In both silicosis and asbestosis, the diagnosis of complications such as lung cancer, mesothelioma, and tuberculosis is
also of clinical importance.8) In diagnosing complications, the diagnostic ability of plain radiography may be reduced
by the presence of pneumoconiosis-related small round opacities, irregular opacities, and pleural plaques.9) Earlier
diagnosis of these complications becomes possible by the use of CT.
Index words and secondary materials used as references
A search of PubMed was performed using “pneumoconiosis”, “silicosis”, “asbestosis”, and “CT” as key words.
References
1) Remy-Jardin M et al: Coal worker’s pneumoconiosis: CT assessment in exposed workers and correlation with radiographic findings. Radiology
177: 363-371, 1990 (Level 3)
2) Begin R et al: CT assessment of silicosis in exposed workers. AJR 148: 509-514, 1987 (Level 4)
Figure: Lung asbestosis
A linear opacity along the pleura is observed
immediately below the upper dorsal pleura, and some
granular opacities appear to be aggregated. This is a
typical image of subpleural curvilinear shadow (SCLS)
observed in lung asbestosis.
6
The Japanese imaging guideline 2013
CQ 032
3) Antao VC et al: High-resolution CT in silicosis: correlation with radiographic findings and functional impairment. J Comput Assist Tomogr 29:
350-356, 2005 (Level 4)
4) Begin R et al: Computed tomography scan in the early detection of silicosis. Am Rev Respir Dis 144: 697-705, 1991 (Level 4)
5) Akira M et al: Radiographic type p pneumoconiosis: high-resolution CT. Radiology 171: 117-123, 1989 (Level 4)
6) Friedman AC et al: Asbestos-related pleural disease and asbestosis: a comparison of CT and chest radiography. AJR 150: 269-275, 1988
(Level 4)
7) Akira M et al: Early asbestosis: evaluation with high-resolution CT. Radiology 178: 409-416, 199 (Level 4)
8) Westerholm P et al: Silicosis and risk of lung cancer or lung tuberculosis: a cohort study. Environ Res 41: 339-350, 1986 (Level 3)
9) Tiitola M et al: Computed tomography screening for lung cancer in asbestos-exposed workers. Lung Cancer 35: 17-22, 2002 (Level 4)
7
The Japanese imaging guideline 2013
3. Thoracic region
33
Is CT appropriate for the evaluation of the severity of
COPD?
Recommendation
grade
C1
Since various quantitative evaluations are possible even by low-dose CT, and since
CT findings correlate well with the severity of COPD, CT may be considered.
Background/objective
COPD is a disease defined as a forced expiratory volume in 1 second as percent of FVC (FEV1.0%) of 70% or less,
and its severity is evaluated comprehensively on the basis of not only respiratory function but also symptoms such as
dyspnea and the presence or absence of complications. In the Global Strategy for the Diagnosis, Management, and
Prevention of Chronic Obstructive Lung Disease (GOLD), CT is given a supplementary diagnostic role. However, the
guidelines by the Japanese Respiratory Society consider the classification of the disease into emphysematous and nonemphysematous types according to CT findings to be useful.
Comments
When COPD is viewed from pathological aspects of the lung, 3 factors, i.e., destruction of the lung parenchyma due to
pulmonary emphysema, narrowing of the peripheral airways, and decrease in the pulmonary vascular bed, are involved
in a complex manner. Therefore, the separate evaluation of each factor by CT does not necessarily lead to an accurate
diagnosis of COPD. For example, in a report evaluating whether or not COPD can be diagnosed according to the LAA%
(percent of the low attenuation area/total lung area) alone in 1,140 patients, the sensitivity and specificity of the LAA%
were 63 and 88%, respectively.
However, quantitative evaluation of each factor using CT is useful. Concerning pulmonary emphysema in particular,
there are multiple reports that the low attenuation area of CT corresponds to pathologically confirmed pulmonary
emphysema,2) and CT is recommended for the evaluation of the severity of emphysema.
Pulmonary emphysema is evaluated by CT, using indices such as a macroscopic score (Goddard classification),3)
LAA%, and mean CT value of the entire lung. The macroscopic evaluation has been shown in a study of 9,000 patients
to correlate with the GOLD classification despite some inter-rater variation.4)
The LAA% is the most widely used qualitative index of pulmonary emphysema, and commercial software for its
calculation is available (Figure 1). The LAA% shows a high correlation with the forced expiratory volume in 1 second
(FEV1), by which COPD is staged, with an r of -0.63 to -0.659.5) In its actual determination, it must be noted that the
CT value varies with the imaging device and imaging conditions (slice thickness, reconstruction algorithm, etc.) and
that the threshold of the LAA% is presently not established although it is set at -950 HU in many reports.
The airway wall is evaluated by CT grossly6) or using parameters such as the percent of the airway wall area/total
airway area (WA%).7) The WA%, which can be calculated using commercial software (Figure 2), is correlated with the
FEV18) as well as findings in surgical specimens.9)
Finally, regarding vascular lesions, a method using the total cross-sectional area of small pulmonary vessels (%CSA<5)
is proposed.10)
Index words and secondary materials used as references
A search of PubMed was performed using “CT”, “lung”, and “COPD and CT”, and “emphysema” as key words. The
GOLD COPD guidelines (http://www.goldcopd.org/) and the Japanese Respiratory Society Guidelines Committee eds:
Guidelines for the Diagnosis and Treatment of COPD 4th edition, 2013 were also used as references.
References
1) Mets OM et al: Identification of chronic obstructive pulmonary disease in lung cancer screening computed tomographic scans. JAMA 306:
1775-1781, 2011 (Level 2)
2) Madani A et al: Pulmonary emphysema: objective quantification at multi-detector row CT--comparison with macroscopic and microscopic morphometry. Radiology 238: 1036-1043, 2006 (Level 2)
3) Nishimura M et al: Annual change in pulmonary function and clinical phenotype in chronic obstructive pulmonary disease. Am J Respir Crit
Care Med 185: 44-52, 2012 (Level 2)
4) Zulueta JJ et al: Emphysema scores predict death from chronic obstructive pulmonary disease and lung cancer. Chest 141: 2016-2023, 2012
(Level 2)
5) Akira M et al: Quantitative CT in chronic obstructive pulmonary disease: inspiratory and expiratory assessment. AJR 192: 267-272, 2009
8
The Japanese imaging guideline 2013
CQ 033
Figure 1: Quantitative
evaluation of pulmonary
emphysema using CT
(analysis of the LAA%)
Figure 2 Quantitative
evaluation of the airway
by CT
(Level 2)
6) Aziz ZA et al: Functional impairment in emphysema: contribution of airway abnormalities and distribution of parenchymal disease. AJR 185:
1509-1515, 2005 (Level 3)
7) Orlandi I et al: Chronic obstructive pulmonary disease: thin-section CT measurement of airway wall thickness and lung attenuation. Radiology
234: 604-610, 2005 (Level 2)
8) Hasegawa M et al: Airflow limitation and airway dimensions in chronic obstructive pulmonary disease. Am J Respir Crit Care Med 173: 13091315, 2006 (Level 2)
9) Nakano Y et al: The prediction of small airway dimensions using computed tomography. Am J Respir Crit Care Med 171: 142-146, 2005 (Level
2)
10) Matsuoka S et al: Pulmonary hypertension and computed tomography measurement of small pulmonary vessels in severe emphysema. Am J
Respir Crit Care Med 181: 218-225, 2010 (Level 2)
9
The Japanese imaging guideline 2013
3. Thoracic region
34
Is lung cancer screening by plain chest radiography
appropriate?
Recommendation
grade
C1
Although scientific evidence is insufficient, screening for lung cancer using plain chest
radiography is currently performed widely in Japan, and its implementation under
sufficient systematic supervision may be considered.
Background/objective
In Japan, the mortality rate due to lung cancer is increasing, and lung cancer has been the leading cause of death in
males since the late 1990s. With males and females combined, the number of deaths due to lung cancer exceeded 63,000
in 2006 and is reportedly increasing further.
Comments
One of the well-known studies regarding the usefulness of mass screening for lung cancer is the Mayo Lung Project,
which concluded that the screening scheme using plain chest radiography combined with sputum cytology does not
cause a decrease in the mortality rate.1) A subsequent investigation of the long-term prognosis reported that some
patients in the screened group had favorable outcomes but that the mortality rate was not reduced.2)
In contrast, there have been reports of case-control studies from Japan that, as a result of the application of screening
for tuberculosis using plain chest radiography to lung cancer, deaths due to lung cancer were reduced by 20-60%.3-5)
The above studies have been subjected to various criticisms. For example, in the Mayo Lung Project, the intervention
group underwent plain chest radiography and sputum cytology every 4 months but the no-intervention group underwent
these examinations annually, and there have been controversy about the control group and research design. Since the
reports from Japan were case-control studies, they were excluded from the evaluation due to emphasis on analysis based
on randomized controlled trials, and the reported decreases in the mortality rate were rejected.6)
Under these circumstances, a study of the effects of screening for 4 cancers including lung cancer on the mortality
rate, in which an intervention group underwent plain chest radiography annually 4 times and a no-intervention group
underwent no radiographic examination, reported no difference in the mortality rate between the two groups after a 13year follow-up.7) Various views have been presented regarding these results: Screening was found to be effective on reanalysis of the screening methods and conclusions,8) new cancers arose during a long-term follow-up after screening
over a limited period,2,7) and the evaluation of an appropriate observation period has been suggested to be necessary.
Index words and secondary materials used as references
A search of PubMed was performed using “lung cancer”, “screening”, and “chest radiograph” as key words. The Japan
Lung Cancer Society eds: Guidelines for the Diagnosis and Treatment of Lung Cancer by Techniques of EBM 2003, 2005
were also used as references.
References
1) Fontana RS et al: Lung cancer screening: the Mayo Program. J Occup Med 28: 746-750, 1986 (Level 2)
2) Marcus PM et al: Lung cancer mortality in the Mayo Lung Project: impact of extended follow-up. J Natl Cancer Inst 92: 1308-1316, 2000 (Level
2)
3) Sobue T et al: A case-control study for evaluating lung-cancer screening in Japan. Int J Cancer 50: 230-237, 1992 (Level 4)
4) Nishii K et al: A case-control study of lung cancer screening in Okayama prefecture, Japan. Lung Cancer 34: 325-332, 2001 (Level 2)
5) Nakayama T et al: An evaluation of chest X-ray screening for lung cancer in Gunma prefecture, Japan: a population-based case-control study.
Eur J Cancer 38: 1380-1387, 2002 (Level 2)
6) Manser RL et al: Screening for lung cancer. The Cochrane Collaboration 1-18, 2004 (Level 1)
7) Oken MM et al: Screening by chest radiograph and lung cancer mortality: the prostate, lung, colorectal, and ovarian (PLCO) randomized trial.
JAMA 306: 1865-1873, 2011 (Level 2)
8) Iinuma T: Evaluating the effectiveness of CT screening using mathematical models based on the NLST and PLCO reports. http://www.jscts.
org/pdf/mm/20120213_ex.pdf (Level 4)
10
The Japanese imaging guideline 2013
CQ 035
35
Are CT and PET appropriate for the differential
diagnosis of benign and malignant lung nodules?
Recommendation
grade
A
C1
A High-resolution CT (thin-section CT)
C1 Contrast-enhanced CT, PET
High-resolution CT (thin-section CT), which allows micromorphological evaluation,
is strongly recommended for the differential diagnosis of benign and malignant lung
nodules.
Contrast-enhanced CT may be considered for the differential diagnosis of benign and
malignant nodules.
At facilities capable of performing PET, its implementation may be considered.
Background/objective
Concerning the handling of lung nodules detected by plain chest radiography or CT on screening for lung cancer
or during follow-up of other diseases, it is the present protocol to first perform high-resolution CT and to make the
judgment of whether or not invasive examinations such as bronchoscopy or percutaneous biopsy should be performed
is made by comprehensively evaluating the nodule size, marginal characteristics, degree of enhancement, internal
structure, and state of the surrounding lung parenchyma. However, there are no objective criteria for the interpretation
of morphological findings, and inter-reader variability cannot be excluded. Also, if invasive examinations are not
performed, serial examinations are performed to evaluate time-associated changes. Recently, the clinical application
of the judgment of the degree of malignancy of lung nodules based on the measurement of the doubling time has been
initiated.
For the differential diagnosis by contrast-enhanced CT or MRI, analysis of the degree of contrast enhancement by
comparison between pre-and post-contrast images and pattern of signal intensification by dynamic study is also
performed. Moreover, since PET/CT, which has become available at many facilities, provides information concerning
metabolism of nodules by the use of the standardized uptake value (SUV) in addition to morphological information by
CT, the precision of the discrimination between benign and malignant nodules is expected to be improved by the use of
such additional information.
Comments
1) High-resolution CT
There have been a large number of studies comparing high-resolution CT and pathological findings, 1,2) and the
understanding of the histological background of the margins and internal properties of lung nodules in high-resolution
CT images has been advanced (Figure 1). However, as high-resolution CT images are interpreted by subjective
criteria of image readers, and as no objective criteria for the discrimination of benign and malignant nodules have been
established, differences in the evaluation criteria among studies are problematic. This has led to marked variation in the
sensitivity and specificity depending on histological types and properties of nodules included in the study and the state
of the surrounding lung tissue.3-6) According to the present protocol, the differential diagnosis of solitary lung nodules is
first performed non-invasively by high-resolution CT in consideration of the size. Nodules less than 5 mm in diameter
are followed up after 1 year, and those 5 mm or greater and less than 10 mm are followed up after 3 months, and, if
enlargement is observed, invasive examinations are utilized. Nodules 10 mm or greater in diameter are examined by
PET, and more invasive examinations may be recommended depending on the results.7,8)
If a lung nodule is detected incidentally in asymptomatic patients, it has become possible to measure its volume by
helical scanning of high-resolution CT. This has made the calculation of its doubling time from the interval of 2 serial
scans possible. The doubling time is calculated by such a quantitative method even on a short-term follow-up, during
which no visual change can be perceived, and tentative classification of nodules with a short doubling time of less than
400 days as malignant has been introduced.9)
2) Contrast-enhanced CT/MRI
Since contrast enhancement is considered to be stronger in malignant than benign nodules, the discrimination of noncalcified benign and malignant nodules using a cutoff value of the difference in the CT value between before and after
the administration of an iodine-based contrast agent was also evaluated in a multi-center study. When nodules showing
15 HU or higher contrast enhancement were regarded as malignant and those showing less contrast enhancement as
benign, the sensitivity and specificity were 98 and 58%, respectively10) These results suggest that nodules showing
contrast enhancement of less than 15 HU are very likely to be benign but that those showing contrast enhancement of
15 HU or higher may also be benign diseases including organizing pneumonia. Also, according to meta-analysis of
studies concerning the differential diagnosis of benign and malignant lung nodules by contrast-enhanced dynamic CT,
11
The Japanese imaging guideline 2013
3. Thoracic region
A
B
Figure 1: Pulmonary adenocarcinoma
A Contrast CT with a slice thickness of 5 mm and an FOV including the bilateral lungs: While
the presence of a small solid lesion is suspected on the margin of a cystic lesion on the dorsal
side of the lower lobe of the right lung, the diagnosis of its properties is difficult. B Highresolution CT with a slice thickness of 1.3 mm and an FOV focused on one lung: The lesion
on the margin of the cystic lesion on the dorsal side of the lower lobe of the right lung is
well demarcated from the normal lung tissue ( → ) and is suspected to be lung cancer. It was
diagnosed as adenocarcinoma by examination of the resected specimen.
A
B
Figure 2 Squamous cell carcinoma of the lung
A High-resolution CT with a slice thickness of 0.6 mm: A well demarcated nodule is observed in the right lung base.
It shows no lobulation or spicula, and the differential diagnosis between benign and malignant diseases is difficult.
B PET/CT image obtained 10 days after A: The SUVmax of the nodule in the right lung base is 2.43, and the
disease was more strongly suspected to be malignant by comprehensive evaluation of PET/CT and high-resolution
CT findings. The lesion was diagnosed to be squamous cell carcinoma by examination of the resected specimen.
the sensitivity and specificity were 98-89% and 88-43%, respectively, and no improvement in the diagnostic ability
compared with contrast-enhanced CT can be expected. The sensitivity and specificity of contrast-enhanced dynamic
MRI were 99-95% and 79-64%, respectively, being comparable to those of contrast-enhanced CT.11)
3) PET
PET, by which benign and malignant lung nodules can be differentially diagnosed according to the degree of glucose
metabolism, has been shown by a number of studies to have higher diagnostic power than CT (Figure 2).11-14) Moreover,
since the SUV, which is used as a semi-quantitative index, is affected by factors including the model of PET equipment,
imaging method, patient’s glucose level, and site of the lesion (apex or base), there is limitation in the use of a fixed
cutoff value for the discrimination of benign and malignant nodules. Therefore, it is not recommended to attempt the
differential diagnosis of benign and malignant lesions by the SUV alone in daily clinical practice. In addition, there
is a marked volume effect in relatively small tumors, and the diagnostic ability is known to be markedly reduced in
nodules less than 10 mm in diameter. Therefore, PET is recommended to be used for the discrimination of benign and
12
The Japanese imaging guideline 2013
CQ 035
malignant nodules 10 mm or greater in diameter. Also, regarding histological characteristics, tumors of intermediate
malignancy, those showing lepidic growth, mucin-producing tumors, and tumors with marked central scar and known to
show false negative images even when they are 10 mm or greater in diameter. On the other hand, some granulomatous
inflammatory nodules such as tuberculoma and cryptococcosis are known to give false positive results.15,16) Therefore,
it is recommended to consistently diagnose lung nodules comprehensively by morphological examination using highresolution CT and in consideration of information concerning glucose metabolism obtained by PET.
Index words and secondary materials used as references
A search of PubMed was performed using “lung nodule” and “differential diagnosis” as key words. The Japan Lung
Cancer Society eds: Guidelines for the Diagnosis and Treatment of Lung Cancer 2005 was also used as a reference.
References
1) Aoki T et al: Evolution of peripheral lung adenocarcinomas: CT findings correlated with histology and tumor doubling time. AJR 174: 763-768,
2000 (Level 2)
2) Furuya K et al: New classification of small pulmonary nodules by margin characteristics on high-resolution CT. Acta Radiol 40: 496-504, 1999
(Level 2)
3) Zwirewich CV et al: Solitary pulmonary nodule: high-resolution CT and radiologic-pathologic correlation. Radiology 179: 469-476, 1991 (Level
2)
4) Seemann MD et al: Usefulness of morphological characteristics for the differentiation of benign from malignant solitary pulmonary lesions
using HRCT. Eur Radiol 9: 409-417, 1999 (Level 2)
5) Takanashi N et al: The diagnostic accuracy of a solitary pulmonary nodule using thin-section high resolution CT. Lung Cancer 13: 105-112,
1995 (Level 3)
6) Sakai S et al: Lung cancer associated with diffuse pulmonary fibrosis: CT-pathologic correlation. J Thorac Imaging 18: 67-71, 2003 (Level 2)
7) Winer-Muram HT et al: The solitary pulmonary nodule. Radiology 239: 34-49, 2006 (Level 1)
8) MacMahon H et al: Guidelines for management of small pulmonary nodules detected on CT scans: a statement from the Fleischner Society.
Radiology 237: 395-400, 2005 (Level 1)
9) van Klaveren RJ et al: Management of lung nodules detected by volume CT scanning. N Engl J Med 361: 2221-2229, 2009 (Level 1)
10) Swensen SJ et al: Lung nodule enhancement at CT: multicenter study. Radiology 214: 73-80, 2000 (Level 1)
11) Cronin P et al: Solitary pulmonary nodules: meta-analytic comparison of cross-sectional imaging modalities for diagnosis of malignancy.
Radiology 246: 772-782, 2008 (Level 1)
12) Lowe VJ et al: Prospective investigation of PET in lung nodules. J Clin Oncol 16: 1075-1084, 1998 (Level 2)
13) Gould MK et al: Accuracy of positron emission tomography for diagnosis of pulmonary nodules and mass lesions. A meta-analysis. JAMA 285:
914-924, 2001 (Level 1)
14) Fletcher JW et al: A comparison of the diagnostic accuracy of 18F-FDG PET and CT in the characterization of solitary pulmonary nodules. J
Nucl Med 49: 179-185, 2008 (Level 2)
15) Kim SK et al: Accuracy of PET/CT in characterization of solitary pulmonary lesions. J Nucl Med 48: 214-220, 2007 (Level 2)
16) Nomori H et al: Evaluation of 18F fluorodeoxyglucose (FDG) PET scanning for pulmonary nodules less than 3 cm in diameter, with special reference to the CT images. Lung Cancer 45: 19-27, 2004 (Level 2)
13
The Japanese imaging guideline 2013
3. Thoracic region
36
Is high-resolution CT (HRCT) appropriate for the
diagnosis of drug-induced lung injuries?
Recommendation
grade
C1
While scientific evidence is insufficient, its implementation may be considered.
Background/objective
There is no reliable non-invasive diagnostic method for drug-induced lung injuries. Clinical diagnostic criteria
include the presence of reports of lung disorders caused by the suspected drug, occurrence of lung disorder after its
administration, improvement after its cessation and recurrence of lung disorder on its readministration, but it is essential
to exclude similar diseases such as the progression of primary disease and infection.
Comments
Imaging findings of drug-induced lung injuries are non-specific, and a definitive diagnosis is impossible by imaging
studies alone, but they have some benefits. Imaging findings in drug-induced lung injuries are extremely diverse, and
clinical findings including the disease history and course should be evaluated comprehensively with imaging, laboratory,
and pathological findings for the diagnosis. Existing chronic fibrosing interstitial pneumonitis is a risk factor of druginduced lung injury and of poor life prognosis after its occurrence.1)
An imaging finding at the onset is a bilateral extensive ground-glass opacity or infiltrative opacity accompanied by
interlobular septal thickening and intralobular reticular pattern.2) While there is no characteristic finding, if only one
lung is affected, the intact lung is likely to show more distinct opacities. Images are classified into patterns based on
resemblance to those of idiopathic diseases such as hypersensitivity, eosinophilic, and organizing pneumonia, but the
validity or reproducibility of this classification of image patterns or precise image-pathology correlation has not been
sufficiently evaluated,3) thus the image pattern classification should be used with knowledge of its limitations. The
severest lung disorder is the diffuse alveolar damage (DAD) type, which purports a poor prognosis (Figure).4,5) Findings
of structural remodeling observed on CT such as traction bronchiectasis (Figure) mean DAD type lung disorder and
suggest a poor prognosis. However, no structural remodeling such as traction bronchiectasis is noted in the exudative
phase, an early stage of DAD, and it is important to note limitations of imaging modalities.
The roles of imaging modalities in the diagnosis and treatment of drug-induced lung injuries include: (1) Evaluation
of the presence or absence and severity of existing chronic interstitial pneumonia, (2) determination of the time of the
onset of lung disease, (3) helping with the differential diagnosis at the onset, (4) prognosis, and (5) evaluation of the
Figure: Pemetrexed-induced lung injury
Extensive ground-glass opacities are observed. In the ground-glass opacities, reticular
opacities and traction bronchiectasis are noted, consistent with a DAD pattern.
14
The Japanese imaging guideline 2013
CQ 036
therapeutic effects. Images are objective evidence of the occurrence of lung injuries and are important for analysis of the
temporal relationship of the onset with the history of drug administration.
Index words and secondary materials used as references
PubMed was searched using “drug”, “lung injury”, and “CT or imaging” as key words. The Japanese Respiratory
Society eds: Guidelines for the Diagnosis and Treatment of Drug-Induced Lung Disease, 2nd edition was also used as a
reference.
References
1) Kudoh S et al: Interstitial lung disease in Japanese patients with lung cancer: a cohort and nested case-control study. Am J Respir Crit Care
Med 177: 1348-1357, 2008 (Level 2)
2) Akira M et al: Drug-induced pneumonitis: thin-section CT findings in 60 patients. Radiology 224: 852-860, 2002 (Level 4)
3) Cleverley JR et al: Drug-induced lung disease: high-resolution CT and histological findings. Clin Radiol 57: 292-299, 2002 (Level 4)
4) Inoue A et al: Severe acute interstitial pneumonia and gefitinib. Lancet 361: 137-139, 2003 (Level 4)
5) Sakai F et al: Leflunomide-related lung injury in patients with rheumatoid arthritis: imaging features. Mod Rheumatol 15: 173-179, 2005 (Level
4)
15
The Japanese imaging guideline 2013
3. Thoracic region
37
Is expiratory CT appropriate for the diagnosis of
obstructive lung diseases?
Recommendation
grade
C1
While scientific evidence is insufficient, its implementation may be considered.
Background/objective
Expiratory CT is a technique for functional respiratory imaging used basically for research purposes such as the
evaluation of air trapping as a result of obstruction of narrowed peripheral airways and tracheal and bronchial collapse
during expiration in bronchial asthma and chronic obstructive pulmonary disease (COPD). Whether or not expiratory
CT is useful for the diagnosis of obstructive lung diseases was evaluated.
Comments
CT examination is not considered essential for the diagnosis of obstructive lung disease as observed in the GOLD
and COPD guidelines of the Japanese Respiratory Society. The basic principle of the diagnosis of obstructive lung
disease is examination of the respiratory function. Therefore, CT is unnecessary for the diagnosis of various obstructive
lung diseases per se. However, these guidelines also mention that CT is useful when they must be morphologically
discriminated from other diseases or for detecting mild pulmonary emphysema. Expiratory CT has also not been
reported to be necessary for the diagnosis of various obstructive lung diseases itself. However, it may be used clinically
for planning treatments and evaluating therapeutic effects as a method for functional respiratory imaging targeted to
air trapping and tracheal/bronchial collapse in obstructive lung diseases. Therefore, expiratory CT may be needed
depending on the objective.
In obstructive lung diseases, expiratory CT is used typically for 1) the evaluation of air trapping, 2) evaluation of
airway collapse, 3) quantitative evaluation of pulmonary emphysema, and 4) diagnosis of obstructive diseases with
normal inspiratory CT but abnormal expiratory CT findings (Figure).
Evaluation of air trapping and pulmonary function by expiratory CT: By expiratory CT, air trapping is evaluated
by methods using the lung densitometry threshold or mean lung density, and the degree of air trapping in various
obstructive lung diseases evaluated by all methods have been reported to be correlated with the severity of obstructive
ventilatory defect indicated by respiratory function tests. 1-3) However, as air trapping is also observed in healthy
individuals,4) it must be interpreted carefully.
Evaluation of tracheal/bronchial collapse and lung function by expiratory CT: Bronchial collapse is evaluated by
comparing changes in the luminal areas of the segmental, subsegmental, and subsubsegmental bronchi compared with
those on inspiratory CT. It has been reported that the inspiratory/expiratory luminal area ratio in COPD patients was
correlated with obstructive ventilator defect and that this tendency was most notable in the peripheral subsubsegmental
bronchi.5)
Evaluation of pulmonary emphysema by expiratory CT: By expiratory CT, a tendency to underestimate pulmonary
emphysema has been suggested,6) and inspiratory CT has been reported to be superior to expiratory CT in the
quantitative evaluation of pulmonary emphysema.7)
Obstructive diseases with normal inspiratory CT and abnormal expiratory CT findings: Bronchiolitis obliterans and
bronchial asthma are typical examples of obstructive diseases with normal inspiratory CT and abnormal expiratory CT
findings. In these diseases, the possibility of early detection of mild abnormalities by expiratory CT has been suggested.6)
Particularly, it has been reported to be useful for the diagnosis of bronchiolitis obliterans syndrome occurring after lung
transplantation with sensitivity and specificity of 83 and 89%, respectively.8)
There are several methods for expiratory CT including 1) end-expiratory scan, 2) continuous expiratory scan,
and 3) dynamic scan. End-expiratory scan performed during breath-holding at the residual volume level is most
widely employed. While dynamic scan has been reported to have excellent ability to detect airway collapse in
tracheobronchomalacia,9) merits of its use in clinical settings are few except for special purposes from the viewpoint
of X-ray exposure. It is also necessary to reduce the exposure in the scanning protocols of expiratory CT. Although the
inter-reader agreement rate and confidence level of image evaluation decrease with the tube current, decreases to 20
mAs have been reported not to cause problems.10)
16
The Japanese imaging guideline 2013
CQ 037
A
B
Figure: Bronchiolitis obliterans
A Inspiratory CT
B Expiratory CT
Index words and secondary materials used as references
A search of PubMed was performed using “CT” and “expiratory OR expiration” as key words. The Global Strategy for
Diagnosis, Management, and Prevention of COPD (Updated December 2011) and Japanese Respiratory Society eds:
Guidelines for the Diagnosis and Treatment of COPD (chronic obstructive pulmonary disease), 3rd edition, 2009 were
also used as references.
References
1) Lamers RJ et al: Chronic obstructive pulmonary disease: evaluation with spirometrically controlled CT lung densitometry. Radiology 193: 109113, 1994 (Level 2)
2) Arakawa H et al: Air trapping on expiratory high-resolution CT scans in the absence of inspiratory scan abnormalities: correlation with pulmonary function tests and differential diagnosis. AJR 170: 1349-1353, 1998 (Level 4)
3) Matsuoka S et al: Quantitative assessment of air trapping in chronic obstructive pulmonary disease using inspiratory and expiratory volumetric
MDCT. AJR 190: 762-769, 2008 (Level 4)
4) Tanaka N et al: Air trapping at CT: high prevalence in asymptomatic subjects with normal pulmonary function. Radiology 227: 776-785, 2003
(Level 2)
5) Matsuoka S et al: Airway dimensions at inspiratory and expiratory multisection CT in chronic obstructive pulmonary disease: correlation with
airflow limitation. Radiology 248: 1042-1049, 2008 (Level 4)
6) Nishimura K et al: Comparison of different computed tomography scanning methods for quantifying emphysema. J Thorac Imaging 13: 193198, 1998 (Level 4)
7) Gevenois PA et al: Pulmonary emphysema: quantitative CT during expiration. Radiology 199: 825-829, 1996 (Level 3)
8) Bankier AA et al: Bronchiolitis obliterans syndrome in heart-lung transplant recipients: diagnosis with expiratory CT. Radiology 218: 533-539,
2001 (Level 3)
9) Baroni RH et al: Tracheobronchomalacia: comparison between end-expiratory and dynamic expiratory CT for evaluation of central airway collapse. Radiology 235: 635-641, 2005 (Level 4)
10) Bankier AA et al: Air trapping: comparison of standard-dose and simulated low-dose thin-section CT techniques. Radiology 242: 898-906,
2007 (Level 3)
17
The Japanese imaging guideline 2013
3. Thoracic region
38
Is high-resolution CT appropriate for the diagnosis of
idiopathic pulmonary fibrosis (IPF)?
Recommendation
grade
A
While IPF is not always diagnosable by high-resolution CT, the modality shows a
high positive predictive value for usual interstitial pneumonia (UIP) and is strongly
recommended.
Background/objective
While about half the patients with IPF show atypical images on high-resolution CT (HRCT),1) the ATS/ERS diagnostic
criteria for idiopathic interstitial pneumonias attach importance to HRCT findings because of high diagnostic accuracy
for UIP with typical HRCT findings. How HRCT should be used for the diagnosis of IPF is discussed.
Comments
According to the ATS/ERS guidelines,2) the following 7 diseases are included in idiopathic interstitial pneumonias as
clinicopathological entities. They are idiopathic pulmonary fibrosis (IPF), cryptogenic organizing pneumonia (COP),
acute interstitial pneumonia (AIP), non-specific interstitial pneumonia (NSIP), respiratory bronchiolitis-associated
interstitial lung disease (RB-ILD), desquamative interstitial pneumonia (DIP), and lymphocytic interstitial pneumonia
(LIP). Histological findings of IPF are those of UIP. Each of these diseases shows characteristic HRCT features (Figure).
In IPF, it is impossible to judge whether the condition is idiopathic or not by pathological examination or HRCT.
All causative interstitial pneumonias must be excluded clinically to determine that the disease is idiopathic. However,
HRCT occupies the most important place in non-invasive examinations for the diagnosis of IPF. The 2002 edition of
the ATS/ERS guidelines concerning idiopathic interstitial pneumonias mentions that HRCT is indispensable for the
evaluation of idiopathic interstitial pneumonias and that clinical imaging and pathological findings must be integrated
for the diagnosis. Moreover, the guidelines recommend to first judge whether a pattern typical of UIP is present or not
in reading HRCT images,2) because the diagnostic accuracy is 90% or higher when there is an HRCT pattern typical of
UIP, the prognosis of UIP is poorer than those of other interstitial pneumonias, and they require different treatments. If
there is an HRCT pattern typical of UIP, surgical lung biopsy is unnecessary.
In the literature evaluating the accuracy of HRCT diagnoses of chronic idiopathic interstitial pneumonias, the diagnoses
were correct in 79%, and the percentage of correct diagnoses was 62% for UIP, 86% for NSIP, 83% for RB-ILD or DIP,
and 79% for LIP.3) In a study of patients suspected to have IPF,4) UIP was diagnosed accurately in about 60% by chest
radiology experts, and the positive predictive value was 96%. The accuracy of the diagnosis of idiopathic interstitial
pneumonias by HRCT varies widely among subjects and according to diagnostic criteria. If the condition is complicated
by pulmonary emphysema, the diagnostic accuracy decreases significantly.5) In an evaluation of HRCT findings in 98
patients with IPF,6) the diagnosis was definite UIP in 34% and NSIP in 30%. Also, the HRCT diagnoses are correlated
with the degree of confidence of image readers, and 84.4% of the diagnoses as probable UIP and 91.7% of the diagnoses
as definite UIP were correct.6) According to the 2011 edition of the ATS/ERS guidelines concerning IPF, the diagnosis
is IPF if HRCT findings suggest UIP even when pathological findings indicate possible or non-classifiable fibrosis but,
in contrast, is possible IPF if the HRCT findings are inconsistent with UIP even when pathological findings indicate
UIP.7) A diagnosis of definite UIP requires the presence of honeycomb lung, dominant basilar subpleural distribution,
and absence of findings inconsistent with UIP (upper/middle lung field dominant, peribronchovascular dominant, or
extensive ground-glass opacities, granulomatous changes, cysts, mosaic pattern/air trapping, and consolidation).7)
In interstitial pneumonias, a retrospective study showed that HRCT findings changed 50% or more of the initial
diagnoses by internists.8) According to another report, the degree of agreement (kappa coefficient) of diagnoses by
multiple clinicians was 0.41 when the diagnosis was made by HRCT alone, increased to 0.51 when the diagnosis was
made by HRCT and clinical information, increased to 0.67 when a radiologist participated in the diagnosis, became 0.75
when pathological findings were added, and increased to 0.85 by consensus diagnoses involving a clinician, radiologist,
and pathologist.9)
HRCT is used for the prognosis as well as diagnosis. In IPF, the degree of traction bronchiectasis has been reported
to affect the prognosis.6) Also, it has been reported that, similarly to pathological diagnoses, a significant difference
was observed in the survival rate between those diagnosed as UIP and those diagnosed as NSIP by HRCT and that the
prognosis differed between typical cases of UIP with a pathological diagnosis of UIP and showing honeycomb lung on
HRCT and atypical cases.10)
Index words and secondary materials used as references
A search of PubMed was performed using “HRCT”, “interstitial pneumonias”, “sensitivity”, and “specificity” as key
18
The Japanese imaging guideline 2013
CQ 038
Figure: HRCT image of IPF
Reticular opacities and honeycombing accompanied
by ground-glass opacities are observed primarily in the
bilateral basilar subpleural regions.
words. The ATS/ERS/JRS/ ALAT Committee on Idiopathic Pulmonary Fibrosis eds: ATS/ERS Guidelines, 2002 and
2011, and related materials were also used as references.
References
1) Souza CA et al: Idiopathic pulmonary fibrosis: spectrum of high-resolution CT findings. AJR 185: 1531-1539, 2005 (Level 4)
2) American Thoracic Society / European Respiratory Society international multidisciplinary consensus classification of the idiopathic interstitial
pneumonias. Am J Respir Crit Care Med 165: 277-304, 2002 (Level 3)
3) Sumikawa H et al: Usual interstitial pneumonia and chronic idiopathic interstitial pneumonia: analysis of CT appearance in 92 patients.
Radiology 241: 258-266, 2006 (Level 4)
4) Hunninghake GW et al: Utility of a lung biopsy for the diagnosis of idiopathic pulmonary fibrosis. Am J Respir Crit Care Med 164: 193-196,
2001 (Level 4)
5) Akira M et al: Usual interstitial pneumonia and nonspecific interstitial pneumonia with and without concurrent emphysema: thin-section CT findings. Radiology 251: 271-279, 2009 (Level 4)
6) Sumikawa H et al: Computed tomography findings in pathological usual interstitial pneumonia: relationship to survival. Am J Respir Crit Care
Med 177: 433-439, 2008 (Level 4)
7) An Official ATS/ERS/JRS/ALAT Statement: idiopathic pulmonary fibrosis: evidence-based guidelines for diagnosis and management. Am J
Respir Crit Care Med 183: 788-824, 2011 (Level 3)
8) Aziz ZA et al: Interstitial lung disease: effects of thin-section CT on clinical decision making. Radiology 238: 725-733, 2006 (Level 4)
9) Flaherty KR et al: Idiopathic interstitial pneumonia: what is the effect of a multidisciplinary approach to diagnosis? Am J Respir Crit Care Med
170: 904-910, 2004 (Level 4)
10) Flaherty KR et al: Radiological versus histological diagnosis in UIP and NSIP: survival implications. Thorax 58: 143-148, 2003 (Level 4)
19
The Japanese imaging guideline 2013
3. Thoracic region
39
Is CT appropriate for the diagnosis of ALI/ARDS?
Recommendation
grade
C1
While CT is not essential for the diagnosis of ALI/ARDS, it is useful for the evaluation
of disease activity, and its implementation may be considered.
Background/objective
Acute lung injury (ALI)/acute respiratory distress syndrome (ARDS) are conditions in which imaging findings play
important roles in the diagnosis. The usefulness of plain chest radiography and CT in the diagnosis of each condition is
evaluated.
Comments
ARDS was first reported in 1967 by Ashbaugh et al., with description of diffuse infiltrative opacities in the bilateral
lungs on plain chest radiography from the onset (Figure 1).1) Subsequently, Petty et al. proposed the concept of adult
respiratory distress syndrome,2) and, through a joint consensus conference by the American Thoracic Society (ATS) and
European Society of Intensive Care Medicine in 1992, its definition and diagnostic criteria were eventually compiled
in 1994.3) As shown in the table, hypoxemia with an acute onset, infiltrative bilateral lung opacities on plain chest
radiographs, and a PaO2/FiO2 (ratio of partial pressure of arterial oxygen and fraction of inspired oxygen) of ≤300
mmHg or 200 mmHg is defined as ARDS if cardiogenic pulmonary edema can be excluded. Thus, the diagnostic criteria
for ALI/ARDS include plain chest X-ray findings, and radiography is essential for their diagnosis. Also, plain chest
radiography can be performed frequently at the bedside, and plain chest radiography performed routinely in the ICU or
on changes in the patient’s condition has been reported to markedly affect the subsequent therapeutic strategy.4,5) Plain
chest radiography is also considered important for monitoring of patients in a critical condition who may develop ALI/
ARDS and those who have developed ALI/ARDS.
CT, on the other hand, is not an essential diagnostic criterion. It also involves the risk of moving patients in a critical
condition and cannot be performed as frequently as plain chest radiography. However, CT has advantages that plain
radiography lacks. First, HRCT findings have been reported to closely reflect pathological findings in ALI/ARDS.
Pathologically, ALI/ARDS is diffuse alveolar damage (DAD), but, in a study comparing pathological findings and
CT images in 14 DAD patients, ground-glass opacities and infiltrative opacities without traction bronchiectasis
corresponded to pathological features of the exudative or early proliferation phase (Figure 2), and ground-glass
opacities and infiltrative opacities accompanied by traction bronchiectasis corresponded to pathological features of the
proliferative or fibrotic phase (Figure 3).6) Also, CT has been reported to be useful for the differentiation between direct
(pneumonitis, aspiration, lung injury) and indirect (sepsis, trauma other than thoracic injuries) causes of ALI/ARDS.7) In
a study of 29 ARDS patients, the extent of abnormalities on CT was broader, and the duration of the stay in the ICU was
longer (median: 21 vs. 12 days), in direct than indirect lung injuries.8) In addition, HRCT findings have been reported to
reflect the prognosis of ALI/ARDS. A study using a scoring system of HRCT findings reported that features resembling
those of traction bronchiectasis showing fibrotic proliferation were a factor of a poor prognosis.9) According to another
study, abnormal opacities occupying 80% or more of the lung field on CT, a ratio of right/left atrial diameters of 1 or
higher, and varicose bronchiectasis were factors of a poor prognosis.10) Thus, CT is considered to be clinically useful,
though not essential for the diagnosis of ALI/ARDS.
Index words and secondary materials used as references
A search of PubMed was performed using “acute respiratory syndrome” and “computed tomography” as key words.
The Japanese Respiratory Society, Guidelines for the Diagnosis and Treatment of ALI/ARDS, 2nd edition was also used
as a reference.
References
1) Ashbaugh DG et al: Acute respiratory distress in adults. Lancet 2: 319-323, 1967 (Level 4)
2) Petty TL, Ashbaugh DG: The adult respiratory distress syndrome. Clinical features, factors influencing prognosis and principles of management. Chest 60: 233-239, 1971 (Level 4)
3) Bernard GR et al: The American-European Consensus Conference on ARDS. Definitions, mechanisms, relevant outcomes, and clinical trial
coordination. Am J Respir Crit Care Med 149 (3 Pt 1): 818-824, 1994 (Level 1)
4) Bekemeyer WB et al: Efficacy of chest radiography in a respiratory intensive care unit. A prospective study. Chest 88: 691-696, 1985 (Level 3)
20
The Japanese imaging guideline 2013
CQ 039
Figure 2: Chest CT image 6 days after
the onset of ARDS
Figure 1: Plain chest radiographic image of
ARDS
Infiltrative opacities/ground-glass opacities are
distributed as patches in the bilateral lung. No
bronchial dilation is noted.
Infiltrative opacities/ground-glass opacities are noted
in the bilateral lung.
Table: Diagnostic criteria
ALI
Acute PaO2/FiO2 ≤300 mmHg (regardless of the PEEP)
Infiltrative opacities of the bilateral lungs
PAWP≤18 mmHg on the measurement or no
clinical signs of left atrial pressure elevation
ARDS Acute PaO2/FiO2 ≤ 200 mmHg (regardless of the PEEP)
Infiltrative opacities of the bilateral lungs
PAWP≤ 18 mmHg on the measurement or no clinical
signs of left atrial pressure elevation
Figure 3: 1 month after the onset of ARDS
Ground-glass opacities/infiltrative opacities
are observed in the bilateral lungs and
are accompanied by features of traction
bronchiectasis.
5) Henschke CI et al: Bedside chest radiography: diagnostic efficacy. Radiology 149: 23-26, 1983 (Level 3)
6) Ichikado K et al: Acute interstitial pneumonia: high-resolution CT findings correlated with pathology. Am J Roentgenol 168: 333-338, 1997
(Level 3)
7) Goodman LR et al: Adult respiratory distress syndrome due to pulmonary and extrapulmonary causes: CT, clinical, and functional correlations.
Radiology 213: 545-552, 1999 (Level 2)
8) Kim SJ et al: Recovery from lung injury in survivors of acute respiratory distress syndrome: difference between pulmonary and extrapulmonary
subtypes. Intensive Care Med 30: 1960-1963, 2004 (Level 2)
9) Ichikado K et al: Prediction of prognosis for acute respiratory distress syndrome with thin-section CT: validation in 44 cases 1. Radiology 238:
321-329, 2006 (Level 2)
10) Chung JH et al: CT predictors of mortality in pathology confirmed ARDS. Eur Radiol 21: 730-737, 2011 (Level 3)
21
The Japanese imaging guideline 2013
3. Thoracic region
40
Is lung cancer screening by low-dose CT appropriate?
Recommendation
grade
C1
C1 High-risk group (aged ≥50 years with a Brinkman index ≥600)
C2 Non-high-risk group
For the high-risk group, while scientific evidence is insufficient, low-dose CT may be
considered as a measure for population-based screening.
For the non-high-risk group, low-dose CT is not recommended as a means for
population-based screening because of the lack of scientific evidence. For individual
screening, it may be performed after appropriate explanation about its unclear effects
and disadvantages such as overdiagnosis and exposure.
C2
Background/objective
Lung cancer screening using low-dose CT has been performed on a limited basis for individual rather than populationbased screening because of the lack of sufficient evidence that it reduces the mortality rate (Figure), but reports
affirming its effectiveness have appeared recently.
Comments
1) Indirect evidence (detection rate, 5-year survival rate)
The detection rate of stage I lung cancer by screening using low-dose CT is high, being 75-100% on the initial
screening and 79-100% on repeated screening, according to the reports from Japan by Sobue et al.1) Sone et al.,2) Nawa
et al.,3) and Yoshimura et al.4) and the report of the International Early Lung Cancer Action Program (I-ELCAP).5)
The 5-year survival rate of patients found to have lung cancer by screening was reported by Sobue et al.1) to be 76.2%
in those detected on the initial screening and 64.9% in those detected on repeated screening. Nawa et al.6) reported that
they were 91 and 84%, respectively, and suggested the female gender, non-smoker, small tumor diameter, and non-solid
morphology as factors of a high survival rate.
2) Direct evidence
In 2011, the National Lung Screening Trial (NLST),7) which was a randomized controlled trial, reported that the
mortality rate due to lung cancer in the high-risk group was reduced by 2.47/1,000 person-years by low-dose CT
screening with a decrease of 20.0% (95% CI: 6.8-26.7, P=0.004) compared with 3.09/1,000 person-years by screening
using plain chest radiography.
Regarding the validation of the effectiveness in the non-high-risk group, reports are still awaited.
3) Notes
Non-low-dose CT (tube current >50 mAs) should not be performed for screening of healthy people. There are also
problems to be solved such as overdiagnosis, radiation exposure, accuracy control, and cost.
A
B
Figure: Well-differentiated adenocarcinoma pT1N0M0, Stage IA
A Low-dose CT image
22
B High-resolution CT image
The Japanese imaging guideline 2013
CQ 040
Index words and secondary materials used as references
A search of PubMed and MEDLINE were performed using “lung cancer”, “screening”, “low-dose”, “CT”, “sensitivity”,
“specificity”, and “mortality” as key words. The Group for “Research on the Establishment of Methods for Appropriate
Cancer Screening and its Assessment” funded by a Ministry of Health, Labour and Welfare Cancer Research Grant
2006 eds: Guidelines for Lung Cancer Screening Based on Efficacy Assessment, 2006 (http://canscreen.ncc.go.jp/pdf/
guideline/guide_lung070111.pdf) and Joint Committee on the Concept of Lung Cancer Screening by Low-Dose CT eds:
Manual for Lung Cancer Screening by Low-Dose CT, 2005 were also used as references.
References
1) Sobue T et al: Screening for lung cancer with low-dose helical computer tomography: anti-lung cancer association project. J Clin Oncol 20:
911-920, 2002 (Level 4)
2) Sone S et al: Results of three-year mass screening programme for lung cancer using mobile low-dose spiral computed tomography scanner.
Br J Cancer 84: 25-32, 2001 (Level 4)
3) Nawa T et al: Lung cancer screening using low-dose spiral CT: results of baseline and 1-year follow-up studies. Chest 122: 15-20, 2002 (Level
4)
4) Yoshimura A et al: A Pilot Study of Lung Cancer Screening with Low-Dose Spiral CT. Jpn J Lung Cancer 40: 99-105, 2000 (Level 4)
5) Henschke CI et al: Early lung cancer action project: initial findings on repeat screening. Cancer 92: 153-159, 2001 (Level 4)
6) Nawa T et al: Long-term prognosis of patients with lung cancer detection on low-dose chest computed tomography screening. Lung Cancer
75: 197-202, 2012 (Level 4)
7) The National Lung Screening Trial Research Team: Reduced lung-cancer mortality with low-dose computed tomographic screening. N Engl J
Med 365: 395-409, 2011 (Level 2)
23
The Japanese imaging guideline 2013
3. Thoracic region
41
Is high-resolution CT appropriate to differentiate
among collagen vascular disease types?
Recommendation
grade
High-resolution CT findings of lung lesions in various collagen diseases markedly
overlap, and clear differences are difficult to find, but discrimination is possible to a
No relevant
degree if characteristic features are observed.
grade
Background/objective
The therapeutic approaches and prognosis of lung lesions of collagen disease vary with the type of collagen disease.
Also, collagen diseases preceded by lung lesions are observed at a relatively high frequency, and the identification
of collagen diseases may be difficult in an early stage. Whether or not the types of collagen disease can be diagnosed
according to HRCT images of lung lesions was evaluated.
Comments
There is no report that evaluated differences in HRCT findings in various collagen diseases (rheumatoid arthritis (RA),
systemic sclerosis (SSc), polymyositis/dermatomyositis (PM/DM), mixed connective tissue disease (MCTD), primary
Sjögren’s syndrome (pSjS), and systemic lupus erythematosus (SLE)) in a single paper. There is a paper that evaluated
whether or not the collagen disease type can be diagnosed from HRCT findings of lung lesions in 49 patients diagnosed
with NSIP by surgical biopsy.1) According to this paper, the collagen disease could be accurately diagnosed in 22 (45%)
of 45 patients. The accuracy of the diagnosis varied among collagen disease types: 47% for RA, 38% for SSc, 61%
for PM/DM, 25% for pSjS, and 0% for MCTD.1) The authors concluded that the diagnosis is possible to some extent if
typical findings such as intralobular reticular opacities in SSc and immediately subpleural linear opacities in PM/DM
are present.
Concerning the characteristics of CT findings in various collagen diseases, the following information can be obtained
by analysis of reports on CT findings in various collagen diseases.3-10)
In RA, airway lesions are observed frequently, and bronchiectasis, bronchiolitis obliterans, and follicular bronchiolitis
are observed relatively frequently.2) Reflecting these disorders, mosaic perfusion, centrilobular shadows, and air trapping
are noted.2,3) In interstitial pneumonia, the UIP and NSIP patterns appear at similar frequencies,4) and the OP pattern
is also occasionally observed.2,4) Reflecting these changes, HRCT presents ground-glass attenuation (GGA), reticular
opacities, and consolidations, and honeycombing is more distinct than in other collagen diseases.2,4)
SSc is characterized by overlapping of microreticular opacities in GGA on the dorsal side and immediately below
the pleura, reflecting the fact that the NSIP pattern is pathologically the most frequent, and is accompanied by traction
bronchiectasis. The findings are closer to those in idiopathic NSIP than to those in IPF/UIP.2,5)
In PM/DM, reflecting the NSIP and OP patterns, which are frequent pathological findings, fused GGA and
consolidation are superimposed over immediately subpleural linear or band-like opacities predominantly in the
lower lung field.6,7) Compared with other collagen diseases, high frequency of consolidations and low frequency of
honeycombing are characteristics (Figure).2,6,7) Also, rapidly progressing interstitial pneumonia may occur in DM
without muscle symptoms (amyopathic DM: ADM),8) and clinical attention to the presence of ADM is necessary if the
above findings are noted.
In MCTD, the UIP or NSIP pattern has been reported pathologically,2,9) and findings including GGA, consolidations,
honeycombing, and centrilobular nodular opoacities have been reported.9)
In pSjS, airway lesions such as follicular bronchiolitis (FB) are observed frequently as in RA, and centrilobular
opacities and tree-in-bud are noted.10) Concerning interstitial pneumonia, there have been reports about LIP, NSIP, and
UIP, and LIP is characterized by centrilobular opacities and cyst formation.2,10)
In SLE, acute lupus pneumonia and diffuse alveolar hemorrhage are important complications,2) and both show diffuse
or mottled GGA or consolidations.
Lung lesions of collagen disease are diverse. Also, since the NSIP pattern is observed most frequently, GGA is a
frequent HRCT finding, and differences among collagen diseases are difficult to find. However, RA or pSjS is suggested
by airway lesions, RA is suggested by conspicuous honeycombing, SSc is suggested by GGA with internal reticular
opacities, and PM/DM is suggested if consolidations in peripheral areas or along the bronchi are noted, possibly
allowing the estimation of collagen disease types.
Index words and secondary materials used as references
PubMed and Japana Centra Revuo Medicina were searched using “collagen disease”, “connective tissue disease”,
24
The Japanese imaging guideline 2013
CQ 041
Figure: Dermatomyositis (DM)-related lung
lesions (NSIP pattern + OP pattern)
GAA is observed immediately below the pleura and
along the bronchi in the bilateral lower lung fields,
and the bronchi in this area are dilated (traction
bronchiectasis). Consolidations are also mixed, and
band-like opacities parallel to the pleura are noted.
individual collagen diseases (“rheumatoid arthritis”, “systemic sclerosis”, “dermatomyositis”, “polymyositis”, “lupus
erythematosus”, “systemic”, “mixed connective tissue disease”, “Sjögren’s syndrome”), “CT”, and “lung” as key words.
References
1) Daimon T et al: Nonspecific interstitial pneumonia associated with collagen vascular disease: analysis of CT features to distinguish the various
types. Intern Med 48: 753-761, 2009 (Level 3)
2) Lynch DA: Lung disease related to collagen vascular disease. J Thorac Imaging 24: 299-309, 2009 (Level 5)
3) Chung MH et al: Airway obstruction in rheumatoid arthritis: CT manifestations, correlated with pulmonary function testing. Yonsei Med J 45:
443-452, 2004 (Level 4)
4) Tanaka N et al: Rheumatoid arthritis-related lung diseases: CT findings. Radiology 232: 81-91, 2004 (Level 3)
5) Desai SR et al: CT features of lung disease in patients with systemic sclerosis: comparison with idiopathic pulmonary fibrosis and nonspecific
interstitial pneumonia. Radiology 232: 560-567, 2004 (Level 2)
6) Ikezoe J et al: High-resolution CT findings of lung disease in patients with polymyositis and dermatomyositis. J Thorac Imaging 11: 250-259,
1996 (Level 3)
7) Mino M et al: Pulmonary involvement in polymyositis and dermatomyositis: sequential evaluation with CT. AJR 169: 83-87, 1997 (Level 2)
8) Tanizawa K et al: HRCT features of interstitial lung disease in dermatomyositis with anti-CADM-140 antibody. Respir Med 105: 1380-1387,
2011 (Level 2)
9) Kozuka T et al: Pulmonary involvement in mixed connective tissue disease: high-resolution CT findings in 41 patients. J Thorac Imaging 16:
94-98, 2001 (Level 3)
10) Taouli B et al: Thin-section chest CT findings of primary Sjögren’s syndrome: correlation with pulmonary function. Eur Radiol 12: 1504-1511,
2002 (Level 2)
25
The Japanese imaging guideline 2013
3. Thoracic region
42
Is MRI appropriate for the diagnosis of mediastinal
tumors?
Recommendation
grade
B
MRI is useful for the diagnosis of cystic lesions of the mediastinum and may also
provide additional information concerning solid tumors of the mediastinum.
It is also very useful for the diagnosis of posterior mediastinal tumors and is
recommended.
Background/objective
Usually, CT is used first for the imaging diagnosis of mediastinal tumors. MRI (Figure) may be performed after
CT, but its necessity or usefulness has not been sufficiently evaluated. The effectiveness of MRI for the diagnosis of
mediastinal tumors was evaluated.
Comments
Mediastinal tumors are classified into anterior, middle, and posterior mediastinal lesions. They are also classified into
cystic and solid lesions according to the internal properties. The site of origin and internal properties must be taken into
consideration in discussing the usefulness of MRI.
There have been few reports directly comparing the usefulness of CT and MRI in mediastinal tumors. According to
comparison of the diagnostic ability of CT and MRI for anterior mediastinal tumors,1) the diagnostic accuracy was 84
and 81% for thymoma, 45 and 15% for thymic cancer, 67 and 33% for teratoma, 36 and 27% for malignant germ cell
tumor, and 55 and 40%, respectively, for malignant lymphoma. In these anterior mediastinal solid tumors, CT shows
equal or higher diagnostic ability compared with MRI. Particularly, for the diagnosis of teratoma, CT is significantly
superior to MRI. Cystic masses of the mediastinum such as thymic, bronchial, and esophageal cysts are known to show
a wide variety of densities and signals on plain CT and T1-weighted MRI due to bleeding or protein content,2,3) making
the diagnosis difficult, but, according to the above report, the diagnostic accuracy for thymic cysts was 46% by CT
and 71% by MRI, being significantly higher for MRI.1) In a report comparing the delineability of various findings of
thymic epithelial tumors by CT and MRI,4) the visualization rate was 18 and 75% for the peritumoral capsule, 13 and
43% for intratumoral septa, and 5 and 17%, respectively, for intratumoral hemorrhage, indicating higher delineation
power of MRI. Fibrotic septa that separate the tumor or a capsule around the tumor visualized by MRI have been
reported to suggest low-malignancy thymoma. There is also a report that stage III thymoma could be differentiated by
dynamic MRI.5) By a study evaluating the correlation between MRI findings and the WHO histological classification of
thymic epithelial tumors,6) encapsulated, distinctly-bordered, round tumors were reported to suggest type A thymoma,
and tumors with intratumoral hypointense areas on T2-weighted image or mediastinal lymph node enlargement to
suggest thymic cancer. It is difficult to diagnose the WHO histological classification from MRI findings in other tumor
types. Chemical shift imaging has been reported to be useful for the discrimination between thymoma and thymic
hyperplasia.7)
Since CT and MRI are equally useful for the evaluation of great vessel invasion of thymic epithelial tumors,4) the
invasiveness of the tumor may be evaluated by MRI if contrast-enhanced CT is impossible due to iodine allergy.
Most masses arising in the posterior mediastinum are neurogenic tumors such as schwannoma, neurofibroma,
gangliocytoma, paraganglioma, and neuroblastoma, and MRI is useful for the evaluation of the relationships of the
tumor with the nerves and intervertebral foramen (Figure).8) Recently, it has become possible to readily prepare MPR
images using volume data of CT and to reconstruct images other than transverse views. While the superiority of MRI is
diminishing, there is no report comparing the usefulness of CT and MRI concerning posterior mediastinal tumors.
Index words and secondary materials used as references
A search of PubMed was performed using “MRI”, “thymoma”, “thymic epithelial tumor”, “lymphoma”, “mediastinum”,
and “mediastinal tumor” as key words.
References
1) Tomiyama N et al: Anterior mediastinal tumors: diagnostic accuracy of CT and MRI. Eur J Radiol 69: 280-288, 2009 (Level 4)
2) Murayama S et al: Signal intensity characteristics of mediastinal cystic masses on T1-weighted MRI. J Comput Assist Tomogr 19: 188-191,
1995 (Level 4)
3) Jeung MY et al: Imaging of cystic masses of the mediastinum. Radiographics 22: S79-S93, 2002 (Level 4)
4) Sadohara J et al: Thymic epithelial tumors: comparison of CT and MR imaging findings of low-risk thymomas, high-risk thymomas, and thymic
26
The Japanese imaging guideline 2013
CQ 042
A
B
Figure: Gangliocytoma
A Contrast-enhanced CT: A mass is observed in the posterior mediastinum (right paravertebral
region). Contrast enhancement is moderate, and the interior is nearly homogeneous.
B
Coronal T1-weighted MRI: The vertical extent of the tumor is easy to evaluate by MRI. The
lesion is a long and thin tumor showing wide-based spread involving multiple vertebral bodies.
carcinomas. Eur J Radiol 60: 70-79, 2006 (Level 4)
5) Sakai S et al: Differential diagnosis between thymoma and non-thymoma by dynamic MR imaging. Acta Radiol 43: 262-268, 2002 (Level 4)
6) Inoue A et al: MR imaging of thymic epithelial tumors: correlation with World Health Organization classification. Radiat Med 24: 171-181, 2006
(Level 4)
7) Inaoka T et al: Thymic hyperplasia and thymus gland tumors: differentiation with chemical shift MR imaging. Radiology 243: 869-876, 2007
(Level 4)
8) Sakai F et al: Intrathoracic neurogenic tumors: MR-pathologic correlation. AJR 159: 279-283, 1992 (Level 4)
27
The Japanese imaging guideline 2013
3. Thoracic region
43
Is CT appropriate for the discrimination of benign and
malignant pleural lesions?
Recommendation
grade
B
CT is useful for the discrimination of benign and malignant pleural lesions and is
recommended.
Background/objective
Pleural lesions are often asymptomatic, and their detection by imaging examinations is important, but the diagnostic
ability of plain chest radiography is limited. The usefulness of CT findings for the differential diagnosis of benign and
malignant pleural lesions was evaluated.
Comments
The discrimination of pleural and intrapulmonary lesions by plain chest radiography is not necessarily easy, and
CT is performed for diagnosing pleural lesions. By CT the extent and morphology of pleural lesions, degree of their
intrathoracic growth, presence or absence of bone destruction, presence or absence of thoracic wall invasion, etc. can be
evaluated.
The differentiation of benign and malignant pleural lesions is considered possible in most cases. In a retrospective
study performed in 1989 examining 74 patients with diffuse pleural diseases (39 with malignant and 35 with benign
diseases) by CT (a contrast agent was used except in those exposed to asbestos), the specificity and sensitivity using (1)
circumferential pleural involvement/pleural rind, (2) nodular pleural thickening, (3) ≥1 cm thickening of the parietal
pleura, and (4) mediastinal pleural lesions were 100, 94, 94, and 88% and 41, 51, 36, and 56%, respectively, and 28 of
the 39 malignant tumors could be diagnosed by fulfilling 1 or more of these 4 criteria.1)
In a prospective study reported in 2001, in which 40 patients with pleural effusion were examined by thoracic contrastenhanced CT using similar diagnostic criteria, malignant diseases could be diagnosed in 28 of the 32 patients, and
benign diseases could be diagnosed in all 8 patients (specificity: 84%, sensitivity: 100%), according to pleural surface
findings (nodular change or irregularity). This study indicated that circumferential pleural involvement/pleural rind was
a poorly reliable finding observed at similar frequencies in benign and malignant lesions.2)
According to a retrospective study in which 215 patients with pleural diseases (99 with malignant mesothelioma,
39 with pleural metastatic tumor, and 77 with benign pleural diseases) were examined using contrast-enhanced CT,
circumferential pleural involvement/pleural rind was noted in 70% of the patients with malignant mesothelioma but
Figure 1: Tuberculous pleuritis
Right-sided pleural effusion is noted, and
thickening of 2-3 mm with a smooth surface
is observed in the parietal pleura with contrast
enhancement. The diagnosis was tuberculous
pleuritis.
28
Figure 2: Malignant mesothelioma
Right-sided pleural effusion is noted, and
thickening with an irregular surface is observed
in the parietal pleura with contrast enhancement.
The pleural thickness is about 1 cm on the
lateral epiphrenic region ( ▲ ). The diagnosis was
malignant mesothelioma.
The Japanese imaging guideline 2013
CQ 043
in 15% of those with metastatic pleural tumor, 9% of those with tuberculous pleuritis, 5% of those with progressive
benign pleural disease, and none of those with pyothorax. Nodular pleural thickening was observed in 48% of those
with malignant mesothelioma and 13% of those with metastatic pleural tumors, but none of those with tubuerculous
pleuritis or pyothorax, and nodule-like thickening was noted in 16% of those with progressive benign pleural disease.
Thickening of the parietal pleura of ≥1 cm was noted in 59% of the patients with malignant mesothelioma, 17% of those
with metastatic pleural tumors, 75% of those with tuberculous pleuritis, 61% of those with pyothorax, and 53% of those
with progressive benign pleural disease and is considered unreliable. Mediastinal pleural lesions were reported in 85%
of those with malignant mesothelioma, 33% of those with metastatic pleural tumors, 22% of those with tuberculous
pleuritis, 12% of those with pyothorax, and 16% of those with progressive benign pleural disease (Figures 1, 2)3)
Changes in the pleural surface (nodular change or irregularity) and the presence of a mediastinal pleural lesion were
particularly reliable findings, and circumferential pleural involvement/pleural rind and thickening of the parietal pleura
of ≥1 cm are considered to be usable as reference findings depending on the situation. A contrast agent should be used.
Index words and secondary materials used as references
A search of PubMed was performed using “pleural tumor” and “CT” as key words. The Japan Lung Cancer Society
eds: Guidelines for the Diagnosis and Treatment of Malignant Pleural Mesothelioma, 2007 was also used as a reference.
References
1) Leung AN et al: CT in differential diagnosis of diffuse pleural disease. AJR 154: 487-492, 1990 (Level 3)
2) Traill ZC et al: Thoracic computed tomography in patients with suspected malignant pleural effusions. Clin Radiol 56: 193-196, 2001 (Level 2)
3) Metintas M et al: Computed tomography features in malignant pleural mesothelioma and other commonly seen pleural diseases. Eur J Radiol
41: 1-9, 2002 (Level 3)
29
The Japanese imaging guideline 2013
3. Thoracic region
44
Are CT and MRI appropriate for the diagnosis of T
stage in lung cancer?
Recommendation
grade
A
C1
A CT
C1 MRI
CT has strong scientific evidence and strongly recommended.
If involvement of the chest wall, vertebral bodies, brachial plexus, or diaphragm is
uncertain by CT, the implementation of MRI may be considered.
Background/objective
The usefulness of CT and MRI for the pre-treatment diagnosis of T stage of lung cancer was evaluated.
Comments
Concerning T stage, CT is essential for the accurate measurement of the tumor diameter. Particularly, if the tumor is
long in the craniocaudal direction, reconstructed coronary and sagittal images are useful (Figure 1). CT is also useful
for the diagnosis of the presence or absence of atelectasis and obstructive pneumonia, presence or absence of invasion
to adjacent structures, and extent of involvement of the proximal bronchi.1-3) There is no significant difference in the
sensitivity or specificity between CT and MRI for the differentiation between T0-2 and T3-4 (CT: 63 and 84%, MRI:
56 and 80%), but MRI is reportedly superior regarding mediastinal invasion.1) MRI has been reported to exceed CT
in diagnosing the presence or absence and extent of involvement of the chest wall, vertebral bodies, brachial plexus,
subclavian artery and vein, diaphragm, and mediastinum,1,4,5) and many reports suggested its usefulness, particularly for
the diagnosis of apical tumors (Pancoast tumor).4,5) MRI is recommended if CT shows no clear mass in the chest wall or
bone destruction in the ribs, and the diagnosis is uncertain (Figure 2).
However, no prospective study comparing reconstructed sagittal or coronal CT images based on isotropic volume data
obtained by MDCT and MRI has been conducted. The diagnostic accuracy using 1.25mm thick reconstructed sagittal
images was significantly higher than that using 5mm thick images for invasion of the interlobar pleura, chest wall,
and mediastinum,6) but there has been no comparison with MRI, and the superiority of MRI has not been confirmed.
Also, cine-MRI using respiratory motion has been reported to be useful for the diagnosis of chest wall and mediastinal
involvement, and chest wall invasion can be excluded if separate movements of the tumor and chest wall can be
visualized.7) It is indicated when the tumor appears to have wide contact with the chest wall or mediastinal structures
such as the great vessels on CT, and invasion is suspected.
Index words and secondary materials used as references
A search of PubMed was performed using “lung cancer”, “T-stage”, “invasion”, and “CT” as key words. The NCCN
(ver.2.2012) and ACCP (2nd ed) guidelines and the official ATS/ERS statements were also used as references.
References
1) Webb WR et al: CT and MR imaging in staging non-small cell bronchogenic carcinoma: report of the Radiologic Diagnostic Oncology Group.
Radiology 178: 705-713, 1991 (Level 3)
2) White PG et al: Preoperative staging of carcinoma of the bronchus: can computed tomographic scanning reliably identify stage III tumours?
Thorax 49: 951-957, 1994 (Level 4)
3) Herman SJ et al: Mediastinal invasion by bronchogenic carcinoma: CT signs. Radiology 190: 841-846, 1994 (Level 4)
4) Rapoport S et al: Brachial plexus: correlation of MR imaging with CT and pathologic findings. Radiology 167: 161-165, 1988 (Level 4)
5) Laissy JP et al: Assessment of vascular involvement with magnetic resonance angiography (MRA) in Pancoast syndrome. Magn Reson
Imaging 13: 523, 1995 (Level 4)
6) Higashino T et al: Thin-section multiplanar reformats from multidetector-row CT data: utility for assessment of regional tumor extent in nonsmall cell lung cancer. Eur J Radiol 56: 48-55, 2005 (Level 3)
7) Sakai S et al: Bronchogenic carcinoma invasion of the chest wall: evaluation with dynamic cine MRI during breathing. J Comput Assist Tomogr
21: 595-600, 1997 (Level 4)
30
The Japanese imaging guideline 2013
CQ 044
A
B
Figure 1: Primary lung cancer (pT2aN0M0, stage IB)
A In the transverse HRCT image: The maximum diameter is 28 mm (2 cm<, ≤ 3 cm, cT1b).
B Reconstructed coronal image: The tumor is vertically elongated with a maximum diameter of
48 mm (3 cm<, ≤ 5 cm) and is judged to be cT2a.
A
B
Figure 2: Lung cancer (cT3N2M0, stage IIIA) Rib invasion
A Contrast-enhanced CT: An irregularly-shaped mass is observed on the ventral side of the right upper
lobe. While it is in contact with the right first rib, no clear bone destruction or chest wall mass is noted.
B Postcontrast T1-weighted image: An area of contrast enhancement ( → ) is noted in the right first rib
and surrounding soft tissue, suggesting chest wall invasion.
31
The Japanese imaging guideline 2013
3. Thoracic region
45
Are CT and MRI appropriate for the diagnosis of
lymph node metastasis of lung cancer?
Recommendation
grade
C1
Despite the insufficiency of scientific evidence, both CT and MRI may be considered.
Background/objective
CT is an essential examination for not only the T-stage diagnosis but also anatomical localization of lymph nodes (lymph
node mapping) in the N-stage diagnosis. However, concerning the presence or absence of metastasis (N0 or N1/2/3),
PET has a higher diagnostic ability than CT and is widely used. With improvements in the imaging techniques, MRI has
also been reported to be useful for the N-stage diagnosis. The diagnostic abilities of CT, MRI, and PET/CT for lymph
node metastasis were compared.
Comments
In CT, a short diameter of ≥1 cm is often used as a criterion for lymph node enlargement, but its sensitivity and
specificity (52-75% and 66-88%, respectively) are inferior to those of PET (83-91% and 86-92%, respectively).1-3) On
comparison between CT and MRI using the same criterion (short diameter: ≥1 cm), the diagnostic ability is comparable
and showed no significant difference.4) Regarding the diagnostic ability of PET/CT for intrathoracic lymph node
metastasis, it has been reported that the sensitivity, specificity, and accuracy were 54.2, 91.9, and 80.5%, respectively,
and that the accuracy of the diagnosis of N2N3 was 84.9%.5) Therefore, PET/CT is recommended for the N-stage
diagnosis (Figure 1).
Recently, STIR turbo spin-echo (SE) and diffusion-weighted sequences of MRI have been applied to the N-factor
diagnosis, resulting a report that the diagnostic ability of STIR was higher than that of PET/CT or diffusion-weighted
imaging and that the diagnostic abilities of PET/CT and diffusion-weighted imaging were comparable.6) To use these
techniques as standard examinations, the standardization of the imaging methods and cut-off values is necessary, and
research at multiple facilities is awaited (Figure 2).
Index words and secondary materials used as references
A search of PubMed was performed using “lung cancer”, “lymph node”, “metastasis”, “CT”, “MR”, and “PET” as key
words. The NCCN (ver.2. 2012) and ACCP (2nd ed) guidelines and the official ATS/ERS statements were also used as
references.
References
1) McLuod TC et al: Bronchogenic carcinoma: analysis of staging in the mediastinum with CT by correlative lymph node mapping and sampling.
Radiology 182: 319-323, 1992 (Level 4)
2) Birim O et al: Meta-analysis of positron emission tomographic and computed tomographic imaging in detecting mediastinal lymph node metastases in nonsmall cell lung cancer. Ann Thorac Surg 79: 375-382, 2005 (Level 3)
3) van Tinteren H et al: Effectiveness of positron emission tomography in the preoperative assessment of patients with suspected non-small-cell
lung cancer: the PLUS multicentre randomised trial. Lancet 359: 1388-1393, 2002 (Level 3)
4) Webb WR et al: CT and MR imaging in staging non-small cell bronchogenic carcinoma: report of the Radiologic Diagnostic Oncology Group.
Radiology 178: 705-713, 1991 (Level 3)
5) Billé A et al: Preoperative intrathoracic lymph node staging in patients with non-small-cell lung cancer: accuracy of integrated positron emission
tomography and computed tomography. Eur J Cardiothorac Surg 36: 440-445, 2009 (Level 3)
6) Ohno Y et al: N stage disease in patients with non-small cell lung cancer: efficacy of quantitative and qualitative assessment with STIR turbo
spin-echo imaging, diffusion-weighted MR imaging, and Fluorodeoxyglucose PET/CT. Radiology 261: 605-615, 2011 (Level 2)
32
The Japanese imaging guideline 2013
CQ 045
A
B
Figure 1: Lung cancer (cT1bN2M1b, stage IV)
A Two lymph nodes with a short diameter of <1 cm are observed in the right lower paratracheal region (#4R).
B PET/CT: Marked accumulation of FDG is noted in the #4R lymph nodes.
A
B
Figure 2: Lung cancer (cT2aN3M1b, stage IV)
A Contrast-enhanced CT: An enlarged lymph node with a short diameter of >1 cm (thick → ) is noted in the right
lower paratracheal region (#4R) along with lymph nodes with a short diameter of <1 cm (thin → ) in the left lower
paratracheal region (#4L).
B Diffusion-weighted MRI (b=1,000 s/mm2): The primary lesion in the right upper lobe ( ▲ ) and #4R (thick → ) and
#4L (thin → ) lymph nodes are all hyperintense.
33
The Japanese imaging guideline 2013
3. Thoracic region
46
Is brain contrast-enhanced MRI more appropriate
than contrast-enhanced CT for the diagnosis of brain
metastasis of lung cancer?
Recommendation
grade
A
Head contrast-enhanced MRI has scientific evidence and is strongly recommended to
be performed.
Background/objective
The brain is the most frequent site of distant metastasis of lung cancer, and the diagnosis of its brain metastasis is
important. The diagnostic ability of contrast-enhanced MRI for brain metastasis was compared with that of contrastenhanced CT.
Comments
Contrast-enhanced MRI has been reported to show higher sensitivity for detecting brain lesions than non-contrast
MRI, contrast-enhanced CT, or non-contrast CT and to be able to detect more and smaller metastatic lesions.1,2) This is
considered to be due to higher density resolution, higher contrast-enhancing effect of the contrast agent, and less bone
artifacts in contrast-enhanced MRI compared with CT (Figure). However, there is also a report that, while the detection
rate was higher and smaller metastases could be detected by contrast-enhanced MRI than contrast-enhanced CT, no
significant difference was noted in the mean survival period or 2-year survival rate.3)
According to meta-analysis of 18 papers comparing clinical and CT findings concerning brain metastasis in 1,830
patients with non-small cell lung cancer, the median prevalence of brain metastasis was 3%, and the median negative
predictive value was 97%, in 9 reports exclusively evaluating clinically asymptomatic patients, but the median
prevalence of brain metastasis was 14%, sensitivity was 76%, and specificity was 82%, in 9 reports evaluating both
clinically symptomatic and asymptomatic patients.4) However, in a study of brain metastasis in patients with small cell
lung cancer, the detection rate by MRI (24%) was higher than that by CT (10%), and while patients with CT-detected
brain metastasis were all symptomatic, 11% of those with MRI-detected brain metastasis were asymptomatic.5)
The ACCP guidelines recommend brain MRI, also from the viewpoint of cost-effectiveness, for patients with nonsmall cell lung cancer when there are clinical central nervous system symptoms/signs, because the brain metastasispositive rate is low at 3%, and the negative predictive value is very high in patients negative on clinical examinations.4)
However, as there is a report that the prognosis is more favorable in asymptomatic than symptomatic brain metastasis,6)
the NCCN guidelines (ver.2. 2012) recommend head MRI for stage IB or more advanced non-small cell lung cancer
regardless of symptoms for the detection and early treatment of asymptomatic brain metastasis. For small cell lung
cancer, the guidelines recommend brain MRI to all patients regardless of whether the disease is of the limited or
extensive type in consideration of the high prevalence of brain metastasis in asymptomatic patients. However, as
the histological diagnosis is often unavailable at preoperative staging of the disease, contrast-enhanced brain MRI is
recommended for staging of all lung cancers.
In a study of bronchioloalveolar carcinoma 3 cm or less in diameter, all 25 cases were reported to be T1N0M0,7) and
further evaluation is necessary concerning patients showing pure ground-glass opacity (GGO) on CT. Contrast-enhanced
CT is also considered appropriate when contrast-enhanced MRI is impossible due to reduced renal function, implanted
electronic devices, or implanted metals.
Index words and secondary materials used as references
A search of PubMed was performed using “lung cancer”, “brain metastasis”, “MR”, and “CT” as key words. The
NCCN (ver.2. 2012) and ACCP (2nd Edition) guidelines and official ATS/ERS statements were also used as references.
References
1) Davis PC et al: Diagnosis of cerebral metastases: double-dose delayed CT vs contrast-enhanced MR imaging. AJNR 12: 293-300, 1991
(Level 4)
2) Akeson P et al: Brain metastases--comparison of gadodiamide injection-enhanced MR imaging at standard and high dose, contrast-enhanced
CT and non-contrast-enhanced MR imaging. Acta Radiol 36: 300-306, 1995 (Level 4)
3) Yokoi K et al: Detection of brain metastasis in potentially operable non-small cell lung cancer. Chest 115: 714-719, 1999 (Level 3)
4) Silvestri GA et al: Noninvasive staging of non-small cell lung cancer: ACCP Evidence-Based Clinical Practice Guidelines (2nd ed). Chest 132
(3 suppl): 178S-201S, 2007 (Level 3)
34
The Japanese imaging guideline 2013
CQ 046
A
B
Figure: Multiple brain metastases of lung cancer (cT2aN2M1b, stage IV)
A Contrast-enhanced MRI: Hyperintense nodules ( → ) are observed at 2 sites in the left frontal and left parietal
lobes. B Contrast-enhanced CT: A hyperdense area is visualized in the left temporal lobe ( → ), but the lesion in the
left frontal lobe is difficult to detect.
5) Seute T et al: Detection of brain metastases from small cell lung cancer: consequences of changing imaging techniques (CT versus MRI).
Cancer 112: 1827-1834, 2008 (Level 4)
6) Sánchez de Cos J et al: Non-small cell lung cancer and silent brain metastasis. Survival and prognostic factors. Lung Cancer 63: 140-145,
2009 (Level 4)
7) Sakurai H et al: Bronchioloalveolar carcinoma of the lung 3 centimeters or less in diameter: a prognostic assessment. Ann Thorac Surg 78:
1728-1733, 2004 (Level 4)
35
The Japanese imaging guideline 2013
3. Thoracic region
47
Is bone scintigraphy useful for the diagnosis of bone
metastasis of lung cancer?
Recommendation
grade
C1
While scientific evidence is insufficient, bone scintigraphy is worth considering. It
should be considered particularly when PET cannot be performed in patients clinically
suspected to have bone metastasis.
Background/objective
At the initial examination, bone metastasis is observed in 10-30% of the patients with primary lung cancer, and the
diagnosis of bone metastasis is important for the prognosis and selection of treatments. Search for bone metastasis
used to be made by bone scintigraphy, but recently it is often replaced by PET. This is because PET is comparable in
sensitivity but superior in specificity compared with bone scintigraphy1-3) as the enhancement of tracer uptake also in
trauma, infection, and arthritis reduces the specificity of bone scintigraphy. In contrast, advantages of bone scintigraphy
are the short scanning time and a lower false negative rate for osteoblastic bone metastasis compared with PET. The
diagnostic power for the diagnosis of bone metastasis of primary lung cancer was compared between bone scintigraphy
and PET.
Comments
According to meta-analysis of 8 papers (723 patients), the sensitivity and specificity of bone scintigraphy for bone
metastasis were 82 and 62%, respectively, in primary lung cancer patients with a mean prevalence of 20%, with a
relatively low sensitivity.1) However, according to meta-analysis of 17 papers consisting of 9 on PET/CT, 6 on PET, 6
on MRI, and 16 on bone scintigraphy (2,940 patients), the sensitivity and specificity of PET/CT, PET, MRI, and bone
scintigraphy were 92, 87, 77, and 86% and 98, 94, 92, and 88%, respectively, and the odds ratio was significantly
higher by PET/CT (449.17) and PET (118.25) than by MRI (38.27) and bone scintigraphy (63.37) (Figure).2) Papers not
included in these meta-analyses also reported a higher diagnostic ability for PET than for bone scintigraphy.3)
The ACCP guidelines and official ATS/ERS statements recommend bone scintigraphy only for patients with clinical
symptoms. However, according to a study by Schirrmeister et al., bone metastasis was detected in 27% of asymptomatic
patients, the sensitivity of bone scintigraphy was 87%, and bone metastasis was overlooked in 14-22% of the patients
without bone scanning, resulting in unnecessary surgery or preoperative chemotherapy.4)
The latest NCCN guidelines recommend PET in all stages and disrecommend the implementation of bone scintigraphy
in all patients to exclude asymptomatic bone metastasis. PET, which is performed to detect both mediastinal lymph node
metastasis and distant metastasis, is regarded as the first choice, and bone scintigraphy is considered to be recommended
only to symptomatic patients at facilities incapable of performing PET.
Index words and secondary materials used as references
A search of PubMed was performed using “lung cancer”, “bone metastasis”, and “bone scintigraphy” as key words.
The NCCN (ver. 2. 2012) and ACCP (2nd ed) guidelines and official ATS/ERS statements were also used as references.
References
1) Silvestri GA et al: Noninvasive Staging of Non-small Cell Lung Cancer: ACCP Evidence-Based Clinical Practice Guidelines, 2nd ed. Chest 132
(3 suppl): 178S-201S, 2007 (Level 2)
2) Qu X et al: A meta-analysis of (18) FDG-PET-CT, (18) FDG-PET, MRI and bone scintigraphy for diagnosis of bone metastases in patients with
lung cancer. Eur J Radiol 81: 1007-1015, 2012 (Level 3)
3) Marom EM et al: Staging non-small cell lung cancer with whole-body PET. Radiology 212: 803-809, 1999 (Level 3)
4) Schirrmeister H et al: Omission of bone scanning according to staging guidelines leads to futile therapy in non-small cell lung cancer. Eur J
Nucl Med Mol Imaging 31: 964-968, 2004 (Level 3)
36
The Japanese imaging guideline 2013
CQ 047
A
Figure: Lung cancer (cT1bN2M1b, stage IV)
B
A Bone scintigraphy Anterior view Marked accumulation is noted
vertebrae, suggesting metastasis, but no clear abnormal accumulation
sites. B PET Many high-uptake areas ( → ) are observed in the thoracic
and left ilium. All lesions enlarged on follow-up CT examinations, and a
bone metastases was made.
in the lower lumbar
is observed at other
and lumbar vertebrae
diagnosis of multiple
37
The Japanese imaging guideline 2013
3. Thoracic region
48
Is PET appropriate for the N- /M- staging of lung
cancer?
Recommendation
grade
B
PET is effective for the N- /M-factor staging of lung cancer and is recommended.
Background/objective
PET is a modality carried out by administering a radioisotope that emits positrons and visualizing its distribution in the
body to make diagnoses according to the distribution and kinetics of the tracer. Characteristics of PET include (1) high
resolution and (2) the possibility to correct uptake values in the body, and the procedure has been used along with CT
for staging lung cancer (Figures 1, 2).
Comments
1) N-stage diagnosis
Mediastinal lymph node (N2) metastasis is the most important factor for staging, particularly preoperative staging, of
lung cancer. PET is known to have advantages such as (1) high sensitivity, (2) high resolution, and (3) the possibility to
correct uptake values in the body, but it has four major pitfalls in diagnosing mediastinal lymph node (N2) metastasis:
(1) Lack of diagnostic cutoff values based on semi-quantitative analysis, (2) a poor resolution limitation of 7-10 mm,
(3) weak uptake by well-differentiated, low-grade tumors, and (4) false positive results in inflammation. There have
been a number of reports on (N2) stage analysis using PET.1-3) Silvestri et al. reviewed 44 studies related to mediastinal
lymph node (N2) factor diagnosis published in 1994-2006.4) As a result of sROC analysis of data from 2,865 lung
cancer patients, the sensitivity was 74% (95% CI: 69-79%), and the specificity was 85% (95% CI: 82-88%). The results
indicated that the mediastinal lymph node (N2) diagnosis by PET is more accurate than that by CT but is not perfect.
Particularly, mediastinal lymph node (N2) diagnosis using PET is significant in patients suspected to be in stage IB-IIIB,
and close preoperative examination of lymph nodes by measures including EBUS, thoracoscopy, and mediastinoscopy
is recommended if abnormal findings are obtained by PET.
Gould et al. performed meta-analysis by restricting the targets to lymph node lesions 10 mm or greater in diameter in
consideration of the resolution limit of PET, which is 7-10 mm.5) The sensitivity and specificity of PET was 100 and 78%,
respectively. However, similar analysis targeted to lymph nodes less than 10 mm in diameter showed sensitivity of 82%
and specificity of 93%, respectively, indicating that the results of PET are false negative in about 20% of the patients.
Regarding the results of multicenter randomized controlled trials using PET/CT, Fischer et al. reported sensitivity of 95%
and specificity of 85%, showing improvements compared with the data of PET.6)
2) M-stage diagnosis
For the M-stage diagnosis of lung cancer using PET, unexpected metastases are known to be found in 10-20% of the
patients.4) While this information has a strong clinical impact, much of the data were obtained by single-facility, smallscale, prospective studies. Problems with PET in the M-stage diagnosis include (1) unstandardized evaluation method,
(2) definition of brain metastasis, (3) method to validate negative PET findings, and (4) contribution to the patient’s
prognosis. Depending on the organ, the sensitivity of PET for brain metastasis is only 60%, and MRI shows the highest
accuracy regarding the extent of small lesions and tumors.4) While the diagnostic accuracy in liver metastasis is 92100%, data are considered insufficient. Concerning bone metastasis, the sensitivity and specificity of PET are both 90%
or higher, but it is known to cause false negative results in osteoblastic bone metastases characteristic of breast and
prostate cancers. Although the diagnostic accuracy of adrenal metastasis is 100%, data are insufficient. Concerning lung
and pleural metastasis, since the uptake of small nodular lesions several mm in diameter is underestimated, confirmation
by diagnostic chest CT is necessary.
Index words and secondary materials used as references
PubMed, the Cochrane Library, and National Guideline Clearing House were searched for important papers with high
diagnostic and therapeutic evidence levels using “lung cancer”, “bronchogenic carcinoma”, “staging”, “PET”, “PET/
CT”, and “FDG” as key words.
38
The Japanese imaging guideline 2013
CQ 048
Left tracheal margin
#4R
#5
Superior
vena cava
Azygos vein
Left #4
Esophagus
Figure 2: Transverse PET/CT image
Descending aorta
Figure 1: The diagnosis of mediastinal lymph
nodes according to the General Rules for
Clinical and Pathological Recording of Lung
Cancer (reproduced with permission)
References
1) De Wever W et al: Integrated PET/CT in the staging of nonsmall cell lung cancer: technical aspects and clinical integration. Eur Respir J 33:
201-212, 2009 (Level 1)
2) Antoch G et al: Non-small cell lung cancer: dual -modality PET/CT in preoperative staging. Radiology 229: 526-533, 2003 (Level 3)
3) Lardinois D et al: Staging of non-small-cell lung cancer with integrated positron-emission tomography and computed tomography. N Engl J
Med 348: 2500-2507, 2003 (Level 3)
4) Silvestri GA et al: Noninvasive staging of non-small cell lung cancer: ACCP evidenced-based clinical practice guidelines, 2nd ed. Chest 132:
178S-201S, 2007 (Level 2)
5) Gould MK et al: Test performance of positron emission tomography and computed tomography for mediastinal staging in patients with nonsmall-cell lung cancer: a meta-analysis. Ann Intern Med 139: 879-892, 2003 (Level 1)
6) Fischer BM et al: Preoperative staging of lung cancer with combined PET-CT. N Engl J Med 361: 32-39, 2009 (Level 2)
7) van Tinteren H et al: Effectiveness of positron emission tomography in the preoperative assessment of patients with suspected non-small-cell
lung cancer: the PLUS multicentre randomised trial. Lancet 359: 1388-1393, 2002 (Level 1)
8) Fischer BM et al: Positron emission tomography in the diagnosis and staging of lung cancer: a systematic, quantitative review. Lancet Oncol 2:
659-666, 2001 (Level 1)
9) Kalff V et al: Clinical impact of (18) F fluorodeoxyglucose positron emission tomography in patients with non-small-cell lung cancer: a prospective study. J Clin Oncol 19: 111-118, 2001 (Level 3)
10) Pieterman RM et al: Preoperative staging of non-small-cell lung cancer with positron-emission tomography. N Engl J Med 343: 254-261, 2000
(Level 1)
11) Ung YC et al: 18Fluorodeoxyglucose positron emission tomography in the diagnosis and staging of lung cancer: a systematic review. J Natl
Cancer Inst 99: 1753-1767, 2007 (Level 1)
12) Tournoy KG et al: Integrated FDG-PET/CT does not make invasive staging of the intrathoracic lymph nodes in non-small cell lung cancer
redundant: a prospective study. Thorax 62: 696-701, 2007 (Level 2)
13) Herder GJ et al: Traditional versus up-front [18F] fluorodeoxyglucose-positron emission tomography staging of non-small-cell lung cancer: a
Dutch cooperative randomized study. J Clin Oncol 24: 1800-1806, 2006 (Level 2)
14) Lv YL et al: Diagnostic performance of integrated positron emission tomography/computed tomography for mediastinal lymph node staging in
non-small cell lung cancer: a bivariate systematic review and meta-analysis. J Thorac Oncol 6: 1350-1358, 2011 (Level 1)
15) Maziak DE et al: Positron emission tomography in staging early lung cancer: a randomized trial. Ann Intern Med 151: 221-228, 2009 (Level 1)
39
The Japanese imaging guideline 2013
04
Cardiovascular
region
1
The Japanese imaging guideline 2013
4. Cardiovascular region
49
What imaging modalities are appropriate for the
diagnosis of acute pulmonary thromboembolism?
Recommendation
grade
A
B
A Contrast-enhanced CT of the chest
B Pulmonary perfusion scintigraphy, lower extremity venous ultrasound, lower
extremity venous CT
CT is recommended as there is strong evidence supporting its usefulness. Pulmonary
perfusion scintigraphy is also useful and recommended. These examinations may
be performed alone or in combination. Lower extremity venous ultrasound or CT is
useful and recommended for the diagnosis of deep venous thrombosis.
Background/objective
To efficiently diagnose pulmonary thromboembolism, appropriate selection of examinations and evaluation of the
results are necessary. In Western countries, the diagnostic utility has been established on the basis of the results of
a number of studies,1-3) and the selection of examinations based on the clinical probability is recommended, but this
method has not been widely accepted in Japan.4) Here, the value of contrast-enhanced CT (of the chest, lower extremity),
pulmonary perfusion scintigraphy, and lower extremity venous ultrasound in the diagnostic procedure are evaluated.
Comments
Pulmonary thromboembolism requires prompt and accurate diagnosis because a delay of treatment may result in
aggravation of the condition and even death, but the selection of examinations and evaluation of the results differ
according to the patient’s condition (Figure 1).
If a patient suspected to have pulmonary thromboembolism exhibits a state of circulatory collapse, emergent CT should
be performed and treatment started after a definitive diagnosis. Other thoracic disorders that need to be differentiated
including aortic dissection and pericardial effusion can also be diagnosed. If emergent CT cannot be performed, right
heart strain is assessed by transthoracic echocardiography, and, if acute pulmonary thromboembolism is clinically
suspected, anticoagulant therapy is evaluated. In such situations, CT should be performed as early as possible to confirm
the diagnosis (Figure 2).
If the hemodynamic status is stable, the clinical probability should be evaluated according to the patient’s clinical
information. This evaluation is made by clinicians, but radiologists must also be informed of the results. The Wells
score5) is the best known evaluation method.
If the clinical probability is moderate or low, D dimers are assayed first. If the D dimer level is normal, pulmonary
thromboembolism can be excluded, and no further examination or treatment is necessary. If the D dimer level is higher
than the normal range, CT or, depending on the situation, pulmonary perfusion scintigraphy should be performed. If
both examinations are negative, no treatment is required.
If, on the other hand, the clinical probability is high, the D dimer level, associated with a low negative predictive
value, is not useful, so CT should be performed first, with pulmonary perfusion scintigraphy depending on the situation.
According to a multicenter progressive study reported in 2006 (prospective investigation of pulmonary embolism
diagnosis II: PIOPED II),6) the negative predictive value in this group was low at 60%, and additional examinations
(pulmonary perfusion scintigraphy, lower extremity venous ultrasound) should be considered, if the thrombus cannot be
confirmed by CT.
Which of CT and pulmonary perfusion scintigraphy should be used is controversial, but the greatest advantage of
CT is its high availability.7) Emergency pulmonary perfusion scintigraphy can be performed at few facilities. Also, CT
has many advantages such as that it can delineate the thrombus itself and that aortic, pulmonary, and thoracic lesions
can be diagnosed, so it is usually the first choice. However, while the exposure has been reduced in recent CT devices,
presently the exposure is lower by pulmonary perfusion scintigraphy.8) Therefore, pulmonary perfusion scintigraphy
should be considered in examination of young patients and for repeated follow-up examinations. Pulmonary perfusion
scintigraphy is recommended in patients with a history of adverse reactions to the contrast agent and those with renal
dysfunction. Also, as pulmonary perfusion scintigraphy shows a high negative predictive value, this less invasive
modality is recommended for patients with a low clinical probability and normal chest plain radiographs.
More than 90% of the thrombi that cause pulmonary thromboembolism are lower extremity venous thrombi, and the
evaluation of the lower extremity veins is necessary for the determination of the therapeutic approach including the
necessity of an inferior vena cava filter. Lower extremity venous ultrasound and CT venography, in which the pelvic
region and lower extremities are imaged in the delayed phase of pulmonary artery CT, are diagnostic methods for lower
2
The Japanese imaging guideline 2013
CQ 049
Circulatory collapse
Yes
No
Evaluation of clinical probability
Low/moderate
High
CT
D-dimer assay
Normal
Elevated
Negative
Acute pulmonary
thromboembolism
can be excluded
CT or pulmonary
perfusion
scintigraphy
Negative
Acute pulmonary
thromboembolism
can be excluded
Positive
CT or pulmonary
perfusion
scintigraphy
Negative
Positive
Treatment
Search for
other causes
Positive
Treatment
Treatment
Additional
examinations
(Modified from ref. 4)
Figure 1: Diagnostic procedure for patients suspected of having acute
pulmonary thromboembolism
Figure 2: Acute pulmonary
thromboembolism Contrastenhanced CT of the chest
Many unenhanced thrombi ( → ) are
observed in the bilateral pulmonary
arteries. Thrombi are imaged as if
they are floating in the pulmonary
artery characteristically in acute
pulmonary thromboembolism. The
right ventricle is dilated.
extremity venous thrombosis. In the PIOPED II,6) the sensitivity for the diagnosis of pulmonary thromboembolism was
reported to have improved from 82 to 90% by the inclusion of CT venography in the diagnostic procedure. However,
it must be remembered that the inclusion of CT venography significantly increases the exposure. Caution is needed,
particularly in young women. Since the diagnostic accuracy is considered comparable between lower extremity venous
ultrasound and CT venography, the former is more desirable if possible.1)
Index words and secondary materials used as references
A search of PubMed was performed using “pulmonary embolism”, “diagnosis”, and “guideline” as key words. The JCS
Joint Working Group: Guidelines for the diagnosis, treatment and prevention of pulmonary thromboembolism and deep
vein thrombosis 4) were also used as a reference.
References
1) Torbicki A et al: Guidelines on the diagnosis and management of acute pulmonary embolism: the task force for the diagnosis and management
of acute pulmonary embolism of the European Society of Cardiology (ESC). Eur Heart J 29: 2276-2315, 2008 (Level 5)
2) British Thoracic Society Standards of Care Committee Pulmonary Embolism Guideline Development Group: British Thoracic Society guidelines for the management of suspected acute pulmonary embolism. Thorax 58: 470-483, 2003 (Level 5)
3) American college of emergency physicians clinical policies subcommittee on critical issues in the evaluation and management of adult patients
presenting to the emergency department with suspected pulmonary embolism: critical issues in the evaluation and management of adult
patients presenting to the emergency department with suspected pulmonary embolism. Ann Emerg Med 57: 628-652, 2011 (Level 5)
4) JCS Joint Working Group: Guidelines for the diagnosis, treatment and prevention of pulmonary thromboembolism and deep vein thrombosis
(JCS 2009). Circ J 75: 1258-1281, 2011 (Level 5)
5) Wells PS et al: Derivation of a simple clinical model to categorize patients probability of pulmonary embolism: Increasing the models utility with
the SimpliRED D-dimer. Thromb Haemost 83: 416-420, 2000 (Level 2)
6) Stein PD et al: Multidetector computed tomography for acute pulmonary embolism. N Engl J Med: 354 2317-2327, 2006 (Level 3)
7) Bajc M et al: EANM guidelines for ventilation/perfusion scintigraphy: Part 2. Algorithms and clinical considerations for diagnosis of pulmonary
emboli with V/P (SPECT) and MDCT. Eur J Nucl Med Mol Imaging 36: 1528-1538, 2009 (Level 5)
8) Bajc M et al: EANM guidelines for ventilation/perfusion scintigraphy: Part 1. Pulmonary imaging with ventilation/perfusion single photon emission tomography. Eur J Nucl Med Mol Imaging 36: 1356-1370, 2009 (Level 5)
3
The Japanese imaging guideline 2013
4. Cardiovascular region
50
Is coronary artery (cardiac) contrast-enhanced CT
appropriate for the diagnosis of coronary artery
lesions?
Recommendation
grade
B
C1
C2
D
B
Patients suspected from clinical features to have ischemic heart disease
(intermediate-risk group on exercise ECG or when exercise ECG cannot be
performed), unstable angina/non-ST elevation myocardial infarction (intermediateand low-risk groups), evaluation of coronary artery anomalies, evaluation after
coronary artery bypass surgery, Kawasaki disease
C1 Follow-up after PCI, search for coronary artery lesions causing heart failure
C2 Asymptomatic high-risk patients
D ST-elevation acute myocardial infarction, general health screening
Contrast-enhanced CT is recommended for the items shown under B above as
there is evidence supporting its usefulness. It may be considered for the follow-up
after PCI and search for coronary artery lesions causing heart failure though the
evidence is insufficient. Contrast-enhanced CT is not recommended for asymptomatic
high-risk patients as there is no evidence for its usefulness. In ST-elevation acute
myocardial infarction, a catheterization study should be immediately performed, and
coronary artery CTA is not recommended. Also, contrast-enhanced CT should not
be performed for general health screening because the risk of exposure and adverse
effect of the contrast agent is considered to outweigh the benefit.
Background/objective
With the advent of multislice CT, non-invasive imaging of the coronary artery has become possible. Coronary CTA
using a 16-slice CT device has been clinically applied, and 64-slice CT scan is rapidly propagating as a routine clinical
examination. Coronary artery CT can provide information useful for the evaluation of the anatomical arrangement of
the coronary artery, diagnosis of coronary artery stenosis, and examination of the coronary artery wall. Particularly,
concerning its diagnostic accuracy of 64-slice CT for coronary artery stenosis, the sensitivity has been reported to
exceed 95% (Figure), and the negative predictive value to be high at about 97-99%.1,2) There is a report that the negative
predictive value is relatively low when the prevalence is high,3) but the modality is generally considered useful for the
exclusion of stenosis. However, coronary arteriography is the gold standard for the evaluation of coronary artery lesions.
Therefore, it is necessary to clarify situations in which coronary CTA is effective.
Comments
Recommendation grade B
1) When ischemic heart disease is suspected from clinical features (intermediate-risk group on exercise ECG or
when exercise ECG cannot be performed)
Patients suspected to have ischemic heart disease are stratified according to age, gender, symptoms, and risk factors
(systolic blood pressure, smoking habit, total cholesterol level, presence or absence of diabetes mellitus), and exercise
ECG is recommended for those considered to be at intermediate risk. If the risk is estimated to be intermediate on
exercise ECG, or if exercise ECG cannot be performed, coronary CTA is recommended (Grade B).7,8) If the risk is
judged to be high on exercise ECG, coronary arteriography is recommended.
2) Unstable angina/non-ST-elevation myocardial infarction (intermediate- and low-risk groups)
The risk of ACS is stratified according to clinical information such as age and gender, clinical history, new changes on
ECG, findings on blood chemistry tests (myocardial injury markers such as troponin), etc. For the intermediate- or lowrisk group, coronary CTA, which is useful for the early diagnosis or exclusion diagnosis, is recommended.9-11)
3) Evaluation of coronary artery anomalies
In congenial coronary artery anomalies, information concerning the presence or absence and location of abnormal
vessels and their spatial relationships with the aorta or pulmonary artery is important, and they can be assessed
accurately by coronary CT as well as coronary arteriography. Therefore, CT is strongly recommended for the evaluation
of coronary artery anomalies.4-6) However, efforts to reduce the radiation exposure are necessary for pediatric and young
patients, and coronary MRA should be considered as an alternative if motion artifacts due to high heart rate/breathing at
rest are expected.
4) Evaluation after coronary artery bypass surgery
In the evaluation after coronary artery bypass surgery, the use of a non-invasive examination such as coronary CTA for
the assessment of the graft and its anastomotic regions and search for new coronary artery lesions is considered greatly
beneficial to patients and is recommended.12,13)
5) Kawasaki disease
In Kawasaki disease, echocardiography is performed as the first imaging modality, but coronary CTA is excellent
4
The Japanese imaging guideline 2013
CQ 050
A
B
Figure: Coronary artery stenosis
Coronary CT (A) shows stenoses in the left anterior descending and diagonal branches. The
findings are in close agreement with angiographic findings (B).
in delineating the total picture of coronary artery lesions including aneurysms, stenotic lesions, wall calcification,
and collaterals. In children, who are sensitive to exposure, coronary MRI is more desirable if they are examined
repeatedly.14,15)
Recommendation grade C1
1) Follow-up after PCI
Evaluation is often possible if the stent diameter is 3 mm or greater. However, stents with a diameter of less than 3
mm are not indications of contrast-enhanced CT because of a low diagnostic accuracy. Therefore, the use of CT for the
evaluation of stent patency is considerably limited at present.16,17) Particularly, if the condition is symptomatic, the
significance of CT is not high. However, CT is recommended for asymptomatic patients with stents 3 mm or greater in
diameter placed in the main left coronary artery (Grade B).
2) Search for coronary artery lesions causing heart failure
While reports on the effectiveness of coronary CTA in heart failure patients are scarce, the significance of non-invasive
examination of coronary artery lesions is large, and the clinical usefulness of the modality is considered high. However,
since the delineability of the coronary artery is often reduced in heart failure patients, and since the administration of a
contrast agent at a large dose causes a volume load, sufficient caution is necessary.
Recommendation grade C2
Asymptomatic high-risk patients
Presently, there is no evidence supporting the effectiveness of contrast-enhanced CTA in asymptomatic highrisk patients such as those with diabetes mellitus. Usefulness exceeding the risk of radiation exposure and contrast
nephropathy has not been demonstrated. Moreover, the evaluation of the coronary artery is difficult in patients
with marked calcification. However, the calcification score is a simple examination and is reportedly effective in
asymptomatic high-risk patients aged 40 years and above. In Japan, however, there have been few studies using the
calcification score, and the evaluation of whether or not databases in Western countries can be directly applied to
Japanese also remains insufficient.
Recommendation grade D
1) Unstable angina/non-ST-elevation myocardial infarction
If the possibility of acute myocardial infarction is considered high, the patient is admitted to the ICU, and priority is
given to prompt revascularization surgery by coronary arteriography.
2) ST-elevation acute myocardial infarction
As invasive reperfusion therapy has been established as a treatment in the acute stage of ST-elevation acute myocardial
infarction, more prompt diagnosis is necessary. Since the diagnosis is confirmed by ECG and echocardiography, and
coronary arteriography is performed, there is no indication for coronary CTA in general.
3) General health screening
The effectiveness of the use of coronary CTA for general health screening has not been demonstrated. Coronary CT
should not be performed at random in low-risk patients despite the risk of radiation exposure and the use of a contrast
agent. In consideration of the balance between the benefit and cost of the examination, there is no ground for its
introduction to general health screening.
5
The Japanese imaging guideline 2013
4. Cardiovascular region
Index words and secondary materials used as references
A search of PubMed was performed using “coronary computed tomography”, “64”, “multislice computed
tomography”, “angiography”, “coronary anomalous artery”, “coronary artery bypass graft”, “in-stent restenosis”,
“diagnostic accuracy”, and “meta-analysis” as key words. The Japanese Circulation Society eds: Guidelines for the
Diagnosis and Treatment of Cardiovascular Diseases (2007-2008 report by the Joint Research Group). Guidelines
for Non-invasive Diagnosis of Coronary Artery Lesions, 2009 edition, European Society of Cardiology Guidelines
(Cardiac computed tomography: indications, applications, limitations, and training requirements. Eur Heart J 29: 531556, 2008), and American Heart Association Guidelines (ACCF/SCCT/ACR/AHA/ASE/ ASNC/NASCI/SCAI/SCMR
2010 Appropriate Use Criteria for Cardiac Computed Tomography. Circulation 23: 525-555, 2010) were also used as
references.
References
1) Budoff MJ et al: Diagnostic performance of 64-multidetector row coronary computed tomographic angiography for evaluation of coronary artery
stenosis in individuals without known coronary artery disease: results from the prospective multicenter ACCURACY (Assessment by Coronary
Computed Tomographic Angiography of Individuals Undergoing Invasive Coronary Angiography) trial. J Am Coll Cardiol 52: 1724-1732, 2008
(Level 2)
2) Meijboom WB et al: Diagnostic accuracy of 64-slice computed tomography coronary angiography: a prospective, multicenter, multivendor
study. J Am Coll Cardiol 52: 2135-2144, 2008 (Level 2)
3) Miller JM et al: Diagnostic performance of coronary angiography by 64-row CT. N Engl J Med 359: 2324-2336, 2008 (Level 2)
4) Shi H et al: Multislice CT imaging of anomalous coronary arteries. Eur Radiol 14: 2172-2181, 2004 (Level 3)
5) Datta J et al: Anomalous coronary arteries in adults: depiction at multi-detector row CT angiography. Radiology 235: 812-818, 2005 (Level 3)
6) Schmid M et al: Visualization of coronary artery anomalies by contrast-enhanced multi-detector row spiral computed tomography. Int J Cardiol
111: 430-435, 2006 (Level 3)
7) Meijboom WB et al: 64-slice computed tomography coronary angiography in patients with high, intermediate, or low pretest probability of significant coronary artery disease. J Am Coll Cardiol 50: 1469-1475, 2007 (Level 3)
8) Leber AW et al: Diagnostic accuracy of dual-source multi-slice CT-coronary angiography in patients with an intermediate pretest likelihood for
coronary artery disease. Eur Heart J 28: 2354-2360, 2007 (Level 3)
9) Berman DS et al: Roles of nuclear cardiology, cardiac computed tomography, and cardiac magnetic resonance: Noninvasive risk stratification
and a conceptual framework for the selection of noninvasive imaging tests in patients with known or suspected coronary artery disease. J Nucl
Med 47: 1107-1118, 2006 (No applicable level)
10) Hoffmann U et al: Coronary multidetector computed tomography in the assessment of patients with acute chest pain. Circulation 114: 22512260, 2006 (Level 2)
11) Nasis A et al: Acute chest pain investigation: utility of cardiac CT angiography in guiding troponin measurement. Radiology 260: 381-389, 2011
(Level 3)
12) Rubinshtein R et al: Usefulness of 64-slice cardiac computed tomographic angiography for diagnosing acute coronary syndromes and predicting clinical outcome in emergency department patients with chest pain of uncertain origin. Circulation 115: 1762-1768, 2007 (Level 2)
13) Hamon M et al: Diagnostic performance of 16- and 64-section spiral CT for coronary artery bypass graft assessment: meta-analysis. Radiology
247: 679-686, 2008 (Level 1)
14) Jones CM et al: Multi-detector computed tomography in coronary artery bypass graft assessment: a meta-analysis. Ann Thorac Surg 83: 341348, 2007 (Level 1)
15) Sato Y et al: Detection of coronary artery aneurysms, stenoses and occlusions by multislice spiral computed tomography in adolescents with
Kawasaki disease. Circ J 67: 427-430, 2003 (Level 4)
16) Arnold R et al: Visualization of coronary arteries in patients after childhood Kawasaki syndrome: value of multidetector CT and MR imaging in
comparison to conventional coronary catheterization. Pediatr Radiol 37: 998-1006, 2007 (Level 3)
17) Sun Z, Almutairi AM: Diagnostic accuracy of 64 multislice CT angiography in the assessment of coronary in-stent restenosis: a meta-analysis.
Eur J Radiol 73: 266-273, 2010 (Level 1)
18) Vanhoenacker PK et al: Multidetector computed tomography angiography for assessment of in-stent restenosis: meta-analysis of diagnostic
performance. BMC Med Imaging 8: 14, 2008 (Level 1)
6
The Japanese imaging guideline 2013
CQ 051
51
Is radionuclide scanning appropriate for the
diagnosis of ischemic heart disease?
Recommendation
grade
B
Radionuclide scanning is recommended as there is evidence supporting its
usefulness for the selection of treatment, stratification of risks, and prognosis in
patients with moderate possibility of coronary artery disease and risk of cardiac
events.
Background/objective
In cardiac imaging diagnosis, multislice CT and MRI have made remarkable improvements. With increasing
diversification of modalities, the role and usefulness of radionuclide scanning of the heart are evaluated.
Comments
Evaluation was made by dividing ischemic heart disease into acute coronary syndrome and chronic coronary artery
disease.
Regarding acute coronary syndrome, myocardial perfusion imaging at rest using 99mTc-labeled perfusion agent,
which can be prepared in the hospital, has been reported to be useful for the determination of whether or not a patient
who has visited with a primary symptom of chest pain should be admitted to the CCU.1) In patients clinically diagnosed
with acute myocardial infarction based on findings including elevations of cardiac enzyme levels, the infarct size can
be estimated from the degree and extent of blood flow decreases by acute-phase myocardial perfusion imaging.2) The
modality is also used for the assessment of the effectiveness of various treatments for acute myocardial infarction, and
the estimation of the left ventricular end-diastolic volume in the chronic phase has been reported to be possible from
acute-phase SPECT fingings.3) Also, on long-term follow-up of patients after acute myocardial infarction, the incidence
of cardiac events and life outcome are related to rest perfusion SPECT findings in the acute phase,4) and the modality is
suggested to be useful for the prognosis. In Japan, 123I-BMIPP imaging, which reflects myocardial fatty acid metabolism,
is clinically applied. The diagnostic accuracy of 123I-BMIPP SPECT is comparable to that of myocardial perfusion
imaging for ST-elevation myocardial infarction but is superior for non-ST-elevation myocardial infarction and unstable
angina pectoris (Figure 1).5,6) In addition, the diagnostic value of BMIPP imaging for stunned myocardium showing
transient hypokinesis is high. In stunned myocardium, the myocardium is viable, but fatty acid metabolism is impaired,
so the condition is detected by dissociation between the blood flow and metabolism. Since fatty acid accumulation
is resolved with recovery of wall motion in a course of several weeks to a few months, improvements in the cardiac
function can also be predicted.7)
The assessment of the severity and risk of chronic coronary artery disease is indispensable for the selection of
treatments, as the basis for the selection of invasive treatments, and for the prognosis. Patients with moderate
possibility of coronary artery disease or risk of cardiac events are the best candidates for radionuclide scanning. If the
risk is known to be high or low from other clinical findings and non-invasive examinations, the value of radionuclide
scanning performed for risk stratification is low. However, in high-risk patients, radionuclide scanning of the heart is
recommended as a means for selective application of coronary arteriography from the cost-performance viewpoint.8)
Stress myocardial perfusion SPECT is performed basically for functional imaging to evaluate impairment of the
coronary perfusion reserve including the endothelial function during stressing and associated abnormalities of
blood flow distribution on the myocardial cell level (Figure 2). Therefore, the findings do not necessarily reflect the
anatomical severity of coronary artery stenosis or predict collapse of an unstable plaque that may occur in the near
future. Rest myocardial perfusion scan is performed to evaluate the presence or absence of complicating infarction and
volume of infarcted myocardium, and stress myocardial perfusion scan is performed to evaluate the myocardial volume
with, and severity of, reversible ischemia. Many clinical studies have demonstrated that these parameters are excellent
predictive factors of cardiac events (myocardial infarction, cardiac death) and the necessity of coronary revascularization
procedures (CABG, PCI).9)
Index words and secondary materials used as references
PubMed was searched using ischemic heart disease, myocardial SPECT, humans, and English as key words. Klocke FJ
et al. ed: AHA/ACC/ASNC guidelines for the clinical use of cardiac radionuclide imaging (ACC 2004) and the Japanese
Circulation Society et al. eds: Guidelines for Clinical Use of Cardiac Nuclear Medicine, 2010 edition (JCS 2010) were
also used as references.
7
The Japanese imaging guideline 2013
4. Cardiovascular region
Tc-sestamibi
I-BMIPP
99m
123
Smart axis views
Tc-sestamibi
I-BMIPP
99m
123
Vertical long axis views
Figure 1: 123I-BMIPP myocardial SPECT of non-ST-elevation myocardial infarction
In this patient with non-ST-elevation myocardial infarction of the anterior wall, no clear decrease in
accumulation is noted on myocardial perfusion SPECT using 99mTc-sestamibi, but reduced fatty acid
metabolism extending from the anterior wall to the apex ( → ) is clearly visualized by 123I-BMIPP myocardial
SPECT.
Left
circumflex
branch
Left anterior
descending branch
Figure 2: Evaluation of myocardial ischemia using
fused images of stress myocardial perfusion
SPECT and coronary CT
Coronary CT shows marked stenosis in many branches,
but fusion with stress myocardial perfusion SPECT images
allows the identification of the vessel responsible for
ischemia with the intermediate branch.
Intermediate
branch
Diagonal
branch
References
1) Heller GV et al: Clinical value of acute rest technetium-99m tetrofosmin tomographic myocardial perfusion imaging in patients with acute chest
pain and nondiagnostic electrocardiograms. J Am Coll Cardiol 31: 1011-1017, 1998 (Level 2)
2) Christian TF et al: Determinants of infarct size in reperfusion therapy for acute myocardial infarction. Circulation 86: 81-90, 1992 (Level 2)
3) Choi JY et al: Prediction of left ventricular dilatation with thallium-201 SPET imaging after primary angioplasty in patients with acute myocardial
infarction. Eur J Nucl Med Mol Imaging 29: 728-734, 2002 (Level 3)
4) Suzuki A et al: Prognostic implications of cardiac scintigraphic parameters obtained in the early phase of acute myocardial infarction. Clin
Cardiol 11: 370-376, 1988 (Level 3)
5) Fukushima Y et al: Usefulness of 201TlCl/123I-BMIPP dual-myocardial SPECT for patients with non-ST segment elevation myocardial infarction. Ann Nucl Med 22: 363-369, 2008 (Level 3)
6) Takeishi Y et al: Lodine-123-BMIPP imaging in unstable angina: a guide for interventional strategy. J Nucl Med 38: 1407-1411, 1997 (Level 3)
7) Hashimoto A et al: Postischemic functional recovery and BMIPP uptake after primary percutaneous transluminal coronary angioplasty in acute
myocardial infarction. Am J Cardiol 77: 25-30, 1996 (Level 3)
8) Mowatt G et al: Systematic review of the prognostic effectiveness of SPECT myocardial perfusion scintigraphy in patients with suspected or
known coronary artery disease and following myocardial infarction. Nucl Med Commun 26: 217-229, 2005 (Level 2)
9) Hachamovitch R et al: Incremental prognostic value of myocardial perfusion single photon emission computed tomography for the prediction of
cardiac death: differential stratification for risk of cardiac death and myocardial infarction. Circulation 97: 535-543, 1998 (Level 2)
8
The Japanese imaging guideline 2013
CQ 052
52
Is MRI appropriate for the diagnosis of ischemic heart
disease?
Recommendation
grade
B
C1
B Delayed contrast-enhanced MRI, stress myocardial perfusion MRI
C1 Coronary MRA
For the diagnosis of ischemia/infarction in patients with stable angina and old
myocardial infarction among ischemic heart diseases, delayed contrast-enhanced
MRI and stress myocardial perfusion MRI are recommended, as there is evidence
suggesting that their diagnostic performance is comparable with that of radionuclide
imaging of the heart. Coronary MRA, which can be performed without radiation
exposure or a contrast agent, is worth considering in young patients, patients with
renal insufficiency, and those with severe coronary artery calcification.
Background/objective
For the diagnosis of ischemic heart disease by cardiac MRI, myocardial ischemia is evaluated by stress myocardial
perfusion MRI, myocardial infarction is evaluated by delayed contrast-enhanced MRI, and coronary artery stenosis is
evaluated by coronary MRA. Since cardiac MRI is rarely used today as an emergency examination for the diagnosis of
acute coronary syndrome, the usefulness of cardiac MRI for the diagnosis of stable angina pectoris and old myocardial
infarction among ischemic heart diseases is evaluated in this section.
Comments
Delayed contrast-enhanced MRI is used for diagnosing myocardial infarction by MRI. The modality has higher
resolution than radionuclide imaging and can explicitly diagnose subendocardial infarction and right ventricular
infarction, which cannot be detected by SPECT imaging (Figure).1) The modality is also useful for the assessment of
the myocardial viability in patients after myocardial infarction and allows the estimation of the possibility of functional
recovery from the extent of infarcted myocardium from the endocardial to epicardial side.2) Also, in a study following
up the outcomes of patents suspected to have ischemic heart disease by delayed contrast-enhanced MRI, the presence or
absence of delayed contrast enhancement has been shown to be highly useful for the prediction of cardiac death or major
cardiac accidents,3) and the significance of risk assessment by delayed contrast-enhanced MRI is high, particularly, in
groups with a high prevalence of coronary artery disease such as diabetic patients.4)
In patients with angina pectoris, the objective of coronary artery stenting and bypass grafting is to resolve myocardial
ischemia caused by stenosis, but the degree of morphological narrowing determined by coronary arteriography or
coronary CT is not necessarily in agreement with the degree of mechanical narrowing, and the evaluation of the
presence or absence and extent of myocardial ischemia is important to improve the outcome. There have already been a
number of single institutional studies on the diagnostic performance of stress myocardial perfusion MRI in patients with
coronary stenosis, and meta-analysis of 1,516 patients reported a high diagnostic performance with a sensitivity of 91%
and a specificity of 81%.5) Also, according to a meta-analysis concerning the diagnostic abilities of myocardial perfusion
SPECT, MRI, and PET, their sensitivities were 88, 89, and 84%, and specificities were 61, 76, and 81%, respectively,
indicating that the diagnostic power of MRI without exposure is close to that of PET.6) Whether or not functionally
significant coronary stenosis causing ischemia is an indication of coronary artery stenting can be judged by measuring
the fractional flow reserve. The diagnostic sensitivity and specificity of stress myocardial perfusion MRI for functionally
significant stenotic lesions with an FFR of <0.75 are reported to be 82-91 and 91-94%, respectively, and the modality
also contributes to the evaluation of treatment indications.7,8)
While coronary MRA has characteristics such as no radiation exposure, no need for the administration of a contrast
agent, and no effect by marked coronary artery calcification, it has weaknesses such as lower spatial resolution
compared with CT, long imaging time requiring 5-10 minutes, and limitation of facilities equipped with the modality.
The sensitivity and specificity of coronary MRA were 88 and 72% in multicenter study using a 5-channel coil8) and 87
and 86%, respectively, in a single-facility study single institutional research using a 32-channel coil,9) and the modality
is considered to be effective for the diagnosis of coronary stenosis in patients with renal failure and those with marked
coronary artery calcification.
As cardiac MRI, cine MRI, stress myocardial perfusion MRI, delayed contrast-enhanced MRI, and coronary MRA are
performed as a series of examinations, by which the cardiac function, ischemia, infarction, and coronary artery stenosis
can be comprehensively evaluated. The results of a recent randomized controlled trial have indicated that the diagnostic
ability of such comprehensive cardiac MRI is significantly higher than that of SPECT.10)
9
The Japanese imaging guideline 2013
4. Cardiovascular region
A
B
Figure: Delayed contrast-enhanced MRI
A Anterior subendocardial infarction ( → ) B Transmural anteroseptal infarction ( → )
Index words and secondary materials used as references
A search of PubMed was performed using “coronary artery disease”, “magnetic resonance”, “sensitivity”, and
“specificity” as key words. The Joint Working Group on Guidelines for Diagnosis and Treatment of Cardiovascular
Diseases ed: Guidelines for Noninvasive Diagnosis of Coronary Artery Lesions (JCS2009) was also used as a reference.
References
1) Wagner A: Contrast-enhanced MRI and Routine Single Photon Emission Computed Tomography (SPECT) perfusion imaging for detecting of
subendocardial myocardial Infarcts: an imaging study. Lancet 361: 374-379, 2003 (Level 2)
2) Kim RJ: The use of contrast-enhanced magnetic resonance imaging to identify reversible myocardial dysfunction. N Engl J Med 343: 14451453, 2000 (Level 2)
3) Kwong RY: Impact of unrecognized myocardial scar detected by cardiac magnetic resonance imaging on event-free survival in patients presenting with signs or symptoms of coronary artery disease. Circulation 113: 2733-2743, 2006 (Level 2)
4) Kwong RY: Incidence and prognostic implication of unrecognized myocardial scar characterized by cardiac magnetic resonance in diabetic
patients without clinical evidence of myocardial infarction. Circulation 118: 1011-1020, 2008 (Level 2)
5) Nandalur KR: Diagnostic performance of stress cardiac magnetic resonance imaging in the detection of coronary artery disease: a metaanalysis. J Am Coll Cardiol 50: 1343-1353, 2007 (Level 1)
6) Jaarsma C: Diagnostic performance of noninvasive myocardial perfusion imaging using single-photon emission computed tomography, cardiac
magnetic resonance, and positron emission tomography imaging for the detection of obstructive coronary artery disease: a meta-analysis. J
Am Coll Cardiol 59: 1719-1728, 2012 (Level 1)
7) Watkins S: Validation of magnetic resonance myocardial perfusion imaging with fractional flow reserve for the detection of significant coronary
heart disease. Circulation 120: 2207-2213, 2009 (Level 2)
8) Lockie T: High-resolution magnetic resonance myocardial perfusion imaging at 3.0-Tesla to detect hemodynamically significant coronary stenoses as determined by fractional flow reserve. J Am Coll Cardiol 57: 70-75, 2011 (Level 2)
9) Kato S: Assessment of coronary artery disease using magnetic resonance coronary angiography: a national multicenter trial. J Am Coll Cardiol
56: 983-991, 2010 (Level 2)
10) Greenwood JP: Cardiovascular magnetic resonance and single-photon emission computed tomography for diagnosis of coronary heart disease (CE-MARC): a prospective trial. Lancet 379: 453-460, 2012 (Level 2)
10
The Japanese imaging guideline 2013
CQ 053
53
Are MRI and CT appropriate for the diagnosis of
nonischemic cardiomyopathy?
Recommendation
grade
B
C1
B MRI
C1 CT
Contrast-enhanced MRI is useful for the diagnosis of nonischemic cardiomyopathy
and is recommended. If MRI cannot be performed, CT is also useful in some
situations and is worth considering.
Background/objective
Nonischemic cardiomyopathy is a general term for myocardial disorders that exhibit abnormal thickening or thinning
of the cardiac wall and cause mechanical or electric functional impairment. It includes hypertrophic cardiomyopathy,
dilated cardiomyopathy, amyloidosis, and sarcoidosis. Nonischemic cardiomyopathy is known to cause serious cardiac
events such as arrhythmia and sudden death. Whether or not MRI and CT are effective for its diagnosis is evaluated.
Comments
Nonischemic cardiomyopathy accounts for about 1/3 of the causes of heart failure, is associated with the risk of
sudden death, and has a poor prognosis. While implantable cardioverter defibrillators have been shown to be effective
for preventing sudden death, the cost and risk of complications must also be considered. Therefore, the diagnosis of
nonischemic cardiomyopathy and risk stratification are important to implement early therapeutic intervention and
improve the prognosis and QOL.
In nonischemic heart disease, fibrosis of the myocardium occurs, causing a decrease in compliance, diastolic
dysfunction, and atrial overload. Also, myocardial fibrosis causes conduction disorders, and consequent severe
arrhythmia or tachycardia induces heart failure. Therefore, non-invasive evaluation of the cardiac function and
myocardial fibrosis is considered important.
Cardiac MRI is not only a standard tool for the assessment of the ventricular volume and function but also visualizes
fibrosis of the cardiac wall with high contrast resolution due to late gadolinium enhancement (LGE). Nonischemic and
ischemic cardiomyopathies can be discriminated on the basis of difference in the distribution of fibrosis, which has also
been reported to vary among nonischemic cardiomyopathies (Figures 1, 2).1,2) The Consensus Panel report approved by
the Society of Cardiovascular Magnetic Resonance and the Cardiovascular Magnetic Resonance Working Group of the
European Society of Cardiology also regarded cardiac MRI as appropriate and useful for the evaluation of nonischemic
cardiomyopathy.3) Wu et al. performed a prospective cohort study in patients with nonischemic cardiomyopathy with a
left ventricular ejection fraction of <35% and reported that LGE was observed in 42% of the patients and that the risk
of cardiac events was about 8-fold higher in those with than without LGE.4) According to a cross-sectional study by
Adabag et al., the risk of ventricular tachycardia was about 7-fold higher in those showing LGE among patients with
hypertrophic cardiomyopathy, which is a typical nonischemic cardiomyopathy.5) Thus, cardiac MRI, which provides
information important for the diagnosis and risk assessment of nonischemic cardiomyopathy, is recommended for its
diagnosis.
Cardiac CT has a high diagnostic ability for coronary artery disease, and retrospective ECG gating makes accurate
evaluation of the cardiac function possible. However, the use of the modality for the assessment of myocardial fibrosis
has been limited primarily to case reports, and its usefulness has not been established.6,7)
Index words and secondary materials used as references
A search of PubMed was performed using “nonischemic cardiomyopathy” and “computed tomography” as key words
for CT and “nonischemic cardiomyopathy”, “magnetic resonance imaging”, and “fibrosis” as key words for MRI. The
Consensus Panel report approved by the SCMR/ESC-CMR Working Group and the ACCF/SCCT/ACR/AHA/ASE/
ASNC/NASCI/SCAI/SCMR 2010 Appropriate Use Criteria for Cardiac Computed Tomography were also used as
references.
11
The Japanese imaging guideline 2013
4. Cardiovascular region
Figure 1: Hypertrophic cardiomyopathy
In this patient with hypertrophic cardiomyopathy,
LGE is noted at the junction of the anterior
septum, showing asymmetric thickening, with
the right ventricle ( → ).
Figure 2: Dilated cardiomyopathy
In dilated cardiomyopathy, the cardiac wall is
thinned, and linear LGE is noted primarily in the
intermediate layer from the anterior wall to the
septum ( → ).
References
1) Vogel-Claussen J et al: Delayed enhancement MR imaging: utility in myocardial assessment. Radiographics 26: 795-810, 2006 (Level 4)
2) O’Donnell DH et al: Cardiac MR imaging of nonischemic cardiomyopathies: imaging protocols and spectra of appearances. Radiology 262:
403-422, 2012 (Level 4)
3) Pennell DJ et al: Clinical indications for cardiovascular magnetic resonance (CMR): consensus panel report. Eur Heart J 25: 1940-1965, 2004
(Level 5)
4) Wu KC et al: Late gadolinium enhancement by cardiovascular magnetic resonance heralds an adverse prognosis in nonischemic cardiomyopathy. J Am Coll Cardiol 51: 2414-2421, 2008 (Level 2)
5) Adabag AS et al: Occurrence and frequency of arrhythmias in hypertrophic cardiomyopathy in relation to delayed enhancement on cardiovascular magnetic resonance. J Am Coll Cardiol 51: 1369-1374, 2008 (Level 3)
6) Taylor AJ et al: ACCF/SCCT/ACR/AHA/ASE/ASNC/NASCI/SCAI/SCMR 2010 Appropriate Use Criteria for Cardiac Computed Tomography.
A Report of the American College of Cardiology Foundation Appropriate Use Criteria Task Force, the Society of Cardiovascular Computed
Tomography, the American College of Radiology, the American Heart Association, the American Society of Echocardiography, the American
Society of Nuclear Cardiology, the North American Society for Cardiovascular Imaging, the Society for Cardiovascular Angiography and
Interventions, and the Society for Cardiovascular Magnetic Resonance. J Cardiovasc Comput Tomogr 407: e1-33, 2010 (Level 5)
7) Kanao S et al: Demonstration of cardiac involvement of sarcoidosis by contrast-enhanced multislice computed tomography and delayedenhanced magnetic resonance imaging. J Comput Assist Tomogr 29: 745-748, 2005 (Level 4)
12
The Japanese imaging guideline 2013
CQ 054
54
Are CT and MRI appropriate for the diagnosis of
aortic aneurysms?
Recommendation
grade
A
B
C1
A Contrast-enhanced CT
B Contrast-enhanced MRI
C1 Unenhanced MRA
Contrast-enhanced CT and contrast-enhanced CTA by 3D/MPR using CT data
are recommended for the initial diagnosis of thoracic/abdominal aneurysms and
their follow-up studies, because there is strong evidence of their usefulness. For
patients with allergy to iodine-based contrast agents, contrast-enhanced MRA
is recommended as there is evidence of its usefulness. In patients with renal
dysfunction, unenhanced MRA is a useful alternative for contrast-enhanced CTA is
worth considering while evidence of its usefulness is insufficient.
Background/objective
Ten years have passed since the clinical introduction of MDCT, and CTA has established a firm position as the first
choice for imaging study of the aorta. However, MRA has also shown unique development while it is inferior to
CTA in resolution and simplicity. Particularly, by unenhanced MRA, blood vessels can be evaluated without using a
contrast agent. In this section, indications of CT/MRI for the diagnosis of aortic aneurysms, selection between the two
modalities, and evaluation items for their diagnosis are discussed.
Comments
1) Roles of CT/MRI in the evaluation of aortic aneurysms
An aortic aneurysm is “a circumferential or local dilation of part of the aortic wall”, and a dilation of the aorta (fusiform
dilatation) to more than 1.5 times its normal diameter (4.5 cm in the thoracic region, 3 cm in the abdominal region) is
called an “aneurysm”. There are 3 major tasks for vascular imaging of aortic aneurysms. The first task is to diagnose
acute aortic disorders. The differentiation of aortic aneurysm from other acute aortic disorders (aortic dissection with
patent/closed false lumen, acute aortic syndrome such as penetrating atherosclerotic ulcer) and exclusion of non-aortic
disorders such as pulmonary thromboembolism are very significant for the determination of the therapeutic approach.1)
After a diagnosis of aortic aneurysm has been made, the second important task is to estimate the risk of rupture by
follow-up. Follow-up monitoring of the aortic diameter is made by measuring the short diameter at the widest part of
the aneurysm (maximum short diameter). In thoracic aortic aneurysms, the risk of rupture is high when the aneurysmal
diameter (external diameter) exceeds 55 mm, and surgical treatment must be considered.2) In female patients, there is
the risk of rupture even in smaller aneurysms, and surgery should be evaluated for lesions 45-50 mm in diameter.3) Also,
even if the diameter is 55 mm or less, the risk of rupture is high when the annual enlargement rate is greater than 5
mm/year.1,4) On the follow-up of thoracic aortic aneurysms, lesions 50 mm or greater in diameter are examined every 6
months, but those less than 50 mm in diameter are initially examined after 6 months and at 1-year intervals thereafter.1,5)
Concerning abdominal aortic aneurysms, the annual risk of rupture is correlated with the diameter, being 0.3% for those
less than 40 mm, 1.5% for those 40-49 mm, 6.5% for those 50-59 mm, and increasing rapidly as the diameter exceeds
60 mm.6) Abdominal aortic aneurysms 40 mm or less in diameter are followed up initially after 6 months and at 1-year
intervals thereafter if there is no change, but those 40-50 mm in diameter are followed up every 6 months.1,5) Screening
of a healthy population for asymptomatic aortic aneurysm using an imaging modality is not recommended as there is no
report indicating its effectiveness.5,7)
Recently, with the addition of stent grafting as a new therapeutic option to conventional surgical treatment, early
treatment for smaller lesions has begun to be considered, and pre-treatment quantitative measurement planning has been
given to CTA/MRA as a third new task.8,9)
2) Selection of CTA/MRA
The selection between CTA and MRA is related to patient factors including the general condition, renal function, and
allergy to the contrast agent and the facility factor, i.e., the accessibility to the modalities at each facility.
Ten years after the clinical introduction of MDCT, the modality has been firmly established as the first choice
examination due to its high diagnostic power, short imaging time, wide scanning field, and versatility (Figures 1, 2).1,7,10)
Recently, ECG-gated CTA, which is in wide clinical use in the cardiac region, has also been applied to the thoracic
region, and it has been suggested to be useful, particularly, for the examination of lesions in the ascending aorta.11) In
patients with renal dysfunction, the risk of contrast-induced nephropathy poses a problem, but unnecessary reserve of
13
The Japanese imaging guideline 2013
4. Cardiovascular region
A
Figure 1: Infrarenal abdominal aortic
aneurysm (AAA)
CT angiographic image reconstructed
by volume rendering. Marked dilation
(maximum short diameter: 45 mm) is
observed from below the division of the
renal artery to the aortic bifurcation.
B
Figure 2: Descending/thoracoabdominal aortic aneurysms
(TAAA)
MPR sagittal (A) and volume-rendering reconstructed (B) images of
CT angiography. Dilations of the aorta (maximum short diameters:
43 and 50 mm) are observed to the descending aorta and
thoracoabdominal junction.
an essential examination due to excessive anxiety should be avoided. The occurrence of contrast-induced nephropathy
can be anticipated to an extent from the presence or absence of underlying diseases, presence or absence of the use
of a nephrotoxic preparation, and the value of eGFR. The judgment of whether or not contrast enhancement can be
tolerated should be made, and, if it is judged to be tolerated, contrast-enhanced imaging should be performed with
appropriate preventive measures such as temporary suspension of fluid or drug administration and a decrease in the dose
of the contrast agent.12) For the follow-up of aortic aneurysms using CT, contrast-enhanced imaging is preferable, but
monitoring of the arterial diameter by non-contrast-enhanced CT occasionally suffices.
MRA is slightly inferior to CTA in resolution and simplicity but has made unique development toward high-speed
and high-resolution imaging with improvements in the equipment. MRA of the aorta has been developed primarily as
a contrast-enhanced modality using a gadolinium-based contrast agent particularly for visualization of blood vessels
and is regarded as an important option for imaging study of aneurysms.1,5) MRA is performed as an alternative modality
for patients with allergy to iodine-based contrast agent13) and has been preferred in children and young patients in
consideration of exposure.13) In addition, the possibility of nephrogenic systemic fibrosis (NSF) has recently discouraged
gadolinium-contrasted imaging in patients with renal dysfunction. 14,15) In patients with chronic renal insufficiently
requiring dialysis, contrast-enhanced MRA is a contraindication due to the risk of NSF, but the administration of an
iodine-based contrast agent for CTA is not contraindicated if dialysis is performed promptly after the examination.14,15)
For patients at high risk of contrast-induced nephropathy, in whom contrast-enhanced CT/MRI cannot be performed,
non-contrast-enhanced MRA, the clinical application of which has been increasingly attempted recently, may have a
great advantage.16)
Index words and secondary materials used as references
A search of PubMed was performed using “aortic aneurysm”, “diagnosis”, and “computed tomography” and/or
“magnetic resonance imaging” as key words. The Joint Working Group on Guidelines for Diagnosis and Treatment of
Cardiovascular Diseases eds: Guidelines for the Diagnosis and Treatment of Aortic Aneurysms/Aortic Dissection, 2011
edition was also used as a reference.1)
References
1) Guidelines for Diagnosis and Treatment of Cardiovascular Diseases (2010 report of the Joint Research Group). Guidelines for Diagnosis and
Treatment of Aortic Aneurysms and Aortic Dissection, (2011 edition) (Level 5)
2) Davies RR et al: Yearly rupture or dissection rates for thoracic aortic aneurysms: simple prediction based on size. Ann Thorac Surg 73: 17-27,
2002 (Level 2)
14
The Japanese imaging guideline 2013
CQ 055
55
Are CT and MRI appropriate for the diagnosis of
aortic dissection?
Recommendation
grade
A
B
A CT
B MRI
Contrast-enhanced CT (CTA) is recommended for the initial diagnosis and followup of aortic dissection as there is strong evidence of its usefulness as the first
choice imaging modality. Contrast-enhanced MRA is useful if the patient is allergic
to iodinated contrast agents. For the follow-up of chronic phase aortic dissection in
patients with renal dysfunction, spin-echo sequences, cine MRI, and unenhanced
MRA, which do not involve radiation exposure or require the use of a contrast agent,
are useful and recommendable as alternatives for CT.
Background/objective
Since the Guidelines for Diagnosis and Treatment of Aortic Dissection, 20001) were published jointly by 7 major
scientific societies including the Japanese Circulation Society, they have been revised to the Guidelines for Diagnosis
and Treatment of Aortic Aneurysm and Aortic Dissection (revised in 2006)2) and to the current 2011 revised edition.3)
Whether or not CT and MRI are useful for the diagnosis of aortic dissection was evaluated by referring to these
guidelines.
Comments
In the 2000 guidelines, the following definition began to be used: “Aortic dissection is a state in which two lumens
with a considerable length exist along the course of the aorta due to dissection of the aortic wall at the medial level and
is a dynamic pathological condition in which a blood flow or hematoma is present in the aortic wall.” The basic feature
of the condition is “aortic dissection”, and the term “dissecting aneurysm of the aorta” is used only when part of the
lesion is dilated as an aneurysm in the chronic phase.
1) Diagnosis of aortic dissection by CT
According to the 2006 revised edition,2) aortic dissection is classified clinically from 3 viewpoints: (1) The extent
of dissection, (2) disease phase, and (3) state of blood flow in the false lumen. To understand the disease state and
determine the therapeutic approach, it is necessary to describe disease types by incorporating these 3 elements.
The Stanford and DeBakey classifications are based on the extent of dissection. The former, which classifies dissections
into types A and B depending on whether the dissection reaches the ascending aorta regardless of the location of the
entry site (intimal tear), is in wide clinical use. The latter classifies dissections into types I, II, and III (a, b) according to
the extent of dissection and location of the entry site.
By the disease phase, aortic dissections are classified into acute and chronic when they are within 2 weeks and 2 weeks
or more, respectively, after the onset. Lesions within 48 hours after the onset may be referred to as hyper-acute.
On the basis of the state of blood flow in the false lumen, there are the communicating (Figure 1) and noncommunicating (Figure 2) and ulcer-like projection (ULP) types. According to the morphology, aortic dissections are
classified into communicating type with blood flow observed in the false lumen and non-communicating type with
no blood flow observed in the false lumen (synonymous to the conventional thrombosed type: mentioned later).2) The
former is also called classic aortic dissection (double barrel type) if the tear and flaps are clearly observed.
In communicating aortic dissections, blood flow is visualized in the false lumen by contrast-enhanced CT. In the noncommunicating type, a crescent-shaped hyperdensity may be noted in the false lumen on unenhanced CT, and contrast
enhancement may be observed in the false lumen in the late phase of contrast-enhanced CT. Since these findings have
been suggested to reflect unstable/fluid blood, blood clots, hematoma, etc. before organization of the false lumen,
sufficient follow-up is needed.4-9)
While some so-called intramural hematomas disappear spontaneously, others may develop into classical aortic
dissections or aortic aneurysms.4-13) Some Western reports10,12,13) define intramural hematoma (IMH) as a condition in
which no intimal tear is identified, and the false lumen is filled with thrombus, but small intimal tears (ULP) may not
be identified by imaging studies. Whether or not there are any essential differences between intramural hematoma
and non-communicating dissection must still be evaluated, but, in the 2011 revised edition, the description changed to
“Since intramural hematoma is properly diagnosed by pathological examination, the clinical use of this term should be
avoided.”3) Also, as the risk of rupture has been reported,13) it is appropriate to regard intramural hematoma as a variant
or subtype of aortic dissection.3,14,15)
Penetrating atherosclerotic ulcer (PAU) reported by Stanson et al., i.e., an ulcerated atherosclerotic lesion of the aorta
reaching layers below the media,16,17) is confused with ULP in many papers, and as problems remain, utmost caution is
necessary in using this term.
15
The Japanese imaging guideline 2013
4. Cardiovascular region
T
F
Figure 2: Non-communicating aortic
dissection
Figure 1: Communicating
aortic dissection Stanford A
Contrast-enhanced CT MPR
image along the whole aorta.
Unenhanced CT showing a crescentshaped hyperdensity in the false lumen of
the ascending aorta. It is accompanied by
pericardial effusion.
Figure 3: Communicating aortic
dissection
Spin-echo imaging: The true lumen (T)
is markedly displaced by the posterior
false lumen. A fast blood flow enters via a
intimal tear, and signal void is observed in
the proximal area of the false lumen. The
signal intensity is increased in the false
lumenf the descending thoracic aorta due
to slow blood flow. T: True lumen, F: False
lumen
2) Diagnosis of aortic dissection by MRI
In patients with a poor general condition, MRI, which requires a long imaging time and has limitations in patient
monitoring, is not recommended for the diagnosis of acute aortic dissection. However, the modality is useful for
imaging evaluation in the chronic phase. The examination is performed basically by the spin-echo or fast spin-echo
sequences (Figure 3) and additionally by cine MRI capable of evaluating the blood flow kinetics, unenhanced time-offlight (TOF) sequences, phase-contrast (PC) sequences, black blood imaging, and contrast-enhanced MR angiography.18)
Generally, the points of diagnosis of aortic dissection are the presence diagnosis, disease typing, and diagnosis of
complications, but the evaluation of morphological changes and diagnosis of complications are important in the chronic
phase.
While contrast-enhanced MRA is usually performed, non-contrast-enhanced MRA is used as an alternative for the
follow-up of chronic phase aortic dissection in patients with allergy to iodinated contrast agents or renal dysfunction. It
should also be noted that the use of a gadolinium-based contrast agent in patients with marked renal dysfunction may
induce nephrogenic systemic fibrosis (NSF) and that checking of the renal function is necessary.
Index words and secondary materials used as references
A search of PubMed was performed using “aortic dissection”, “diagnosis”, “guideline”, “human”, and “practice
guideline” as key words. The Guidelines for the Diagnosis and Treatment of Cardiovascular Diseases1-3) were also used
as references.
References
1) Guidelines for Diagnosis and Treatment of Cardiovascular Diseases (1998-1999 report of the Joint Working Group): Guidelines for Diagnosis
and Treatment of Aortic Dissection. Circ J 64: 1249-1283, 2000 (Level 5)
2) Guidelines for Diagnosis and Treatment of Cardiovascular Diseases (2004-2005 report of the Joint Working Group): Guidelines for Diagnosis
and Treatment of Aortic Aneurysm and Aortic Dissection (2006 revised edition). Circ J 70: 1569-1646, 2006 (Level 5)
3) Guidelines for Diagnosis and Treatment of Cardiovascular Diseases (2010 report of the Joint Working Group): Guidelines for Diagnosis and
Treatment of Aortic Aneurysm and Aortic Dissection (2011 revised edition) http://www.j-circ.or.jp/guideline/pdf/JCS2011_takamoto_h.pdf
(Level 5)
16
The Japanese imaging guideline 2013
CQ 055
4) Ogawa N, Kobayashi T: CT diagnosis of acute aortic dissection; clinical importance of acute aortic dissection with non-opacified false lumen. J
Jpn Radiol Soc 49: 270-280, 1989 (Level 4)
5) Matsuoka Y: Acute non-opacified dissection of the ascending thoracic aorta-significance of retrograde dissection and re-dissection-. J Jpn
Radiol Soc 52: 979-992, 1992 (Level 4)
6) Kawamata H, Kumasaki T: Ulcerlike Projections of the thrombosed type aortic dissection. their incidence, locations and natural history. J Jpn
Coll Angiol 34: 1017-1032, 1994 (Level 4)
7) Hayashi H et al: Thrombosed type aortic dissection showing change of the false lumen to the patent type. J Jpn Radiol Soc 54: 1217-1224,
1994 (Level 4)
8) Hayashi H et al: Late Phase Contrast Enhanced-CT Analysis of Thrombosed Type Aortic Dissection. J Jpn Radiol Soc 55: 845-854, 1995
(Level 4)
9) Matsuoka Y et al: Stanford Type A Aortic Dissection with Closed False Lumen: Analysis of prognostic factors at initial CT or MRI. J Jpn Radiol
Soc 57: 572-580, 1997 (Level 4)
10) Vilacosta I et al: Natural history and serial morphology of aortic intramural hematoma: a novel variant of aortic dissection. Am Heart J 134:
495-507, 1997 (Level 4)
11) Nishigami K et al: Disappearance of aortic intramural hematoma and its significance to the prognosis. Circulation 102 III: 243-247, 2000 (Level
4)
12) Evangelista A et al: Long-term follow-up of aortic intramural hematoma. Predictors of outcome. Circulation 108: 583-586, 2003 (Level 4)
13) von Kodolitsch Y et al: Intramural hematoma of the aorta:predictors of progression to dissection and rupture. Circulation 107: 1158-1163, 2003
(Level 4)
14) Hiratzka LF et al: 2010ACCF/AHA/AATS/ACR/ASA/SCA/SCAI/SIR/STS/ SVM guidelines for the diagnosis and management of patients
with thoracic aortic diseasel: a report of the American College of Cardiology Foundation/American Heart Association Task Force on
Practice Guidelines, American Association for Thoracic Surgery, American College of Radiology, American Stroke Association, Society of
Cardiovascular Anesthesiologists, Society for Cardiovascular Angiography and Interventions, Society of Interventiona Radiology, Society of
Thoracic Surgeons, and Society for Vascular Medicine. Circulation 121: 1544-1579, 2010 (Level 4)
15) Erbel R et al: Diagnosis and management of aortic dissection: recommendation of the task force on aortic dissection. European Society of
Cardiology. Eur Heart J 22: 1642-1681, 2001 (Level 4)
16) Stanson AW et al: Penetrating atherosclerotic ulcers of the thoracic aorta:natural history and clinicopathologic correlations. Ann Vasc Surg 1:
15-23, 1986 (Level 4)
17) Hayashi H et al: Penetrating atherosclerotic ulcers of the aorta:imaging features and disease concept. Radiographics 20: 995-1005, 2000
(Level 5)
18) Matsunaga N et al: Magnetic resonance imaging features of aortic disease. Top in Magn Reson Imaging 14: 253-266, 2003 (Level 5)
17
The Japanese imaging guideline 2013
4. Cardiovascular region
56
Are CT and MRI appropriate for the diagnosis of
Takayasu’s arteritis?
Recommendation
grade
B
Contrast-enhanced CT is useful and recommended. If contrast-enhanced CT is
difficult to perform, MRI, which is considered to have nearly equal diagnostic power,
is recommended. MRI, which involves no exposure, is desirable for long-term followup.
Background/objective
The definitive diagnosis of Takayasu’s arteritis is rarely performed by pathological examination, and the condition
is usually diagnosed by comprehensively evaluating the imaging findings, clinical course, and laboratory findings.
Particularly, imaging studies play an important role in the diagnosis of this disease, and their appropriate implementation
is considered to permit the early diagnosis and initiation of proper treatments.
Comments
Takayasu’s arteritis is a non-specific vasculitis of unknown etiology that affects elastic vessels such as the aorta, its
major branches, and pulmonary artery. The disease is prevalent in Asian countries including Japan and preferentially
affects young to middle-aged women. Since patients with this disease are often included in those with fever of unknown
origin, young women visiting with fever or malaise should be examined with this disease in mind as a possible
differential diagnosis.
1) Points of diagnosis
The diagnostic criteria in Japan (Certification Criteria for Takayasu’s Arteritis, Website of the Japan Intractable
Diseases Information Center http://www.nanbyou.or.jp/pdf/065_s.pdf) clearly state that the definitive diagnosis be made
by imaging examinations (DSA, CT, MRA). If imaging findings characteristic of this disease (multiple obstructive or
dilated lesions of the aorta and its primary branches) are noted in young individuals, this disease should be initially
suspected even when inflammatory reaction is negative and can be definitively diagnosed when it is positive. However,
the definitive diagnosis must be made after exclusion of (1) arteriosclerosis, (2) inflammatory abdominal aortic
aneurysm, (3) vascular Behçet’s disease, (4) syphilitic mesoaortitis, (5) giant cell arteritis, (6) congenital vascular
anomalies, and (7) bacterial (infected) aneurysm.
2) Usefulness of CT/MRI in the acute phase
DSA used to be the gold standard for the imaging diagnosis of this disease.1) However, while DSA is excellent for the
evaluation of changes in the vascular lumen such as stenosis and dilatation, it is difficult by this modality to evaluate
wall thickening without luminal changes, which is observed in the acute phase. Presently, therefore, the initial diagnosis
of this condition is mostly made using CT or MRI. In the acute phase, circumferential thickening of the aortic wall is
a characteristic feature, and a thickened aortic wall is occasionally observed as a hyperdensity on unenhanced CT. In
the late phase of contrast-enhanced CT, nearly homogeneous contrast enhancement is noted in the thickened wall, but
double ring-shaped layer may be observed on careful examination.2-6) Such double layer is called the double ring-like
sign, and the contrast-enhanced outer layer and mildly enhancing inner layer are considered to correspond, respectively,
to inflammatory change accompanied by medial and adventitial vascularization and mucinous/gelatinous edema of
the intima.6) Pulmonary artery lesions are observed relatively frequently in this disease, i.e., 70-80% of the patients,
and the presence or absence of pulmonary artery lesions may be a decisive point for the diagnosis of this disease if
its discrimination from other diseases is difficult. Therefore, attention to thickening and contrast enhancement of the
pulmonary artery is also necessary in the acute phase.6) Thickening and contrast enhancement of the wall in the acute
phase are also noted on contrast-enhanced MRI, and the modality, not involving radiation exposure, is useful for the
evaluation of the therapeutic effects and long-term follow-up.7-9) If the disease is diagnosed, and steroid therapy is
initiated, in this phase, resolution of arterial wall thickening is expected, but non-specific signs of inflammation such as
fever of unknown origin are often the only clinical findings, and many patients are not properly diagnosed. Recently,
there have been sporadic reports that 18F-FDG PET is useful for the evaluation of the activity of inflammation and extent
of the lesion in aortitis such as Takayasu’s arteritis,10) but this examination is not covered by insurance in Japan.
3) Usefulness of CT/MRI in the chronic phase
Vascular lesions observed in the chronic phase are often stenosis/obstruction due to reactive intimal hypertrophy, but
dilated lesions and aneurysms may occur if necrosis of medial smooth muscle cells or destruction of elastic fiber layer
is severe while scarring is mild. Stenotic lesions are frequently observed in the left subclavian artery, left common
carotid artery, descending thoracic aorta, and abdominal aorta. In contrast, dilated lesions often arise in the ascending
aorta, aortic arch, and brachiocephalic artery. Dilated or stenotic/obstructive lesions of the aorta or its branches can
18
The Japanese imaging guideline 2013
CQ 056
Figure 2: Takayasu’s arteritis (chronic
stage: female in her 50s)
Figure 1: Takayasu’s arteritis (acute stage:
female in her 30s)
The left subclavian artery is obstructed at its
origin, and marked stenosis is noted in a distal
part of the thoracic descending aorta. Mild
dilation is observed in the ascending aorta.
Contrast-enhanced CT in the late phase shows wall
thickening and contrast enhancement of the aortic
arch and right brachiocephalic artery. While the
contrast of the outer layer of the thickened wall is
enhanced, contrast enhancement of the inner layer is
weak, showing the double ring-like sign.
be clearly delineated by CTA or MRA and, presently, are infrequently evaluated by DSA.2,11-13) Using DSA as the gold
standard, the sensitivity and specificity of MRA have been reported to be both 100%, and those of CT to be 95 and
100%, respectively.5,13) Also, stenosis and obstruction of the pulmonary artery have also been reported to be assessable
by CTA and MRA, and the possibility of replacement of pulmonary perfusion scintigraphy by these modalities has
been suggested.14) Disorders that affect the prognosis of Takayasu’s arteritis include (1) hypertension due to renal artery
stenosis or atypical coarctation of the aorta, (2) congestive heart failure due to aortic insufficiency, (3) ischemic heart
disease due to coronary artery lesions, and (4) rupture of aneurysm. Therefore, to improve the life prognosis of patients,
it is necessary to perform appropriate internal treatment for these lesions from an early stage and appropriate surgical
treatment for severe ones. Recently, there have been reports that CT is also useful for the evaluation of coronary lesions
of Takayasu’s arteritis.15)
Index words and secondary materials used as references
A search of PubMed was performed using “Takayasu arteritis”, “CT”, and “MRI” as key words. The Joint Working
Group on Guidelines for Diagnosis and Treatment of Cardiovascular Diseases ed: Guidelines for Management of
Vasculitis Syndrome (2006-2007) were also used as a reference
References
1) Yamato M et al: Takayasu arteritis: radiographic and angiographic findings in 59 patients. Radiology 161: 329-334, 1986 (Level 4)
2) Park JH: Conventional and CT angiographic diagnosis of Takayasu arteritis. Int J Cardiol 54 (suppl): S165-S171, 1996 (Level 4)
3) Park JH et al: Takayasu arteritis: evaluation of mural changes in the aorta and pulmonary artery with CT angiography. Radiology 196: 89-93,
1995 (Level 4)
4) Sharma S et al: Morphologic mural changes in the aorta revealed by CT in patients with nonspecific aortoarteritis (Takayasu’s arteritis). AJR
167: 1321-1325, 1996 (Level 4)
5) Yamada I et al: Takayasu arteritis: evaluation of the thoracic aorta with CT angiography. Radiology 209: 103-109, 1998 (Level 4)
19
The Japanese imaging guideline 2013
4. Cardiovascular region
6) Matsunaga N et al: Takayasu arteritis: protean radiologic manifestations and diagnosis. Radiographics 17: 579-597, 1997 (Level 4)
7) Tso E et al: Takayasu arteritis: utility and limitation of magnetic resonance imaging in diagnosis and treatment. Arthritis Rheum 46: 1634-1642,
2002 (Level 4)
8) Choe YH et al: Takayasu’s arteritis: assessment of disease activity with contrast-enhanced MR imaging. AJR 175: 505-511, 2000 (Level 4)
9) Yamada I et al: Takayasu arteritis: evaluation with MR imaging. Radiology 188: 89-94, 1993 (Level 4)
10) Walter MA et al: [(18)F] fluorodeoxyglucose PET in large vessel vasculitis. Radiol Clin North Am 45: 735-744, 2007 (Level 4)
11) Kumar S et al: Takayasu’s arteritis: evaluation with three-dimensional time-of-flight MR angiography. Eur Radiol 7: 44-50, 1997 (Level 4)
12) Nastri MV et al: Gadolinium-enhanced three-dimensional MR angiography of Takayasu arteritis. Radiographics 24: 773-786, 2004 (Level 4)
13) Yamada I et al: Takayasu arteritis: diagnosis with breath-hold contrast-enhanced three-dimensional MR angiography. J Magn Reson Imaging
11: 481-487, 2000 (Level 4)
14) Sueyoshi E et al: Diagnosis of perfusion abnormality of the pulmonary artery in Takayasu’s arteritis using contrast-enhanced MR perfusion
imaging. Eur Radiol 16: 1551-1556, 2006 (Level 4)
15) Soto ME et al: Coronary CT angiography of Takayasu arteritis. J Am Coll Cardiol 4: 1531-1540, 2011 (Level 4)
20
The Japanese imaging guideline 2013
CQ 057
57
Is contrast-enhanced CT appropriate for the imaging
evaluation after stent graft placement for aortic
disorders?
Recommendation
grade
B
Contrast-enhanced CT is useful and recommended.
Background/objective
Presently, the therapeutic approach to thoracic/abdominal aneurysms is determined mostly by contrast-enhanced CT.
This is not only because the technique allows dynamic evaluation of the hemodynamics using a contrast agent but also
because volume data of thin-slice CT are indispensable for the preparation of detailed treatment plans using the image
analysis work station, which has been recently developed. For objective recording of the relationship between aortic
aneurysm and major vascular branches, CT is the optimal modality. MRI is also used, but the image quality varies
widely according to the equipment, so the modality cannot be universally recommended. In this article, whether or not
CT is useful for the imaging evaluation after stent graft placement (T/EVAR) for thoracic/abdominal aortic aneurysm is
evaluated with a review of the literature.
Comments
Modalities used for the imaging evaluation after T/EVAR include angiography, contrast-enhanced CT, contrastenhanced MRI, color Doppler ultrasound (CDU), and contrast-enhanced ultrasound. Of these modalities, angiography
is highly invasive and is usually avoided. MRI has never been selected as a method for the imaging evaluation in major
clinical trials for the reason mentioned earlier in Chapter 2.
In contrast, contrast-enhanced CT has been used for preoperative and postoperative evaluations in all large-scale
clinical studies conducted to date (EVAR in the UK, DREAM in the Netherlands, and OVER in the United States).1,2)
On the basis of this fact, the 2011 ACCF/AHA Focused update of the guideline for the management of patients with
peripheral artery disease (updating the 2005 guideline)3) clearly states, “Patients who have undergone T/EVAR must be
evaluated 1 and 6 months after surgery and annually thereafter by CT (or MRI) regarding graft migration, endoleak, and
enlargement of the aneurysm diameter.”3) Therefore, the present article also concludes that CT is useful for the imaging
evaluation after stent graft placement for aortic disorders (Figure).
The following points are worth mentioning as reference information. Recently, CDU and contrast-enhanced ultrasound,
which have shown marked development, have been applied to the assessment of endoleak after T/EVAR, and excellent
results have been reported. However, by comparison with CT, Pittsburgh University concluded that they cannot replace
CT as a modality for follow-up studies.4) In contrast, Chaer RA et al. recommended CDU, which is less expensive than
CT and uses no contrast agent or radiation, for patients who show decreases in the aneurysm diameter and are judged
to be in a stable period and have no problem such as a physique interfering with the measurement of the aneurysm
diameter and imaging of endoleak.5)
Index words and secondary materials used as references
A search of PubMed was performed using “aortic aneurysm”, “MeSH”, “x ray computed tomography”, “endovascular
procedures”, “clinical trial”, “meta-analysis”, “practice guideline”, and “randomized controlled trial” as key words.
The 2011 ACCF/AHA Focused update of the guideline for the management of patients with peripheral artery diseases
(updating the 2005 guideline) was also used as a reference.
21
The Japanese imaging guideline 2013
4. Cardiovascular region
A
B
C
D
Figure: After stent graft placement for aortic aneurysm
Contrast-enhanced CT
In the image 8 months after stent graft placement (A), type II endoleak
from the inferior mesenteric artery is observed. After embolization using
NBCA (B), endoleak disappeared, and residue of NBCA is observed.
Compared with the image before embolization (C), the aneurysm diameter
is reduced after 1 year (D).
References
1) The United Kingdom EVAR Trial Investigator: Endovascular versus open repair of abdominal aortic aneurysm. N Engl J Med 362: 1863-1871,
2010 (Level 3)
2) DREAM Study Group: Long-term outcome of open or endovascular repair of abdominal aortic aneurysm. N Engl J Med 362: 1881-1889, 2010
(Level 3)
3) 2011 ACCF/AHA Focused update of the guideline for the management of patients with peripheral artery disease (updating the 2005 guideline): a report of the American College of Cardiology Foundation/American Heart Association Task Force on Practice Guidelines: developed
in collaboration with the Society for Cardiovascular Angiography and Interventions, Society of Interventional Radiology, Society for Vascular
Medicine, and Society for Vascular Surgery. J Vasc Surg 54: e32-58, 2011 (Level 5)
4) Raman KG et al: Color-flow duplex ultrasounds scan versus computed tomographic scan in the surveillance of endovascular aneurysm repair.
J Vasc Surg 38: 645-651, 2003 (Level 4)
5) Chaer RA et al: Duplex ultrasound as the sole long-term surveillance method post-endovascular aneurysm repair: a safe alternative for stable
aneurysms. J Vasc Surg 49: 845-850, 2009 (Level 4)
22
The Japanese imaging guideline 2013
CQ 058
58
Are CT and MRI appropriate for the diagnosis of
arteriosclerosis obliterans?
Recommendation
grade
B
C1
B CTA, contrast-enhanced MRA
C1 Unenhanced MRA
CTA and contrast-enhanced MRA are recommended for the diagnosis of
arteriosclerosis obliterans as there is evidence of their usefulness. Unenhanced MRA
is worth considering as an alternative of contrast-enhanced MRA for patients with
renal dysfunction.
Background/objective
Trans-arterial digital subtraction angiography (DSA) was used an a standard imaging modality for the diagnosis of
arteriosclerosis obliterans (ASO), but CT angiography (CTA) and MR angiography (MRA) have become prevalent due
to the development of MDCT and improvements in the performance of MRI devices. The usefulness of CTA and MRA
for the diagnosis of ASO is evaluated.
Comments
ASO is suspected clinically due to symptoms and an abnormal ankle-brachial index (ABI) and is diagnosed on the
basis of anatomical abnormalities detected by imaging examination. ASO has been recently called peripheral arterial
disease (PAD).
According to meta-analysis evaluating the diagnostic performance of CTA for 50% or severer stenosis/obstruction
in ASO by DSA, the sensitivity and specificity were 96 and 98% in the aortoiliac region, 97 and 94% in the
femoropopliteal region, and 95 and 91%, respectively, in the lower leg.1) The sensitivity and specificity of MDCT were
92 and 93% with 4 or less detector rows but 97 and 98%, respectively, with 16/64 detector rows, being significantly
superior for the latter. According to a recent report using 64-row MDCT, the sensitivity and specificity were 100 and 99%
in the aortoiliac and femoropopliteal regions and 97 and 99%, respectively, in the lower leg region,2) and the modality
was also useful for the determination of the therapeutic approach in endovascular and surgical treatments.3) By CTA, the
imaging evaluation is performed using axial views, multiplanar reformation (MPR), curved multi-planar reformation
(CPR), maximum intensity projection (MIP), and volume rendering (VR) (Figures 1, 2).2,3) Blooming artifacts in
calcified lesions are mentioned as a cause of overestimating on CTA,4) but overestimating is also caused by false
delineation of patent areas on DSA as obstructed. Also, motion artifacts, differences in the imaging phase in the lower
leg vessels, and poor delineation of areas distal to the obstructed segment are considered to cause false positive findings
on DSA.2) Sparing of multidirectional imaging may also cause false negatives (underestimating) on DSA.
Symptoms of ASO are divided into intermittent claudication and critical limb ischemia causing rest pain and ulcer.
While the subjects of many reports using CTA were patients with intermittent claudication, there are reports that CTA
also contributed to the determination of the therapeutic approach in patients with critical limb ischemia.5) The absorbed
dose on CTA has been reported to be 3.0 mSv in males and 2.3 mSv in females using 16-row MDCT6) and 7.0 and 4.7
mSv, respectively, using 64-row MDCT.3)
According to a meta-analysis evaluating the diagnostic performance of contrast-enhanced MRA for 50% or greater
stenosis or obstruction on DSA, the sensitivity and specificity are reported to be 93.5 and 96.3% in the aortoiliac region,
95.3 and 95.6% in the femoropopliteal region, and 92.2 and 93.3%, respectively, in the lower leg region.7) By imaging
of specific regions with injections of a contrast agent, the sensitivity was 97.2%, being significantly higher than 93.3%
by the bolus-chase method with a single injection. The degree of stenosis is evaluated using original images, MIP, and
MPR.8,9) Reports using unenhanced MRA rather than the conventional time of flight method have appeared recently, and
the sensitivity and specificity of unenhanced MRA for 70% or greater stenosis/obstruction on DSA have been reported
to be 95.6 and 97.4% in the femoral region and 95.2 and 87.5%, respectively, in the lower leg region.10)
According to the results of meta-analyses concerning the diagnostic performance of CTA and MRA, their sensitivity
and specificity are comparable. By CT and MRI, the differentiation of ASO from extravascular lesions (e.g., adventitial
cystic disease, popliteal artery entrapment syndrome) and diagnosis of thrombotic occlusion of aneurysm are possible
using original images or MPR.
Index words and secondary materials used as references
A search of PubMed was performed using “peripheral arterial disease”, “CT”, and “MR” as key words. The Inter23
The Japanese imaging guideline 2013
4. Cardiovascular region
Figure 1: Occlusion of
the right external iliac
artery/deep femoral
artery CTA
Occlusion from the right
external iliac artery to the
common femoral artery and
stenosis of the superficial
femoral artery are noted.
Figure 2: Stent graft
placement for right
external iliac artery
occlusion CTA
Right femoropopliteal and
femorofemoral bypass
surgeries were performed.
Society Consensus for the Management of Peripheral Arterial Disease (TASC II) was also used as a reference.
References
1) Met R et al: Diagnostic performance of computed tomography angiography in peripheral arterial disease. A systematic review and meta-analysis. JAMA 301: 415-424, 2009 (Level 1)
2) Shareghi S et al: Diagnostic accuracy of 64 multidetector computed tomographic angiography in peripheral vascular disease. Catheter
Cardiovasc Intervent 75: 23-31, 2010 (Level 2)
3) Napoli A et al: Peripheral arterial occlusive disease: diagnostic performance and effect on therapeutic management of 64-section CT angiography. Radiology 261: 976-986, 2011 (Level 2)
4) Sarwar A et al: Calcified plaque: measurement of area at thin-section flat-panel CT and 64-section Multidetector CT and comparison with histopathologic findings. Radiology 249: 301-306, 2008 (Level 3)
5) Schernthaner R et al: Value of MDCT angiography in developing treatment strategies for critical limb ischemia. AJR 192: 1416-1142, 2009
(Level 4)
6) Willmann JK et al: Aortoiliac and lower extremity arteries assessed with 16-detector row CT angiography: prospective comparison with digital
subtraction angiography. Radiology 236: 1083-1093, 2005 (Level 2)
7) Menke J et al: Meta-analysis: accuracy of contrast-enhanced magnetic resonance angiography for assessing steno-occlusions in peripheral
arterial disease. Ann Intern Med 153: 325-334, 2010 (Level 1)
8) Sueyoshi E et al: Aortoiliac and lower extremity arteries: comparison of three-dimensional dynamic contrast-enhanced subtraction MR angiography and conventional angiography. Radiology 210: 683-688, 1999 (Level 4)
9) Huber A et al: dynamic contrast-enhanced MR angiography from the distal aorta to the ankle joint with a step-by-step technique. AJR 175:
1291-1298, 2000 (Level 2)
10) Gutzeit A et al: ECG-triggered non-contrast-enhanced MR angiography (TRANCE) versus digital subtraction angiography (DSA) in patients
with peripheral arterial occlusive disease of the lower extremities. Eur Radiol 21: 1979-1987, 2011 (Level 3)
24
The Japanese imaging guideline 2013
CQ 059
59
Are CT and MRI appropriate for the evaluation after
stent graft placement for arteriosclerosis obliterans?
Recommendation
grade
B
C1
B CT, contrast-enhanced MRI
C1 Unenhanced MRI
In both CT and MRI, artifacts appear at the sites of stent graft placement, making the
evaluation of lumens difficult. However, the modalities are recommended as there
is evidence for their usefulness. Which of CT and MRI should be selected depends
on the stent type, but CT is preferable except for tantalum stents. While there is no
sufficient evidence, Unenhanced MRI may be considered when contrast-enhanced
CT or MRI cannot be performed.
Background/objective
Stent graft placement is often selected as an endovascular treatment for revascularization. However, implanted stents
are known to cause artifacts on both CT and MRI. The usefulness of CT and MRI for the assessment of patients with
arteriosclerosis obliterans after stent graft placement is evaluated.
Comments
With the advancing age of the population and Westernization of lifestyle, patients with arteriosclerosis obliterans are
also increasing in Japan.
Treatments for arteriosclerosis obliterans include internal treatments such as drug and exercise therapies, endovascular
treatments such as stent graft placement and balloon dilatation, and surgical treatments such as endarterectomy and
bypass grafting, and the selection of treatments according to the distribution and severity of lesions is recommended.1)
Ultrasonography, CT, and MRI are non-invasive imaging diagnostic modalities for arteriosclerosis obliterans.
Compared with MRI, CT can be performed in a relatively short time and simultaneously provides information
concerning bone and calcification. However, it involves radiation exposure and requires the use of an iodine-based
contrast agent, and the evaluation of lumens is occasionally difficult in severely calcified lesions. MRI, on the other
hand, causes no radiation exposure and is capable of diagnosing even severely calcified lesions, but it cannot be applied
to patients with an implanted pacemaker or defibrillator. Also, due to the risk of nephrogenic systemic fibrosis, a
gadolinium-based contrast agent is a contraindication in patients with severe renal disorder.
CT or MRI is selected in consideration of their characteristics as above and circumstances of each facility, but selection
criteria appropriate for stent materials are also necessary for the assessment of the sites of stent graft placement.
1) CT
CT angiography is used for the diagnosis of arteriosclerosis obliterans. At the sites of stent graft placement, lumens
show apparent narrowing and decreases in the CT value due to beam-hardening artifacts. Beam-hardening is affected by
the stent material and thickness of the skeleton. Also, stenosis is overestimated in stents with a small diameter.2)
According to evaluations using phantoms,3,4) tantalum stents cause marked artifacts, and their lumens are difficult to
evaluate. The evaluation of the lumen is possible in nitinol or stainless steel stents (Figure 1). Markers at the ends of
a stent may also cause marked artifacts. While the long axis of the stent is often placed in parallel with the X axis in
experiments using phantoms, it is placed diagonally to the Z axis in most clinical situations, resulting is severer artifacts
due to beam-hardening. There are also artifacts due to calcification of the arterial wall, making the evaluation of lumens
even more difficult.
A high-resolution reconstruction algorithm may be selected to reduce beam-hardening artifacts and visualize the stent
lumen.5) Such a high-resolution reconstruction algorithm improves the spatial resolution but increases noise.
2) MRI
MR angiography using a contrast agent is performed for the evaluation of arteriosclerosis obliterans.6) At the sites of
stent graft placement, the lumens appear narrower due to susceptibility artifacts. Susceptibility artifacts vary with the
stent material.3,7,8) Tantalum stents cause less artifacts. In many nitinol stents, the patency of the stent can, but the degree
of stenosis cannot, be evaluated (Figure 2). Signals of the lumen disappear in stainless steel stents (Figure 1C) and
some nitinol stents, preventing the evaluation (Figure 1C).
Index words and secondary materials used as references
A search of PubMed was performed using “PAOD (peripheral arterial occlusive disease)”, “stent”, “CT (computed
tomography, CTA, CT angiography)”, and “MRI (MRA, MR angiography)” as key words. The guidelines of the J Vasc
25
The Japanese imaging guideline 2013
4. Cardiovascular region
A
B
C
Figure 1: Stent graft placement in the right common iliac artery
A CT image by MIP B CT image by CPR C MRA A stainless steel stent is placed in
the right common iliac artery, and a nitinol stent is placed in the left common iliac artery.
Areas in which the stent overlaps with calcification cannot be evaluated by MIP, and
cross-sectional images such as those obtained by CPR are necessary. In MRA, signals
are obliterated in the area where a stainless steel stent is placed ( → ). Signals are also
markedly reduced at a nitinol stent (C → ).
Figure 2: MRA
A nitinol stent is placed
from the right common
iliac artery to the external
iliac artery. While signals
are slightly reduced at the
stent, its patency can be
confirmed ( → ).
Surg (Norgren L et al., the TASC II Working Group ed: Inter-Society Consensus for the Management of Peripheral
arterial Diseases (TASC II), 2007) were also used as a reference.
References
1) Norgren L et al: Inter-society consensus for the management of peripheral arterial disease (TASC II). J Vasc Surg 45 (suppl S): S5-S67, 2007
(Level 5)
2) Herzog C et al: Peripheral artery stent visualization and in-stent stenosis analysis in 16-row computed tomography: an in-vitro evaluation. Eur
Radiol 15: 2276-2283, 2005 (No applicable level)
3) Maintz D et al: Revealing in-stent stenoses of the iliac arteries: comparison of multidetector CT with MR angiography and digital radiographic
angiography in a phantom model. AJR 179: 1319-1322, 2002 (No applicable level)
4) Schernthaner MB et al: Perceptibility and quantification of in-stent stenosis with six peripheral arterial stent types in vitro: comparison of
16-MDCT angiography, 64-MDCT angiography, and MR angiography. AJR 194: 1346-1351, 2010 (No applicable level)
5) Heuschmid M et al: Evaluation of various image reconstruction parameters in lower extremity stents using multidetector-row CT angiography:
initial findings. Eur Radiol 17: 265-271, 2007 (Level 3)
6) Lakshminarayan R et al: Magnetic resonance angiography: current status in the planning and follow-up of endovascular treatment in lowerlimb arterial disease. Cardiovasc Intervent Radiol 32: 327-405, 2009 (Level 5)
7) Link J et al: liofemoral arterial occlusive disease: contrast-enhanced MR angiography for preinterventional evaluation and follow-up after stent
placement. Radiology 212: 371-377, 1999 (Level 3)
8) Hamer OW et al: In vivo evaluation of patency and in-stent stenoses after implantation of nitinol stents in iliac arteries using MR angiography.
AJR 185: 1282-1288, 2005 (Level 3)
26
The Japanese imaging guideline 2013
05
Gastrointestinal
tract
1
The Japanese imaging guideline 2013
5. Gastrointestinal tract
60
Which are appropriate and cost-effective imaging
modalities in screening patients with chronic liver
disease for hepatocellular carcinoma?
Recommendation
grade
C1
The cost-effectiveness is highest in Sonazoid contrast-enhanced ultrasonography.
It is followed by dynamic CT and EOB・Primovist contrast-enhanced MRI, with no
marked difference between these two modalities. The cost-effectiveness is lowest in
angiography (including CT).
Background/objective
Controlling the medical expenditure is a social demand and is also a matter of keen interest to some patients. However,
suppression of medical expenditure may cause a decline in the quality of medical service. With these circumstances in
mind, it is desirable to conduct the diagnosis and treatment with the cost-effectiveness in mind. The cost-effectiveness
was compared among contrast-enhanced imaging modalities used for screening of hepatocellular carcinoma.
Comments
There have been few studies that directly evaluated the cost-effectiveness of imaging modalities for the diagnosis of
hepatocellular carcinoma. Medical expenditures vary among countries and regions, and the results of analyses based
on the medical system of a foreign country1,2) cannot be directly applied to the practice in Japan. In addition, as the
system of remuneration for medical services is frequently revised, research results providing evidence for the evaluation
of the cost-effectiveness of various examinations under the current system are deficient. There is a study on the costeffectiveness of ultrasound hepatocellular carcinoma surveillance in Japan3) but no such study regarding other imaging
modalities.
It must also be noted that, in evaluating the cost-effectiveness, the “cost” and “effect” may vary depending on the
viewpoint. The cost-effectiveness differs for society (government or medical insurance system), patients, and the
management of a medical facility. Moreover, how the cost or effect itself should be evaluated is unclear in some
respects. For example, “the expense for an examination” may be simply regarded as “the cost”, but if which examination
is performed makes differences in the subsequent examinations or treatments, it may be necessary to take the total
cost that arises thereafter into consideration. Similarly, while the ability to detect hepatocellular carcinoma may be
considered the “effect”, it is more reasonable to regard the improvement in the outcome due to a particular examination
as its “effect” in view of the significance of the medical action. Thus, the definition of cost-effectiveness itself contains
complex problems. In this article, “the ratio between the ability of an examination to detect hepatocellular carcinoma
and its cost” is defined as the cost-effectiveness. This simplifies the idea of cost-effectiveness, but it must be noted that,
in reality, situations are diverse as mentioned above.
The costs of examinations are evaluated on the basis of the April 2012 version of the Table of Medical Remuneration
Points. The medical remuneration points of Sonazoid contrast-enhanced ultrasonography, dynamic CT, and
EOB・Primovist contrast-enhanced MRI performed alone on an outpatient basis and angiography (including CT)
performed by hospitalizing the patient for 3 days and 2 nights are about 2,000, 3,000, 4,300, and 18,000, respectively
(Note: The exact remuneration varies with the facility, equipment, and contrast agent used). Therefore, if the cost of
Sonazoid contrast-enhanced ultrasonography is regarded as 1, the relative costs of the other modalities are 1.5 for
dynamic CT, 2.2 for EOB・Primovist contrast-enhanced MRI, and 9 for angiography (including CT).
A systematic review reported that the sensitivity and specificity were 60 (95% CI: 44-76%) and 97% (95-98%) by
ultrasonography, 68 (55-80) and 93 (89-96)% by CT, and 81 (70-91) and 85 (77-93)%, respectively, by MRI, and
concluded that ultrasonography is more specific but less sensitive than the other modaliteis.4) This report did not include
Sonazoid contrast-enhanced ultrasonography or EOB・Primovist contrast-enhanced MRI. Concerning contrast-enhanced
ultrasonography, there is a report that the sensitivity of Sonazoid contrast-enhanced ultrasonography (73-83%) was
similar or slightly lower compared with that of non-contrast-enhanced ultrasonography (83-84%) but that its specificity
was higher (97-98 vs. 90-94%).5) Also, the diagnostic performance of Sonazoid contrast-enhanced ultrasonography
was reported to be higher than that of dynamic CT.6-8) From these reports, since the relative cost of dynamic CT is 1.5,
Sonazoid contrast-enhanced ultrasonography is considered to be more cost-effective than contrast-enhanced CT. There
have been a number of reports that EOB・Primovist contrast-enhanced MRI showed higher diagnostic performance than
dynamic CT.8-17) However, as the cost of EOB・Primovist contrast-enhanced MRI is 1.4 times that of contrast-enhanced
CT, which modality is superior is unclear (they appear comparable in cost-effectiveness). While studies that directly
compared EOB・Primovist contrast-enhanced MRI and Sonazoid contrast-enhanced ultrasonography are few, there
is a report that MRI is slightly superior (no significant difference).8) To summarize the above observations, the costeffectiveness is considered to be highest in Sonazoid contrast-enhanced ultrasonography, followed by dynamic CT and
2
The Japanese imaging guideline 2013
CQ 061
EOB・Primovist contrast-enhanced MRI.
CT during angiography (such as CTAP and CTHA) has been reported to be more sensitive than dynamic CT or
EOB・Primovist contrast-enhanced MRI,8) but there is also a report that EOB・Primovist contrast-enhanced MRI showed
higher diagnostic performance than CT during angiography.12) The improvement in the detection rate or diagnostic
accuracy by angiography (including CT) is not considered to match its relative cost (9), and it appears less cost-effective
than the other 3 modalities.
Index words and secondary materials used as references
A search of PubMed was performed using “CT”, “MRI”, “sonography”, “US”, “liver”, “hepatocellular carcinoma”,
“HCC”, “sensitivity”, and “accuracy” as key words. The Japan Society of Hepatology ed: Clinical Practice Guidelines
for Hepatocellular Carcinoma 2009 update was also used as a reference.
References
1) Arguedas MR et al: Screening for hepatocellular carcinoma in patients with hepatitis C cirrhosis: a cost-utility analysis. Am J Gastroenterol 98:
679-690, 2003 (Level 5)
2) Thompson CJ et al: Surveillance of cirrhosis for hepatocellular carcinoma: systematic review and economic analysis. Health Technol Assess
11: 1-206, 2007 (Level 5)
3) Tanaka H et al: Cost-effectiveness analysis on the surveillance for hepatocellular carcinoma in liver cirrhosis patients using contrast-enhanced
ultrasonography. Hepatol Res 42: 376-384, 2012 (Level 5)
4) Colli A et al: Accuracy of ultrasonography, spiral CT, magnetic resonance, and alpha-fetoprotein in diagnosing hepatocellular carcinoma: a
systematic review. Am J Gastroenterol 101: 513-523, 2006 (Level 1)
5) Goto E et al: Value of post-vascular phase (Kupffer imaging) by contrast-enhanced ultrasonography using Sonazoid in the detection of hepatocellular carcinoma. J Gastroenterol 47: 477-485, 2011 (Level 3)
6) Hatanaka K et al: Sonazoid-enhanced ultrasonography for diagnosis of hepatic malignancies: comparison with contrast-enhanced CT.
Oncology 75 suppl 1: 42-47, 2008 (Level 4)
7) Moriyasu F et al: Efficacy of perflubutane microbubble-enhanced ultrasound in the characterization and detection of focal liver lesions: phase 3
multicenter clinical trial. AJR 193: 86-95, 2009 (Level 4)
8) Mita K et al: Diagnostic sensitivity of imaging modalities for hepatocellular carcinoma smaller than 2 cm. World J Gastroenterol 16: 4187-4192,
2010 (Level 4)
9) Kim SH et al: Gadoxetic acid-enhanced MRI versus triple-phase MDCT for the preoperative detection of hepatocellular carcinoma. AJR 192:
1675-1681, 2009 (Level 2)
10) Kim YK et al: Detection of hepatocellular carcinoma: gadoxetic acid-enhanced 3-dimensional magnetic resonance imaging versus multi-detector row computed tomography. J Comput Assist Tomogr 33: 844-850, 2009 (Level 4)
11) Di Martino M et al: Intraindividual comparison of gadoxetate disodium-enhanced MR imaging and 64-section multidetector CT in the Detection
of hepatocellular carcinoma in patients with cirrhosis. Radiology 256: 806-816, 2010 (Level 3)
12) Sano K et al: Imaging study of early hepatocellular carcinoma: usefulness of gadoxetic acid-enhanced MR imaging. Radiology 261: 834-844,
2011 (Level 2)
13) Hwang J et al: Small (<=2 cm) hepatocellular carcinoma in patients with chronic liver disease: comparison of gadoxetic acid-enhanced 3.0 T
MRI and multiphasic 64-MDCT. Br J Radiol 85: e314-e322, 2011 (Level 3)
14) Akai H et al: Detection of hepatocellular carcinoma by Gd-EOB-DTPA-enhanced liver MRI: comparison with triple phase 64 detector row helical CT. Eur J Radiol 80: 310-315, 2011 (Level 2)
15) Haradome H et al: Additional value of gadoxetic acid-DTPA-enhanced hepatobiliary phase MR imaging in the diagnosis of early-stage hepatocellular carcinoma: comparison with dynamic triple-phase multidetector CT imaging. J Magn Reson Imaging 34: 69-78, 2011 (Level 3)
16) Onishi H et al: Hypervascular hepatocellular carcinomas: detection with gadoxetate disodium-enhanced MR imaging and multiphasic multidetector CT. Eur Radiol 22: 845-854, 2012 (Level 3)
17) Baek CK et al: Hepatocellular carcinoma in patients with chronic liver disease: a comparison of gadoxetic acid-enhanced MRI and multiphasic
MDCT. Clin Radiol 67: 148-156, 2012 (Level 3)
3
The Japanese imaging guideline 2013
5. Gastrointestinal tract
61
What examination is appropriate when a lesion is
suspected on ultrasound screening in patients with
chronic liver disease?
Recommendation
grade
B
Dynamic CT, EOB, or Sonazoid contrast-enhanced ultrasonography is recommended.
Background/objective
Ultrasonography is widely used for purposes including screening of high-risk patients for hepatocellular carcinoma
such as those with chronic hepatitis and liver cirrhosis due to its simplicity, low invasiveness, and low cost. However, if
a liver tumor is detected or suspected by ultrasonography, a definitive diagnosis cannot be obtained by ultrasonography
alone, and other examinations with higher diagnostic ability become necessary. Such examinations include Sonazoid
contrast-enhanced ultrasonography, dynamic CT, MRI using a gadolinium-based extracellular contrast agent, which are
not highly invasive, and MRI using EOB・Primovist, which is a hepatocyte-specific contrast agent. If a hepatic lesion
has been detected in a high-risk patient for hepatocellular carcinoma, the discrimination of hepatocellular carcinoma
from hepatic angioma, dysplastic nodule, or intrahepatic bile duct carcinoma, which requires a different therapeutic
approach, is important. If it is a hepatocellular carcinoma, the determination of its location and extent including vascular
invasion is necessary.
Comments
1) Scientific statement
There have been few studies in which the diagnostic ability of contrast-enhanced ultrasonography using Sonazoid
(perflubutane microbubbles), an ultrasound contrast-agent presently used in Japan, was compared with that of other
modalities. Concerning the qualitative diagnosis of hepatic lesions in 196 patients, Moriyasu et al. reported that,
when they are divided into hepatocellular carcinoma, liver metastasis, hemangioma, other benign lesions, and other
malignant lesions, the diagnostic accuracy using Sonazoid contrast-enhanced ultrasonography (88.9%) was significantly
higher than that of non-contrast-enhanced ultrasonography (68.4%) or dynamic CT (80.5%) (p<0.001 and p=0.008,
respectively) and that more hepatic lesions were detected by Sonazoid contrast-enhanced than non-contrast-enhanced
ultrasonography or dynamic CT (p<0.001 and p=0.008, respectively). 1) However, they also reported that adverse
effects of Sonazoid were observed relatively frequently, i.e., 10.4% of the patients. Hatanaka et al. compared the
diagnostic abilities of Sonazoid contrast-enhanced ultrasonography and dynamic CT in 74 patients with 108 lesions
of hepatocellular carcinoma and liver metastasis or intrahepatic bile duct cancer and 5 lesions of benign dysplastic
nodule and reported that the sensitivities of the modalities for malignant diseases were 95.4 and 85.2% (p=0.037),
that the diagnostic accuracy was 94.7 and 82.3% (p=0.032), respectively, and that both parameters were significantly
higher in Sonazoid contrast-enhanced ultrasonograpy.2) On the other hand, Mita et al.3) reported that the sensitivity of
Sonazoid contrast-enhanced ultrasonography, dynamic CT, and EOB・Primovist contrast-enhanced MRI for diagnosing
hepatocellular carcinoma based on characteristic contrast enhancement patterns in 34 lesions 2 cm or less in diameter
detected in 29 patients by ultrasonography was 67.6, 52.9, and 76.5%, respectively, showing no significant difference.
Also, according to Goto et al., in a hepatic segment-based evaluation concerning 138 lesions of hepatocellular carcinoma
in 100 patients using dynamic CT as a reference, the sensitivity and specificity of the post-vascular phase (Kupffer
imaging) of Sonazoid contrast-enhanced ultrasonography were 73-83 and 97-98%, but those of B-mode ultrasonography
were 83-84 and 90-94%, respectively; the former was more specific but not more sensitive than the latter.4)
Regarding the diagnosis of hepatocellular carcinoma, in a comparative study of dynamic CT and extracellular
gadolinium-enhanced dynamic MRI for the diagnosis of hypervascular hepatocellular carcinoma, the sensitivity and
positive predictive value were reported to be 66 and 97% by dynamic CT and 63 and 96%, respectively, by dynamic
MRI, showing no difference.5) Recently, there have been a number of studies comparing EOB・Primovist contrastenhanced MRI and dynamic CT. According to some reports, the sensitivity for detecting hepatocellular carcinoma was
67-97% by EOB・Primovist contrast-enhanced MRI and 44-92.8% by dynamic CT, and the Az value on ROC analysis,
sensitivity, and specificity did not differ,6) or the Az value did not differ,7) between the two modalities. However, more
reports indicated that the sensitivity of EOB・Primovist contrast-enhanced MRI was higher8) or significantly higher.7,9-14)
2) Comments
Generally, when an intrahepatic lesion is suggested by ultrasonography, contrast-enhanced ultrasonography, dynamic
CT, or EOB・Primovist contrast-enhanced MRI is presently the examination performed next. Since EOB・Primovist
became available, the use of SPIO contrast-enhanced MRI has become rare. Also, the frequency of the use of
extracellular gadolinium contrast-enhanced MRI for liver tumors has decreased, probably because its diagnostic
4
The Japanese imaging guideline 2013
CQ 061
performance is comparable to that of dynamic CT using an extracellular contrast agent. In diagnosing liver hemangioma,
which is a clinically most frequently encountered benign liver lesion, extracellular gadolinium contrast-enhanced MRI,
which presents delayed contrast enhancement characteristic of hemangioma, is considered to be more advantageous
than EOB・Primovist contrast-enhanced MRI, but there is no report comparing the two modalities.
According to reports to the present, Sonazoid contrast-enhanced ultrasonography is considered to be comparable or
superior to dynamic CT, and EOB・Primovist contrast-enhanced MRI is more often indicated to be comparable or superior
to dynamic CT, in diagnosing hepatocellular carcinoma. Sonazoid contrast-enhanced ultrasonography is not in wide clinical
use, presumably because skilled technicians are deficient, and because the procedure has complicated originally simple
ultrasonography, but this modality is also recommendable from the viewpoint of diagnostic performance.
In patients suspected to have an intrahepatic lesion, dynamic CT is most widely selected as the next examination
due to the high processability of the data despite the radiation exposure and high incidence of adverse reactions to the
contrast agent. From the viewpoint of diagnostic ability, also, dynamic CT is recommended as the next examination of
ultrasonography, but the addition of modalities such as EOB・Primovist contrast-enhanced MRI is necessary when, for
example, surgery is anticipated.
EOB・Primovist contrast-enhanced MRI is recommended because of the highest diagnostic power, but there is no
report evaluating its diagnostic ability in patients with liver dysfunction or obstructive jaundice, in which contrast
enhancement of the liver with EOB・Primovist is reduced, and the possibility of a decline in the diagnostic performance
must be considered in such patients. Also, while equipment with 16 or more detector rows that can perform scanning at
a sufficient speed has become widely available for MDCT, MRI is still often performed using old or low-field-strength
systems, which may provide images unsatisfactory in quality. Therefore, which of CT and MRI should be used needs to
be evaluated at each facility.
For the above reasons, if a hepatic lesion is suspected by ultrasound screening for hepatocellular carcinoma, it is
recommended to perform dynamic CT, EOB・Primovist contrast-enhanced MRI, or Sonazoid contrast-enhanced
ultrasonography as the next examination in consideration of the skill of the technician and performance of the imaging
system at each facility.
Index words and secondary materials used as references
A search of PubMed was performed using “CT”, “MRI”, “sonography”, “US”, “liver”, “hepatocellular carcinoma”,
“HCC”, “sensitivity”, and “accuracy” as key words. The Japan Society of Hepatology ed: Clinical Practice Guidelines
for Hepatocellular Carcinoma 2009 update was also used as a reference.
References
1) Moriyasu F et al: Efficacy of perflubutane microbubble-enhanced ultrasound in the characterization and detection of focal liver lesions: phase 3
multicenter clinical trial. AJR 193: 86-95, 2009 (Level 4)
2) Hatanaka K et al: Sonazoid-enhanced ultrasonography for diagnosis of hepatic malignancies: comparison with contrast-enhanced CT.
Oncology 75 (suppl 1): 42-47, 2008 (Level 4)
3) Mita K et al: Diagnostic sensitivity of imaging modalities for hepatocellular carcinoma smaller than 2 cm. World J Gastroenterol 16: 4187-4192,
2010 (Level 4)
4) Goto E et al: Value of post-vascular phase (Kupffer imaging) by contrast-enhanced ultrasonography using Sonazoid in the detection of hepatocellular carcinoma. J Gastroenterol 47: 477-485, 2012(Level 3)
5) Noguchi Y et al: Detection of hepatocellular carcinoma: comparison of dynamic MR imaging with dynamic double arterial phase helical CT.
AJR 180: 455-460, 2003 (Level 3)
6) Baek CK et al: Hepatocellular carcinoma in patients with chronic liver disease: a comparison of gadoxetic acid-enhanced MRI and multiphasic
MDCT. Clin Radiol 67: 148-156, 2012 (Level 3)
7) Kim SH et al: Gadoxetic acid-enhanced MRI versus triple-phase MDCT for the preoperative detection of hepatocellular carcinoma. AJR 192:
1675-1681, 2009 (Level 2)
8) Kim YK et al: Detection of hepatocellular carcinoma by Gd-EOB-DTPA-enhanced liver MRI: comparison with triple phase 64 detector row helical CT. J Comput Assist Tomogr 33: 844-850, 2009 (Level 4)
9) Sano K et al: Imaging study of early hepatocellular carcinoma: usefulness of gadoxetic acid-enhanced MR imaging. Radiology 261: 834-844,
2011 (Level 2)
10) Di Martino M et al: Intraindividual comparison of gadoxetate disodium-enhanced MR imaging and 64-section multidetector CT in the Detection
of hepatocellular carcinoma in patients with cirrhosis. Radiology 256: 806-816, 2010 (Level 3)
11) Hwang J et al: Small (<=2 cm) hepatocellular carcinoma in patients with chronic liver disease: comparison of gadoxetic acid-enhanced 3.0 T
MRI and multiphasic 64-MDCT. Br J Radiol 85: e314-e322, 2012 (Level 3)
12) Akai H et al: Detection of hepatocellular carcinoma by Gd-EOB-DTPA-enhanced liver MRI: comparison with triple phase 64 detector row helical CT. Eur J Radiol 80: 310-315, 2011 (Level 2)
13) Haradome H et al: Additional value of gadoxetic acid-DTPA-enhanced hepatobiliary phase MR imaging in the diagnosis of early-stage hepatocellular carcinoma: comparison with dynamic triple-phase multidetector CT imaging. J Magn Reson Imaging 34: 69-78, 2011 (Level 3)
14) Onishi H et al: Hypervascular hepatocellular carcinomas: detection with gadoxetate disodium-enhanced MR imaging and multiphasic multidetector CT. Eur Radiol 22: 845-854, 2012 (Level 3)
5
The Japanese imaging guideline 2013
5. Gastrointestinal tract
62
Which modalities are appropriate for detecting early
hepatocellular carcinoma in patients with chronic
liver disease?
Recommendation
grade
C1
Gd-EOB-MRI has a high diagnostic ability for early hepatocellular carcinoma. There
have been few reports on the diagnostic ability of Sonazoid contrast-enhanced
ultrasonography for early hepatocellular carcinoma.
Background/objective
Recently, with the development of imaging diagnostic devices and new contrast agents, the evaluation of targets
other than the blood flow has become possible, and small lesions have begun to be detected frequently in patients
with chronic liver disease. Early hepatocellular carcinoma, which is an unclear nodule 20 mm or less in diameter
representing a hypovascular well-differentiated hepatocellular carcinoma, exhibits diverse features on imaging
studies due to changes in the portal and arterial blood flows in the nodule in the course of its multistage development.
Generally, the disease is often treated in the stage of hypovascular well-differentiated hepatocellular carcinoma, which
is an early hepatocellular carcinoma dedifferentiated from a dysplastic nodule (DN), and further dedifferentiated and
hypervasculated well-differentiated hepatocellular carcinoma. It is important to have knowledge of findings on contrastenhanced ultrasonography, dynamic MDCT, and Gd-EOB-MRI and their diagnostic performance in early hepatocellular
carcinoma.
Comments
1) Scientific statement
In 30 nodules of early hepatocellular carcinoma diagnosed by hepatectomy, ROC analysis of the diagnostic abilities
of dynamic MDCT and Gd-EOB-MRI showed that the Az value, sensitivity, and NPV were significantly higher by GdEOB-MRI (0.98-0.99, 94-97%, and 96.8-98.1%) than by dynamic MDCT (0.87, 58-68%, and 80.7-84.4%, respectively),
that the specificity and PPV showed no significant difference, but that the diagnostic performance of Gd-EOB-MRI for
early hepatocellular carcinoma was significantly higher than that of dynamic MDCT (Table).1)
Also, of the 15 nodules of well-differentiated hepatocellular carcinoma 2 cm or less in diameter diagnosed by biopsy,
67, 40, and 60% were diagnosed by Sonazoid contrast-enhanced ultrasonography, dynamic MDCT, and Gd-EOBMRI, respectively, as hepatocellular carcinoma (a nodule showing contrast enhancement in the arterial phase and
washout in the portal-venous phase or a nodule showing contrast enhancement in the arterial phase, low signal intensity
in the hepatocyte phase of Gd-EOB-MRI, and hypodensity in the Kupffer phase of Sonazoid contrast-enhanced
ultrasonography). The diagnostic abilities of Gd-EOB-MRI and Sonazoid contrast-enhanced ultrasonography for welldifferentiated hepatocellular carcinomas 2 cm or less in diameter have been reported to be higher than that of dynamic
MDCT. However, of these 15 nodules, 5 were considered to be hypovascular, and 3 of them showed hypoattenuation
in the portal-venous phase of MDCT, only 1 of them showed hypoecho in the Kupffer phase of Sonozoid contrastenhanced ultrasonography, and 4 of them showed hypointensity in the hepatocyte phase of Gd-EOB-MRI. Thus,
the evidence concerning the relative diagnostic abilities of these modalities for hypovascular well-differentiated
hepatocellular carcinoma is insufficient.2)
In a multicenter joint research participated in by 15 facilities regarding the diagnostic ability for hepatocellular
carcinoma 2 cm or less in diameter, nodule-by-nodule ROC analysis of 279 hepatocellular carcinomas showed that
the sensitivity of Gd-EOB-MRI (38-55.4% for lesions 10 mm or less in diameter, 71.1-87.3% for those 10-20 mm
in diameter) was higher than that of dynamic MDCT (26.1-47.3% and 65.7-78.4%, respectively). 3) According to
another report on the diagnostic performance for hepatocellular carcinomas 2 cm or less in diameter, the sensitivities
of Sonazoid contrast-enhanced ultrasonography (67.6%) and Gd-EOB-MRI (76.5%) were higher than that of MDCT
(52.9%), but the differences were not significant (Table). However, in the above 2 reports, the evaluation was not
restricted to well-differentiated hepatocellular carcinoma.4)
From these observations, Gd-EOB-MRI is considered to have higher diagnostic ability than MDCT for early
hepatocellular carcinoma. Presently, there is no report providing evidence sufficient for the evaluation of the diagnostic
ability of Sonozoid contrast-enhanced ultrasonography or its comparison with that of MDCT or Gd-EOB-MRI.
2) Comments
Early hepatocellular carcinoma is a well-differentiated hepatocellular carcinoma presenting as an unclear nodule 20
mm or less in diameter. It shows poor tumor angiogenesis and is hypovascular. Its biological malignancy is low, it rarely
shows intrahepatic metastasis or vascular invasion, and its prognosis is favorable.5,6) In hepatocellular carcinoma, the
portal and arterial blood flows in the nodule change in the process of multistage tumorigenesis. In early hepatocellular
6
The Japanese imaging guideline 2013
CQ 062
Table: Abilities of imaging modalities to detect early hepatocellular carcinoma in chronic liver disease patients
Early hepatocellular carcinoma Findings and advantages and disadvantages of each modality
Non-contrast phase
Imaging findings
Contrast-enhanced
Early phase
Shows various echo
patterns due to slight
changes in the blood
Sonazoid cont-
flow.2,17)
rast-enhanced
ultrasonography
Hypoattenuation
nodule:43-47%1,2,14)
Contrast-enhanced
Late phase
Hypoecho in Kupffer
phase: 54-67%2,17)
DN and early HCC
are isoechoic with
hepatic parenchyma
but become
hypoechoic in the
Kupffer phase
through the process
of dedifferentiation.
Early-phase contrast Hypoattenuation
enhancement:
nodule:40-73%1,2,14)
1,4,5,9)
0-60%
Dynamic MDCT
Hyper intensity
T2-signals: 10-32%
Arterial-phase
Hypo intensity
contrast enhancement: in delayed phase:
Fat-containing
0-67%1,4,5,9,10)
nodules:
26-53%1,14,15,17)
47-68%
Advantages
Disadvantages
・Simple and mildly
・Presence of dead
invasive
angles
・Applicable also to
・Detection power
kidney dysfunction
affected by the
patients
patient’s physique
・No exposure
and technician’s
・Real-time evaluaskill
tion of hepatic
blood flow possible
Notes
Detection power
for blood flow
of hepatic
nodules is
significantly higher
than dynamic
CT or MRI with
relatively fixed
imaging timing8,13)
・Wide availability of
MDCT with 16 or
more detector rows
・Essential for
・Exposure
・The use of a
Capable of collecting
blood flow information
・Insufficient availabi- Hepatocyte phase
contrast agent is
difficult in some
qualitative diagnosis
patients with kidney
and determination
dysfunction
of therapeutic approach,
plays primary role
in imaging diagnosis
and evaluating
Low signal intensity
hepatocyte function,
EOB・Primovist
in hepatocyte phase: has high diagnostic
MRI
79-92%1,2,4,5,9,14,15)
power
lity of MRI systems
is significantly
with sufficient
diagnostic power
of 1.5T or higher
・Difficult to perform
in some patients
with implanted
metallic devices or
kidney dysfunction
useful for detecting
small HCC10), EOB
uptake ratio is
useful for discrimination between
well-differentiated
HCC and DN16)
carcinoma, the arterial blood flow is deficient but becomes richer with decreases in the portal blood flow through
the process of dedifferentiation. A tumor in which hypervascular areas develop in the nodule (nodule-in-nodule) is
biologically a small advanced hepatocellular carcinoma even if it is histologically well-differentiated hepatocellular
carcinoma. Some such lesions cause local intrahepatic metastasis or vascular invasion and may have a poor prognosis.7)
Therefore, diagnosing the disease in the stage of hypovascular early hepatocellular carcinoma is considered to contribute
to a better prognosis.
For hyperarterialized moderately or more differentiated hepatocellular carcinoma, various imaging modalities show
similar diagnostic performance, but it tends to be higher in Gd-EOB-MRI than in dynamic MDCT.8) The degree of
malignancy of nodules evaluated by CT with intra-arterial contrast injection and signal intensity in the hepatocyte
phase of Gd-EOB-MRI are correlated with the degree of malignancy of borderline lesions, and the early liver cancer
type was more markedly hypointense and detected more frequently than the DN type. Hepatocyte phase Gd-EOBMRI very sensitively delineates changes in an early stage of multistage carcinogenesis of lesions from DN to early
hepatocellular carcinoma compared with conventional diagnostic methods and has an excellent diagnostic ability for
early hepatocellular carcinoma.9)
In early hepatocellular carcinoma, portal venous and arterial blood in the tumor decreases (Nakajima O:
Morphogenesis and progression of liver cancer 10)). Therefore, the tumor is hypovascular and is expected to be
hypoechoic compared with non-tumoral areas on perfusion imaging of Sonazoid contrast-enhanced ultrasonography,
but no consistent results have been obtained concerning the findings or diagnostic ability of the modality due to the
slightness of blood flow changes. Also, in early hepatocellular carcinoma, the contrast of Kupffer cells is reduced
equally or more mildly compared with non-tumoral areas,11) and not many lesions are visualized as defects in the
Kupffer phase of Sonazoid contrast-enhanced ultrasonography. Therefore, there is presently no report of a high
evidence level concerning the diagnostic ability of Sonazoid contrast-enhanced ultrasonography for early hepatocellular
7
The Japanese imaging guideline 2013
5. Gastrointestinal tract
carcinoma or comparison of its diagnostic performance with other modalities. However, ultrasonography including that
using Sonazoid contrast enhancement is occasionally performed periodically in patients with chronic liver disorders,
and early hepatocellular carcinoma is often delineated as a hypoechoic nodule by reflecting fatty change of cancer cells.
The frequency of detection of such hypoechoic nodules has been reported to be 40% in small hepatocellular carcinomas
10-15 mm in diameter,12) and the detection of such lesions often lead to the diagnosis of early hepatocellular carcinoma.
MDCT and Gd-contrast-enhanced dynamic MRI themselves have high detection sensitivity for arterial blood flow, but
the evaluation of hypovascular early hepatocellular carcinoma requires precise judgment and is often difficult. Reports
of their diagnostic performance also vary widely.
In the papers cited in this CQ, no consensus has been reached regarding the diagnostic ability of Sonazoid contrastenhanced ultrasonography. While the sensitivity of Gd-EOB-MRI for early hepatocellular carcinoma tends to be
higher than that of MDCT, it must be noted that MRI systems capable of high-quality dynamic study were used in the
studies cited in this article and that MRI systems with a low magnetic field strength or deficient in diagnostic ability are
inappropriate for diagnosing early hepatocellular carcinoma. Such MRI systems capable of high-quality dynamic study
are not as widely available as ultrasonographs or MDCT devices, and, in practice, dependence on ultrasonography or
dynamic MDCT is unavoidable in follow-up imaging studies.
Index words and secondary materials used as references
A search of PubMed was performed using “early hepatocellular carcinoma”, “CT”, “EOB MRI”, and “sonazoid
ultrasonography” as key words. The Japan Society of Hepatology ed: Clinical Practice Guidelines for Hepatocellular
Carcinoma 2009 update was also used as a reference.
References
1) Sano K et al: Imaging study of early hepatocellular carcinoma: usefulness of gadoxetic acid-enhanced MR imaging. Radiology 261: 834-844,
2011 (Level 2)
2) Kawada N et al: Improved diagnosis of well-differentiated hepatocellular carcinoma with gadolinium ethoxybenzyl diethylene triamine pentaacetic acid-enhanced magnetic resonance imaging and Sonazoid contrast-enhanced ultrasonography. Hepatol Res 40: 930-936, 2010 (Level
3)
3) Ichikawa T et al: Detection and characterization of focal liver lesions: a Japanese phase III, multicenter comparison between gadoxetic acid
disodium-enhanced magnetic resonance imaging and contrast-enhanced computed tomography predominantly in patients with hepatocellular
carcinoma and chronic liver disease. Invest Radiol 45: 133-141, 2010 (Level 3)
4) Mita K et al: Diagnostic sensitivity of imaging modalities for hepatocellular carcinoma smaller than 2cm. World J Gastroenterol 7: 4187-4192,
2010 (Level 4)
5) Desmet VJ: Pathologic diagnosis of early hepatocellular carcinoma: a report of the international consensus group for hepatocellular neoplasia.
Hepatology 49: 658-664, 2009 (No applicable level)
6) Takayama T et al: Early hepatocellular carcinoma as an entity with a high rate of surgical cure. Hepatology 28: 1241-1246, 1998 (Level 4)
7) Hayashi M et al: Correlation between the blood supply and grade of malignancy of hepatocellular nodules associated with liver cirrhosis:
Evaluation by CT during intraarterial injection of contrast medium. AJR 172: 969-976, 1999 (Level 4)
8) Alaboudy A et al: Usefulness of combination of imaging modalities in the diagnosis of hepatocellular carcinoma using sonazoid-enhanced
ultrasound, gadolinium diethylene-triamine-pentaacetic Acid-enhanced magnetic resonance imaging, and contrast-enhanced computed tomography. Oncology 81: 66-72, 2011 (Level 4)
9) Matsui O et al: Imaging of multi-step hepatocarcinogenesis : imaging, pathophysiologic and molecular correlation. Acta Hepatologica Japonica
52: 415-428, 2011 (No applicable level)
10) Kobayashi K ed.: Gastrointestinal diseases up to date, Consensus & Controversies. p22-26, 1996 (No applicable level)
11) Tanaka M et al: Pathomorphological study of Kupffer cells in hepatocellular carcinoma and hyperplastic nodular lesions in the liver. Hepatology
24: 807-812, 1996 (Level 4)
12) Kutami R et al: Pathomorphologic study on the mechanism of fatty change in small hepatocellular carcinoma of humans. J Hepatol 33: 282289, 2000 (Level 4)
13) Sugimoto K et al: Assessment of arterial hypervascularity of hepatocellular carcinoma: comparison of contrast-enhanced US and gadoxetate
disodium-enhanced MR imaging. Eur Radiol 22: 1205-1213, 2012 (Level 4)
14) Rhee H et al: Gadoxetic acid-enhanced MRI findings of early hepatocellular carcinoma as defined by new histologic criteria. J Magn Reson
Imaging 35: 393-398, 2012 (Level 4)
15) Haradome H et al: Additional value of gadoxetic acid-DTPA-enhanced hepatobiliary phase MR imaging in the diagnosis of early-stage hepatocellular carcinoma: comparison with dynamic triple-phase multidetector CT imaging. J Magn Reson Imaging 34: 69-78, 2011 (Level 3)
16) Kogita S et al: Gd-EOB-DTPA-enhanced magnetic resonance images of hepatocellular carcinoma: correlation with histological grading and
portal blood flow. Eur Radiol 20: 2405-2413, 2010 (Level 4)
17) Arita J et al: Correlation between contrast-enhanced intraoperative ultrasound using Sonazoid and histologic grade of resected hepatocellular
carcinoma. AJR 196: 1314-1321, 2011 (Level 4)
8
The Japanese imaging guideline 2013
CQ 063
63
What is appropriate management for nodules in
patients with chronic liver disease that show no early
contrast enhancement?
Recommendation
grade
C1
Biopsy may be considered for nodules 10-15 mm in diameter. Nodules less than
10 mm in diameter should be followed up every 3-6 months by contrast-enhanced
imaging (EOB contrast-enhanced MRI, dynamic CT, or Sonazoid contrast-enhanced
ultrasonography), and biopsy or treatment may be considered if they are found to
have grown. Particularly, if early contrast-enhancement appears during follow-up, the
nodule may be treated as hypervascular hepatocellular carcinoma.
Background/objective
The frequency of detection of nodules that show no early contrast-enhancement on contrast-enhanced imaging studies
(hypovascular nodules) in high risk groups for hepatocellular carcinoma is considered to be increasing due to the
recent improvements in the performance of imaging modalities. Hypovascular nodules include benign lesions such
as hyperplastic nodules and regenerative nodules, precancerous lesions, and early hepatocellular carcinoma, and their
management is controversial.1)
Comments
According to a retrospective study of 130 hypovascular nodules that were hypointense in the hepatocyte phase
of EOB・Primovist contrast-enhanced MRI, 2) the 2- and 3-year cumulative incidences of the development into
classic hepatocellular carcinoma were 11.1 and 15.9%, respectively. Hypovascular nodules are unlikely to affect
the life prognosis in a short period. However, as they include precancerous lesions and hepatocellular carcinomas
at considerable percentages, if hypovascular nodules are detected in patients with chronic liver disease, histological
diagnosis or subsequent follow-up is necessary.
There have been few studies that provide sufficient evidence concerning the diagnostic principles for hypovascular
nodules, and the diagnostic/therapeutic algorithms shown in the Scientific-Evidence-Based Clinical Practice Guidelines
for Hepatocellular Carcinoma3) published in Japan and domestic and international guidelines including those of the
American Association for the Study of Liver Diseases (AASLD),4) Asian Pacific Association for the Study of the Liver,5)
and European Society for Medical Oncology6) are based on experts’ opinions. All these guidelines recommend followup by biopsy or, after a short period (3 months by the Japanese and AASLD guidelines), contrast-enhanced imaging
(CT, MRI, ultrasonography) if early contrast enhancement and washout, which are findings of classic hepatocellular
carcinoma, are not detected by contrast-enhanced CT or MRI. According to the guidelines of the Japan Society of
Hepatology, masses 2 cm or less in diameter that do not show typical imaging findings of hepatocellular carcinoma and
are unlikely to be other malignancies are targets of follow-up.3) Moreover, if early contrast enhancement appears on
various contrast-enhanced studies, or a significant growth is observed, during follow-up, the nodules may be regarded
as having developed into hepatocellular carcinoma and treated without biopsy. No criterion for a significant growth rate
has been established. Willat et al. observed that nodules that show no early contrast enhancement and no enlargement
over 2 years or longer are considered to be benign.7) However, caution is necessary, because some well-differentiated
hepatocellular carcinomas grow very slowly.7)
The necessity of biopsy varies among guidelines. The guidelines by the AASLD recommend periodic and repeated
biopsies for nodules 1 cm or greater in diameter, but, in Japan, biopsy is not always considered necessary, and whether
or not biopsy should be performed is determined practically by the policy of each facility.
The primary objective of surveillance of hepatocellular carcinoma is to detect hypervascular nodules. As modalities
that fulfill this objective and sensitively visualize hypovascular nodules with mild invasion, EOB・Primovist contrastenhanced MRI8,9) and contrast-enhanced ultrasonography using Sonazoid, a second-generation low-sound-pressure
ultrasound contrast agent, are considered appropriate for the follow-up of hypovascular nodules.10) However, there
has been no evaluation comparing different modalities concerning the detection power for hypovascular nodules or
differentiation between benign and malignant lesions.
In the retrospective study by Libbrecht et al.,1) 115 patients in whom hepatocellular carcinoma was excluded by biopsy
were evaluated, and some of them are considered to have had hypovascular nodules detected by imaging studies.
The lesions developed into hepatocellular carcinoma after a mean follow-up period of 107±46 months in 16 patients
(14%). In addition, factors associated with the progression of non-cancerous lesions into hepatocellular carcinomas
in patients with chronic liver disease were an age of 55 years or higher, liver cirrhosis, and detection of atypical cells
on pathological examination of the nodule. Imaging findings in individual hypovascular nodules that make their
9
The Japanese imaging guideline 2013
5. Gastrointestinal tract
development into hypervascular hepatocellular carcinomas more likely are reported to include (1) hypointensity in the
hepatocyte phase of EOB・Primovist contrast-enhanced MRI, (2) hyperintensity on T2-weighted MRI, (3) presence of
fat components, and (4) a diameter of 10-15 mm or larger at detection.7,11-14) Examination of these factors are considered
to contribute to the judgment of whether or not hypovascular nodules should be biopsied or treated. Additionally, for the
evaluation of the presence or absence of early contrast enhancement, images should always be evaluated with attention
to the appropriateness of imaging conditions of dynamic study (injection rate of the contrast agent, imaging timing).
Index words and secondary materials used as references
A search of PubMed was performed using “hypovascular” and “hepatocellular carcinoma” as key words. The Japan
Society of Hepatology ed: Clinical Practice Guidelines for Hepatocellular Carcinoma 2009 was also used as a reference.
References
1) Libbrecht L et al: Predictive value of liver cell dysplasia for development of hepatocellular carcinoma in patients with non-cirrhotic and cirrhotic
chronic viral hepatitis. Histopathology 39: 66-73, 2001 (Level 2)
2) Akai H et al: Fate of hypointense lesions on Gd-EOB-DTPA-enhanced magnetic resonance imaging. Eur J Radiol, 2012 (Level 4)
3) The Japan Society of Hepatology: Scientific-Evidence-Based Clinical Practice Guidelines for Hepatocellular Carcinoma. KANEHARA & Co.,
Ltd., 2009 (Level 5)
4) Bruix J et al: Management of hepatocellular carcinoma: an update. Hepatology 53: 1020-1022, 2011 (Level 5)
5) Omata M et al: Asian Pacific Association for the Study of the Liver consensus recommendations on hepatocellular carcinoma. Hepatol Int 4:
439-474, 2010 (Level 5)
6) Jelic S et al: Hepatocellular carcinoma: ESMO Clinical Practice Guidelines for diagnosis, treatment and follow-up. Ann Oncol 21 suppl 5: v5964, 2010 (Level 5)
7) Willatt JM et al: MR Imaging of hepatocellular carcinoma in the cirrhotic liver: challenges and controversies. Radiology 247: 311-330, 2008
(Level)
8) Akai H et al: Detection of hepatocellular carcinoma by Gd-EOB-DTPA-enhanced liver MRI: comparison with triple phase 64 detector row helical CT. Eur J Radiol 80: 310-315, 2011 (Level 2)
9) Ichikawa T et al: Detection and characterization of focal liver lesions: a Japanese phase III, multicenter comparison between gadoxetic acid
disodium-enhanced magnetic resonance imaging and contrast-enhanced computed tomography predominantly in patients with hepatocellular
carcinoma and chronic liver disease. Invest Radiol 45: 133-141, 2010 (Level 3)
10) Moriyasu F et al: Efficacy of perflubutane microbubble-enhanced ultrasound in the characterization and detection of focal liver lesions: phase 3
multicenter clinical trial. AJR 193: 86-95, 2009 (Level 3)
11) Kumada T et al: Evolution of hypointense hepatocellular nodules observed only in the hepatobiliary phase of gadoxetate disodium-enhanced
MRI. AJR 197: 58-63, 2011 (Level 2)
12) Kobayashi S et al: Gadolinium ethoxybenzyl diethylenetriamine pentaacetic Acid-enhanced magnetic resonance imaging findings of borderline
lesions at high risk for progression to hypervascular classic hepatocellular carcinoma. J Comput Assist Tomogr 35: 181-186, 2011 (Level 3)
13) Motosugi U et al: Outcome of hypovascular hepatic nodules revealing no gadoxetic acid uptake in patients with chronic liver disease. J Magn
Reson Imaging 34: 88-94, 2011 (Level 2)
14) Yu JS et al: Fat-containing nodules in the cirrhotic liver: chemical shift MRI features and clinical implications. AJR 188: 1009-1016, 2007 (Level
2)
10
The Japanese imaging guideline 2013
CQ 064
64
Which modalities are appropriate for the diagnosis of
classic (hypervascular) hepatocellular carcinoma?
Recommendation
grade
B
C2
B
Sonazoid contrast-enhanced ultrasonography, contrast-enhanced dynamic CT,
EOB・Primovist contrast-enhanced MRI
C2 Angiography including CTAP and CTHA
Sonazoid contrast-enhanced ultrasonography, contrast-enhanced dynamic CT, and
EOB・Primovist contrast-enhanced MRI are all useful for the diagnosis of classic
(hypervascular) hepatocellular carcinoma and are recommended to be performed.
Particularly, EOB ・ Primovist contrast-enhanced MRI shows high diagnostic
performance. However, angiography (CTAP, CTHA) should not be performed for the
diagnosis alone and should be performed in combination with therapeutic procedures
such as TACE.
Background/objective
Classic hepatocellular carcinoma is defined as advanced hepatocellular carcinoma with a macroscopically clear border
and is hypervascular on imaging. The usefulness of Sonazoid contrast-enhanced ultrasonography, contrast-enhanced
dynamic CT, EOB・Primovist contrast-enhanced MRI, and angiography including CTAP and CTHA for the diagnosis
of classic hepatocellular carcinoma is evaluated on the basis of the latest evidence.
Comments
For the imaging diagnosis of hepatocellular carcinoma, in addition to conventional contrast-enhanced CT, contrastenhanced ultrasonography using Sonazoid, a second-generation ultrasound contrast agent, began to be covered by
insurance in January 2007. Regarding MRI, EOB・Primovist (gadoxetate disodium preparation), a hepatocyte-specific
contrast agent, began to be covered by insurance in December 2007.
For contrast-enhanced dynamic CT, MDCT has spread to many facilities, and it is superior to MRI in consistency
of image quality and time required for imaging (10-15 min/examination). Since each scan can be finished in several
seconds, deterioration of image quality is unremarkable even in patients incapable of breath-holding. Its diagnostic
power is also sufficient for the diagnosis of classic hepatocellular carcinomas 1 cm or greater in diameter.1,2)
EOB・Primovist contrast-enhanced MRI has been reported to be superior to contrast-enhanced dynamic CT for the
diagnosis of hypervascular hepatocellular carcinoma by a comparative study using AFROC analysis. 1) Also, many
comparative studies on the diagnostic ability of EOB・Primovist contrast-enhanced MRI and contrast-enhanced dynamic
CT for hepatocellular carcinoma not restricted to classic hepatocellular carcinoma have been performed, all reporting
superiority of MRI with or without statistical significance.2-6)
However, reports on the diagnostic performance of Sonazoid contrast-enhanced ultrasonography are still scarce. In
a study comparing the diagnostic performance of Sonazoid contrast-enhanced ultrasonography, contrast-enhanced
dynamic CT, and EOB・Primovist contrast-enhanced MRI for hepatocellular carcinoma, the diagnostic accuracy was
72, 74, and 86%, respectively, with no significant difference.7) Also, when the diagnostic power for liver tumors was
compared between Sonazoid contrast-enhanced ultrasonography and contrast-enhanced dynamic CT, the number of
hepatocellular carcinomas (not restricted to classic hepatocellular carcinomas) detected was 261 and 257, and the
discrimination rate of hepatocellular carcinoma was 92.6 and 89.3%, respectively, neither with a significant difference.8)
On the other hand, in a comparative study using malignant tumors of the liver, of which hepatocellular carcinoma was
dominant (90/108 nodules), the detection sensitivity was 95.4 and 85.2%, and the diagnostic accuracy was 94.7 and
82.3%, by contrast-enhanced ultrasonography and contrast-enhanced dynamic CT, respectively, indicating significant
superiority of ultrasonography.9)
Angiography has been used for the diagnosis of hepatocellular carcinoma from early days of diagnostic imaging.
Recently, the IVR-CT system integrating a flat panel detector angiography machine with an MDCT machine has
been applied clinically. The diagnostic ability for hepatocellular carcinoma by CTAP and double-phase CTHA using
a 4-channel MDCT system has been reported to be excellent with a sensitivity of 93% and a specificity of 97%.10)
However, recent reports of comparisons with other modalities are few. 11) In a study comparing angiography and
contrast-enhanced dynamic CT using single-slice CT, the detection sensitivity of CTAP+CTHA (99%) was superior to
that of contrast-enhanced dynamic CT (68%).12) EOB・Primovist contrast-enhanced MRI shows a very high diagnostic
ability due partly to the marked improvements in the performance of recent MRI systems. However, to obtain
sufficiently diagnostic images, high-end equipment with a magnetic field strength of 1.5T or higher is essential, and
11
The Japanese imaging guideline 2013
5. Gastrointestinal tract
appropriate determination of the imaging sequence and parameters and conditions for injection of the contrast agent is
also important. Therefore, the modality does not necessarily ensure excellent diagnostic performance at all facilities.
Furthermore, MRI requires 30-45 minutes for one examination, and, at many facilities, it is considered difficult
to perform MRI in all high-risk patients for hepatocellular carcinoma. The diagnostic ability of contrast-enhanced
ultrasonography has been improved further, particularly, since second-generation contrast agents became available.
Presently, reports on comparative evaluation of contrast-enhanced ultrasonography for hepatocellular carcinoma are
limited but are expected to increase for the future.
While angiography including CTAP and CTHA is very useful for the diagnosis of classic hepatocellular carcinoma,
it is more invasive than other modalities as it requires selective catheterization of the hepatic or superior mesenteric
artery. Therefore, with improvements in the diagnostic performance of other modalities, situations in which CTHA and
CTAP are performed exclusively for diagnostic purposes have decreased, and they are mostly performed recently with
therapeutic procedures such as TACE.
In conclusion, all modalities are sufficiently useful for the diagnosis of classic hepatocellular carcinoma, but it is
unnecessary to perform all examinations, and appropriate ones should be selected depending on the circumstances of the
facility and patient’s condition. Also, it may be necessary to combine multiple examinations depending on the situation.
Index words and secondary materials used as references
A search of PubMed was performed using “hepatocellular carcinoma”, “sensitivity”, “contrast-enhanced”,
“Sonazoid US”, “contrast-enhanced”, “multiphasic”, “MDCT”, “CT”, “gadoxetate”, “gadoxetic”, “Gd-EOB-DTPA”,
“ethoxybenzy”, “Primovist”, “MR”, “magnetic resonance”, “CTHA”, “CT”, “hepatic arteriography”, and “transcatheter
angiography” as key words. The Japan Society of Hepatology ed: Clinical Practice Guidelines for Hepatocellular
Carcinoma 2009 was also used as a reference.
References
1) Onishi H et al: Hypervascular hepatocellular carcinomas: detection with gadoxetate disodium-enhanced MR imaging and multiphasic multidetector CT. Eur Radiol 22: 845-854, 2012 (Level 3)
2) Kim SH et al: Gadoxetic acid-enhanced MRI versus triple-phase MDCT for the preoperative detection of hepatocellular carcinoma. AJR 192:
1675-1681, 2009 (Level 2)
3) Di Martino M et al: Intraindividual comparison of gadoxetate disodium-enhanced MR imaging and 64-section multidetector CT in the Detection
of hepatocellular carcinoma in patients with cirrhosis. Radiology 256: 806-816, 2010 (Level 3)
4) Kim YK et al: Detection of hepatocellular carcinoma: gadoxetic acid-enhanced 3-dimensional magnetic resonance imaging versus multi-detector row computed tomography. J Comput Assist Tomogr 33: 844-850, 2009 (Level 4)
5) Akai H et al: Detection of hepatocellular carcinoma by Gd-EOB-DTPA-enhanced liver MRI: comparison with triple phase 64 detector row helical CT. Eur J Radiol 80: 310-315, 2011 (Level 2)
6) Baek CK et al: Hepatocellular carcinoma in patients with chronic liver disease: a comparison of gadoxetic acid-enhanced MRI and multiphasic
MDCT. Clin Radiol 67: 148-156, 2012 (Level 3)
7) Alaboudy A et al: Usefulness of combination of imaging modalities in the diagnosis of hepatocellular carcinoma using sonazoid?-enhanced
ultrasound, gadolinium diethylene-triamine-pentaacetic Acid-enhanced magnetic resonance imaging, and contrast-enhanced computed tomography. Oncology 81 (suppl 1): 66-72, 2011 (Level 4)
8) Moriyasu F et al: Efficacy of perflubutane microbubble-enhanced ultrasound in the characterization and detection of focal liver lesions: phase 3
multicenter clinical trial. AJR 193: 86-95, 2009 (Level 4)
9) Hatanaka K et al: Sonazoid-enhanced ultrasonography for diagnosis of hepatic malignancies: comparison with contrast-enhanced CT.
Oncology 75 (suppl 1) : 42-47, 2008 (Level 4)
10) Tsurusaki M et al: Combination of CT during arterial portography and double-phase CT hepatic arteriography with multi-detector row helical CT
for evaluation of hypervascular hepatocellular carcinoma. Clin Radiol 62: 1189-1197, 2007 (Level 4)
11) Imai Y et al: Hypervascular hepatocellular carcinoma: combined dynamic MDCT and SPIO-enhanced MRI versus combined CTHA and CTAP.
Hepatol Res 38: 147-158, 2008 (Level 3)
12) Hori M et al: Sensitivity in detection of hypervascular hepatocellular carcinoma by helical CT with intra-arterial injection of contrast medium,
and by helical CT and MR imaging with intravenous injection of contrast medium. Acta Radiol 39: 144-151, 1998 (Level 4)
12
The Japanese imaging guideline 2013
CQ 065
65
Is CTHA/CTAP or angiography appropriate as
a preoperative examination for hepatocellular
carcinoma?
Recommendation
grade
C1
D
C1 CTHA/CTAP
D Angiography
CTHA/CTAP may be considered when preoperative evaluation by non-invasive
modalities such as CT and MRI is judged to be insufficient.
It is not recommended to perform angiography alone for examination.
Background/objective
Angiography used to be a standard preoperative examination for liver tumors. CT during hepatic arteriography (CTHA)
and CT during arterial portography (CTAP) are techniques developed primarily in Japan and were performed for the
evaluation of multiple lesions, detection of intrahepatic metastases, and diagnosis of portal and hepatic vein invasion. A
combination of CTHA and CTAP (CTHA+CTAP) has been regarded the most precise of the preoperative examinations
for liver tumors, but it has limitations including high invasiveness, radiation exposure, and need for special equipment
such as IVR-CT. The positions of angiography and CTHA/CTAP have changed with the recent development of the
technique of contrast-enhanced CT, increases in the number of detector rows, and advent of liver-specific contrast agent
for MRI. The significance of these modalities as preoperative examinations is evaluated.
Comments
Angiography including digital subtraction angiography (DSA) is an invasive examination. Although it was a standard
preoperative examination in the 1980s (Figure 1), its diagnostic performance has recently become inferior to that of
contrast-enhanced dynamic CT regarding hypervascular hepatocellular carcinoma alone (number of nodules detected out
of 98 nodules: 92 by CT, 53 by DSA),1) (sensitivity/specificity: 86.8 and 92.8% by CT; 69 and 91.5%, respectively, by
DSA),2) and the sensitivity has been reported to be 33% by comparison with findings in all hepatectomy samples.3) Also,
by comparison with findings in all hepatectomy samples, the sensitivity was inferior to that of CTAP (85% for CTAP, 67%
for DSA)4) (Figure 2) and particularly low in well-differentiated lesions2) and lesions 2 cm or less in diameter. The use
of the modality for examination alone is not recommended by the guidelines of the American Association for the Study
of Liver Diseases (AASLD) or European Association for the Study of the Liver (EASL) concerning the diagnosis and
treatment of hepatocellular carcinoma or the Clinical Practice Guidelines for Hepatocellular Carcinoma 2009 of Japan.
Intra-arterial contrast-enhanced CT (CTHA and CTAP) is a technique of performing CT during selective angiography
by injecting a contrast agent into an artery via a catheter. The technique, also called intra-arterial CT or angiographic
CT, was developed primarily in Japan and was also regarded as the most precise preoperative examination primarily
for metastatic liver tumors in Western countries in the 1980s to the early 1990s. Recently, however, it has nearly ceased
to be used due to the improvements in non-invasive examinations. For hepatocellular carcinoma, the Clinical Practice
Guidelines for Hepatocellular Carcinoma 2009 mention the procedure as an optional examination without clearly
defining its role or significance, and it has not been recommended as a preoperative examination by international
guidelines. However, there have been a number of reports indicating its usefulness for the differentiation of small
lesions and estimation of the degree of differentiation of hepatocellular carcinoma,5-8) and the procedure is performed at
many facilities in Japan.
The diagnostic ability of CTHA+CTAP for hepatocellular carcinoma has often been reported to be superior to that
of contrast-enhanced dynamic CT9-13) (sensitivity: 99% vs. 68%)9) (sensitivity/specificity in non-tumor-bearing liver
segments: 90.6/97.4% vs. 75.4/94.9%),11) but there are also reports that the two modalities are comparable (sensitivity/
specificity: 60/99.7% vs. 58/98.8%) and that the significance of the addition of CTHA+CTAP to dynamic CT is
meager (sensitivity of dynamic CT and dynamic CT+ CTHA+CTAP: 94 vs. 97%).13) The difference in the diagnostic
performance may be narrowed by the recent increase in the number of detector rows of CT devices and development of
the imaging technique in contrast-enhanced dynamic CT, but data available for the evaluation are deficient.
As for comparison with dynamic MRI using an extracellular gadolinium-based contrast agent, there are reports that
CTHA+CTAP is superior to dynamic MRI9,10,14) (sensitivity/positive predictive value: 99/83 vs. 76/91%)9) (sensitivity in
tumor-bearing liver segments: 89 vs. 75%)14) and that they are comparable (sensitivity in tumor-bearing liver segments/
specificity in non-tumor-bearing liver segments: 94/92 vs. 90/99%).15) Compared with MRI using superparamagnetic
iron oxide (SPIO) nanoparticles as a liver-specific contrast agent, CTHA+CTAP has been reported to be superior
(sensitivity/specificity in non-tumor-bearing liver segments: 90.6/97.4 vs. 77.2/98.5%)11) and to be comparable (sensitivity
13
The Japanese imaging guideline 2013
5. Gastrointestinal tract
A(1)
B(1)
A(2)
B(2)
B(3)
Figure 1: Hepatocellular carcinoma
A (1) Early phase angiographic image of the common hepatic artery, (2) Late phase angiographic image of the
common hepatic artery: Tumor angiogenesis and tumor stain are observed in distal areas of the posterior segmental
branches of the right hepatic artery ( → ). B (1) CTAP, (2)CTHA Early phase, (3)CTHA Late phase: CTAP shows a
perfusion defect, and CTHA shows uneven tumor stain in the early phase and washout and corona-like staining in the
late phase, in the posterior segment of the right hepatic lobe. The margin of the perfusion defect is nearly in agreement
with the corona-like staining.
in tumor-bearing liver segments/specificity in non-tumor-bearing liver segments of CTHA+CTAP and SPIO contrastenhanced MRI : 90.8/96.2 vs. 89.7/98.5%).16) There is also a report that the diagnostic performance can be improved
by a combination of contrast-enhanced dynamic CT and SPIO contrast-enhanced MRI to a level comparable to
CTHA+CTAP (sensitivity/positive predictive value of CTHA+CTAP and SPIO contrast-enhanced MRI+ dynamic CT:
92.4 vs. 95.5%).17) The diagnostic performance of CTAP alone has also been reported to be comparable to that of SPIO
contrast-enhanced MRI.18) While the diagnostic performance of a combination of dynamic MRI using an extracellular
gadolinium-based contrast agent and SPIO contrast-enhanced MRI has been reported to exceed that of CTHA+CTAP,19)
this combination remains a problem in reimbursement under the medical insurance system in Japan.
Concerning comparison with the liver-specific contrast agent Gd-EOB-DTP, the use of which has recently been
approved, the ability of Gd-EOB-DTPA contrast-enhanced MRI to discriminate between hepatocellular carcinoma 2
cm or less in diameter and atypical nodules has been reported to exceed that of CTHA+CTAP,12) but data presently
available for the evaluation are scarce. Gd-EOB-DTPA contrast-enhanced MRI is considered to have an improved
diagnostic ability primarily for well-differentiated hepatocellular carcinoma. While confusion in pathological diagnostic
criteria for well-differentiated hepatocellular carcinoma has been gradually resolved, whether or not the detection of
well-differentiated hepatocellular carcinoma improves the outcome remains controversial, and the clinical significance
of nodules detected only in the hepatocyte phase 20 minutes after the contrast agent administration has not been
established. Compared with conventional extracellular contrast agents, Gd-EOB-DTPA has lower gadolinium content,
which may reduce the ability to detect hypervascularization of tumors or hypervascular intrahepatic metastases. Further
accumulation of data is necessary for comparison between CTHA+CTAP and Gd-EOB-DTPA contrast-enhanced MRI.
In CTHA and CTAP, the equipment of the facility and skill of image readers must be considered. By CTAP alone, false
14
The Japanese imaging guideline 2013
CQ 065
A
B(1)
B(2)
Figure 2: Hepatocellular carcinoma
A Angiography of the common hepatic artery The lesion is difficult to find in the lateral segment of the left lobe. B (1)CTAP (2)CTHA: A clear perfusion defect is observed in S2 ( → ). In the early phase of CTHA, clear nodular contrast enhancement is
observed at the same site.
positive results have been reported to increase (sensitivity/specificity by CTAP and CTAP+DSA: 75/60 vs. 84/81%),20)
and the diagnostic performance is considered to be improved by combining CTHA and CTAP. IVR-CT integrating
angiographic and CT systems is desirable, but a combination of arteriography and CTAP may also be considered
depending on the composition of diagnostic modalities at the facility. Also, on CTAP, intra-arterial injection of a
vasodilator immediately before injection of the contrast agent reportedly increases the contrast of the normal hepatic
parenchyma, reduces unevenness of contrast enhancement, and improves the contrast relative to the tumor. On CTHA,
the diagnostic ability has been reported to be improved by examining the early and late phases.21,22) In both CTHA
and CTAP, the evaluation of optimization or individualization of the contrast-enhancing and imaging protocols is
insufficient. Moreover, in both modalities, contrast enhancement is poor in vessels other than the hepatic artery, portal
vein, and hepatic vein and organs other than the liver. The modalities are inappropriate for the evaluation of lymph node
metastasis, tumor embolism of the inferior vena cava, metastasis to other organs, and concurrence of other diseases, for
which separate evaluation usual contrast-enhanced CT or dynamic CT is necessary.
Recently, the clinical application of CTAP and CTHA by cone-beam CT using a flat panel detector (FPD) angiography
machine has been initiated. The technique has been reported to be useful as a method to assist manipulations and
diagnosis and examine the drug distribution in treatments using an intra-arterial catheter but has not been evaluated
as a preoperative examination. Presently, its usefulness as a preoperative examination for hepatocellular carcinoma is
unknown.
Index words and secondary materials used as references
A search of PubMed was performed using “angiographically assisted CT”,“CT during arterial portography”, “CT
during arterioportography”, “CT during hepatic angiography”, “digital subtraction angiography”, “detection”, “EOB”,
“gadoxetic acid”, “hepatocellular carcinoma”, “preoperative”, “primovist”, “sensitivity”, “superparamagnetic iron
oxide”, and “SPIO” as key words. Also, the AASLD and EASL guidelines and the Japan Society of Hepatology ed:
Clinical Practice Guidelines for Hepatocellular Carcinoma 2009 were also used as references. Reports in which CTHA/
CTAP was used as a standard reference were excluded. The evidence level of papers evaluating the diagnostic ability for
liver tumors in general was reduced by 1 grade.
References
1) Zheng XH et al: Detection of hypervascular hepatocellular carcinoma: comparison of multi-detector CT with digital subtraction angiography and
Lipiodol CT. World J Gastroenterol 14: 200-203, 2005 (Level 4)
2) Nakayama A et al: Value of lipiodol computed tomography and digital subtraction angiography in the era of helical biphasic computed tomography as preoperative assessment of hepatocellular carcinoma. Ann Surg 234: 56-62, 2001 (Level 3)
3) Krinsky GA et al: Dysplastic nodules and hepatocellular carcinoma: sensitivity of digital subtraction hepatic arteriography with whole liver
explant correlation. J Comput Assist Tomogr 24: 628-634, 2000 (Level 3)
4) Spreafico C et al: Hepatocellular carcinoma in patients who undergo liver transplantation: sensitivity of CT with iodized oil. Radiology 203: 457460, 1997 (Level 3)
15
The Japanese imaging guideline 2013
5. Gastrointestinal tract
5) Hayashi M et al: Progression to hypervascular hepatocellular carcinoma: correlation with intranodular blood supply evaluated with CT during
intraarterial injection of contrast material. Radiology 225: 143-149, 2002 (No applicable level)
6) Matsui O. Imaging of multistep human hepatocarcinogenesis by CT during intra-arterial contrast injection. Intervirology 47: 271-276, 2004
(Level 5)
7) Asayama Y et al: Imaging of cholangiolocellular carcinoma of the liver. Eur J Radiol 75: e120-125, 2010 (Level 5)
8) Miura F et al: Hemodynamics of intrahepatic cholangiocarcinoma: evaluation with single-level dynamic CT during hepatic arteriography.
Abdom Imaging 29: 467-471, 2004 (Level 5)
9) Hori M et al: Sensitivity in detection of hypervascular hepatocellular carcinoma by helical CT with intra-arterial injection of contrast medium,
and by helical CT and MR imaging with intravenous injection of contrast medium. Acta Radiol 39: 144-151, 1998 (Level 3)
10) Pugacheva O et al: Detection of small hypervascular hepatocellular carcinomas by EASL criteria: comparison with double-phase CT during
hepatic arteriography. Eur J Radiol 80: e201-206, 2011 (Level 4)
11) Yukisawa S et al: Multidetector helical CT plus superparamagnetic iron oxide-enhanced MR imaging for focal hepatic lesions in cirrhotic liver: a
comparison with multi-phase CT during hepatic arteriography. Eur J Radiol 61: 279-289, 2007 (Level 3)
12) Sano K et al: Imaging study of early hepatocellular carcinoma: usefulness of gadoxetic acid-enhanced MR imaging. Radiology 261: 834-844,
2011 (Level 2)
13) Jang HJ et al: Hepatocellular carcinoma: are combined CT during arterial portography and CT hepatic arteriography in addition to triple-phase
helical CT all necessary for preoperative evaluation? Radiology 215: 373-380, 2000 (Level 2)
14) Kanematsu M et al: Detection of hepatocellular carcinoma in patients with cirrhosis: MR imaging versus angiographically assisted helical CT.
AJR 169: 1507-1515, 1997 (Level 2)
15) Choi D et al: Detection of hepatocellular carcinoma: combined T2-weighted and dynamic gadolinium-enhanced MRI versus combined CT during arterial portography and CT hepatic arteriography. J Comput Assist Tomogr 25: 777-785, 2001 (Level 3)
16) Tanimoto A et al: Superparamagnetic iron oxide-enhanced MR imaging for focal hepatic lesions: a comparison with CT during arterioportography plus CT during hepatic arteriography. J Gastroenterol 40: 371-380, 2005 (Level 2)
17) Imai Y et al: Hypervascular hepatocellular carcinoma: Combined dynamic MDCT and SPIO-enhanced MRI versus combined CTHA and CTAP.
Hepatol Res 38: 147-158, 2008 (Level 2)
18) Vogl TJ et al: Preoperative evaluation of malignant liver tumors: comparison of unenhanced and SPIO (Resovist)-enhanced MR imaging with
biphasic CTAP and intraoperative US. Eur Radiol 13: 262-272, 2003 (Level 4)
19) Kwak HS et al: Preoperative detection of hepatocellular carcinoma: comparison of combined contrast-enhanced MR imaging and combined
CT during arterial portography and CT hepatic arteriography. Eur Radiol 14: 447-457, 2004 (Level 4)
20) Steingruber IE et al: Pretransplantation evaluation of the cirrhotic liver with explantation correlation: accuracy of CT arterioportography and
digital subtraction hepatic angiography in revealing hepatocellular carcinoma. AJR 181: 99-108, 2003 (Level 3)
21) Murakami T et al: Double phase CT during hepatic arteriography for diagnosis of hepatocellular carcinoma. Eur J Radiol 54: 246-252, 2005
(Level 3)
22) Matsuo M et al: Pre-operative detection of malignant hepatic tumours: value of combined helical CT during arterial portography and biphasic
CT during hepatic arteriography. Clin Radiol 56: 138-145, 2001 (Level 3)
16
The Japanese imaging guideline 2013
CQ 066
66
Which modality is appropriate to discriminate
pseudotumors due to arterioportal shunting from
hepatocellular carcinoma?
Recommendation
grade
B
Contrast-enhanced MRI using the liver-specific contrast agent SPIO (Resovist)
or EOB is recommended as useful for the diagnosis of pseudotumors due to
arterioportal shunting.
Background/objective
Arterioportal (AP) shunting is a condition in which arterial blood enters the hepatic sinusoids via the portal vein,
which may be idiopathic or caused by liver cirrhosis, hepatectomy, biopsy, or tumor (hepatocellular carcinoma, hepatic
angioma, metastatic liver tumor, etc.). Particularly, if an AP shunt complicating liver cirrhosis is detected as early
contrast enhancement by dynamic contrast-enhanced CT or dynamic contrast-enhanced MRI using an extracellular
gadolinium-based contrast agent, it must be discriminated from hepatocellular carcinoma. Therefore, if a mildly invasive
examination that can accurately diagnose AP shunts can be selected, unnecessary treatments and excessive examinations
can be avoided.
Comments
Typical images of AP shunts complicating liver cirrhosis are isoechoic on B mode ultrasonography, isoattenuation
on plain CT, isointense on T1- and T2-weighted imaging of MRI, wedge-shaped early staining on the liver margin in
the arterial phase, and isoenhancement with the surrounding liver parenchyma in the late phase, on dynamic contrastenhanced CT or dynamic contrast-enhanced MRI.1-3) They are imaged as a poorly contrasted area on CT during
arterioportography (CTAP), and as a more intensely or equally contrasted area on CT during hepatic arteriography
(CTHA), compared with the surrounding liver parenchyma.4) AP shunts can be readily diagnosed if such characteristic
findings are obtained. However, they may be visualized, though infrequently, as hyperintense areas on T2-weighted
imaging.2,5) Moreover, if an AP shunt is delineated as nodular early contrast enhancement in the liver parenchyma (Figure
A), or if a hepatocellular carcinoma shows unclear washout in the equilibrium phase of dynamic contrast-enhanced
CT or MRI, the differentiation between AP shunt and hepatocellular carcinoma may be difficult.1,3,6,7) In addition, the
concentration of AFP, a tumor marker, may increase in patients with multiple AP shunts complicating chronic liver
disease, also making their differentiation by blood tests difficult.8)
Takayasu et al. observed that many of multiple AP shunts complicating chronic liver disease disappear within 4
months and reported the importance of follow-up.8) Early delineation of the portal branches in the area of early contrast
enhancement in the arterial phase of dynamic contrast-enhanced CT is considered to be a finding specific to AP
shunting, but there has been no recent report concerning its delineation rate in a considerable number of cases.1) Kim
et al. reported that early delineation of portal branches in the area of early staining on CTHA is a finding specific to
AP shunting, but the delineation rate was low at 34.6%.4) Regarding findings on diffusion-weighted imaging of MRI,
Motosugi et al. reported that all 32 nodular hepatic pseudolesions were isointense with the surrounding liver parenchyma
but that 83 (67%) of the 123 hepatocellular carcinomas were hyperintense.7) Therefore, if a lesion is delineated as a
hyperintense area on diffusion-weighted imaging, it is unlikely to be an AP shunt, but if it is detected as an isointense
area, the differentiation with well-differentiated or hypovascular hepatocellular carcinoma is required. Moreover, a
defect of diffusion-weighted imaging is a low detection rate as a result of susceptibility artifact due to air in the lung or
intestine or motion artifact due to cardiac pulsation. Thus, contrast-enhanced MRI using the liver-specific contrast agent
SPIO or EOB・Primovist attracts attention.3,6,7,9,10) SPIO is a superparamagnetic iron oxide preparation, and if it is taken
up by Kupffer cells contained in the normal liver parenchyma or a region with an AP shunt, it causes hypointensity
on T2- and T2*-weighted imaging while hepatocellular carcinoma, which contains no Kupffer cells, is presented as
a relatively hyperintense area. On the other hand, EOB・Primovist, a paramagnetic gadolinium preparation, is taken
up by normal hepatocytes contained in the normal liver parenchyma or an area with an AP shunt and causes iso- or
hyperintensity in the hepatocyte phase (Figure B) and delineates hepatocellular carcinoma with no normal hepatocytes
as a hypointensity. Mori et al. reported that areas with AP shunts complicating liver cirrhosis showed decreases in signal
intensity comparable to those in the surrounding liver parenchyma in 5 of the 6 patients on SPIO contrast-enhanced
T2*-weighted imaging.6) In addition, Motosugi et al. reported that EOB・Primovist contrast-enhanced MRI visualized 29
(87%) of the 32 hepatic pseudolesions as iso- or hyperintensities compared with the surrounding liver parenchyma but 116
(94%) of the 123 hepatocellular carcinomas as hypointensities, in the hepatocyte phase, contributing to the differential
diagnosis.7) For these reasons, contrast-enhanced MRI using the liver-specific contrast agent SPIO or EOB・Primovist is
recommended as a mildly invasive and highly accurate examination for the diagnosis of AP shunts.
17
The Japanese imaging guideline 2013
5. Gastrointestinal tract
A
B
Figure: AP shunting after radiofrequency ablation of hepatocellular
carcinoma
The lesion showed early contrast enhancement ( → ) in the arterial phase (A) but
was isointense with the surrounding liver parenchyma in the hepatocyte phase
(B) of EOB・Primovist contrast-enhanced MRI and was diagnosed as AP shunt.
Index words and secondary materials used as references
A search of PubMed was performed using “liver”, “pseudolesion”, “arterioportal shunting”, “US”, “CT”, “MRI”,
and “CT angiography” as key words. Japana Centra Revuo Medicina was searched using “AP shunt”, “arterioportal
shunting”, and “hepatic pseudolesion” as key words.
References
1) Kim TK et al: Nontumorous arterioportal shunt mimicking hypervascular tumor in cirrhotic liver: two-phase spiral CT findings. Radiology 208:
597-603, 1998 (Level 4)
2) Yu JS et al: Nontumorous hepatic arterial/portal venous shunts: MR imaging findings. Radiology 217: 750-756, 2000 (Level 4)
3) Ahn JH et al: Nontumorous arterioportal shunts in the liver: CT and MRI findings considering mechanisms and fate. Eur Radiol 20: 385-394,
2010 (Level 5)
4) Kim HC et al: Preoperative evaluation of hepatocellular carcinoma: combined use of CT with arterial portography and hepatic arteriography.
AJR 180: 1593-1599, 2003 (Level 4)
5) Matsuo M et al: Arterioportal shunts mimicking hepatic tumors with hyperintensity on T2-weighted MR images. J Magn Reson Imaging 15: 330333, 2002 (Level 5)
6) Mori K et al: Arterioportal shunts in cirrhotic patients: evaluation of the difference between tumorous and nontumorous arterioportal shunts on
MR Imaging with superparamagnetic iron oxide. AJR 175: 1659-1664, 2000 (Level 5)
7) Motosugi U et al: Distinguishing hypervascular pseudolesions of the liver from hypervascular hepatocellular carcinomas with gadoxetic acidenhanced MR imaging. Radiology 256: 151-158, 2010 (Level 4)
8) Takayasu K et al: Multiple non-tumorous arterioportal shunts due to chronic liver disease mimicking hepatocellular carcinoma: outcomes and
the associated elevation of alpha-fetoprotein. J Gastroenterol Hepatol 21: 288-294, 2006 (Level 4)
9) Scharf J et al: Pseudolesions at T1-weighted gradient-echo imaging after administration of superparamagnetic iron oxide: comparison with port
al perfusion abnormalities at CT during arterial portography. Radiology 207: 67-72, 1998 (Level 4)
10) Akai H et al: Detection of hepatocellular carcinoma by Gd-EOB-DTPA-enhanced liver MRI: comparison with triple phase 64 detector row helical CT. Eur J Radiol 80: 310-315, 2011 (Level 2)
18
The Japanese imaging guideline 2013
CQ 067
67
What imaging modalities are appropriate for the
staging of hepatocellular carcinoma?
Recommendation
grade
B
C1
B
Chest CT, bone scintigraphy, PET (patients with hepatocellular carcinoma with
risk factors of extrahepatic metastasis)
C1 Head CT/MRI (patients with hepatocellular carcinoma with neurological findings
or lung metastasis)
In patients with hepatocellular carcinoma with risk factors of extrahepatic metastasis
(tumor embolus in the portal vein, AFP>200 ng/mL, PIVKA-II≥300 mAU/mL, platelet
count ≤130×103/μL, age<65 years), it is recommended to perform chest CT, bone
scintigraphy, and PET. In patients with hepatocellular carcinoma with neurological
findings or lung metastasis, head CT/MRI may be considered for the diagnosis of
brain metastasis.
Background/objective
Circumstances that prompt search for distant metastasis, target areas, and examinations used in staging hepatocellular
carcinoma were evaluated.
Comments
The presence or absence of extrahepatic metastasis is important for the evaluation of need for local treatments for
hepatocellular carcinoma. The frequency of the presence of extrahepatic metastasis of hepatocellular carcinoma is low
at 1.0-2.3% at its diagnosis,1,2) but the frequency of the appearance of extrahepatic metastasis during follow-up after
treatment increases to 21-24%.3,4) The frequency of the occurrence of extrahepatic metastasis according to the site is
6-29% in the lung, 5-20% in lymph nodes, 2-10% in bones, 1-10% in the adrenal gland, and 0.2-0.6% in the brain.1,3-5)
An age of less than 65 years, progression of intrahepatic lesions, tumor thrombus of the portal vein, AFP>200 ng/
mL, PIVKA-II≥300 mAU/mL, and platelet count ≤130x103/μL have been reported as risk factors of extrahepatic
metastasis.3,4) In patients with hepatocellular carcinoma with risk factors of extrahepatic metastasis, it is reasonable to
examine its frequent sites prior to local treatment.
Chest CT is a standard procedure used for the search for lung metastasis. By performing chest CT in addition to
abdominal dynamic CT, most of the frequent sites of extrahepatic metastasis can be examined in addition to intrahepatic
lesions.
Bone scintigraphy is a procedure useful for the search of the whole body for bone metastasis, and it has also been
reported to be useful in hepatocellular carcinoma (Figure).6) However, some bone metastases of hepatocellular
carcinoma are known to show low radionuclide uptake. PET is likely useful for the evaluation of bone metastases
that show low uptake on bone scintigraphy.7,8) Bone metastases of hepatocellular carcinoma are generally osteolytic,
and about 50% of the sites of its metastasis are vertebral bodies.2) By PET/CT, not only metastasis but also the risk of
compression fracture and vertebral canal stenosis may be evaluated, but research directly comparing the diagnostic
ability for extrahepatic metastases including bone metastases of hepatocellular carcinoma between bone scintigraphy
and PET is insufficient.
PET has an excellent ability to diagnose extrahepatic metastases including bone metastases of hepatocellular
carcinoma,9) and it is reasonable to perform it aggressively if an elevation of a tumor marker that cannot be explained
by abdominal lesions or lung metastasis is observed.
Contrast-enhanced CT or MRI is useful for the search for brain metastases, but the frequency of brain metastasis of
hepatocellular carcinoma is low,1,3-5) and most brain metastases are accompanied by lung metastasis.2) In patients with
symptoms, neurological signs, or lung metastasis, head CT or MRI may be worth considering for the search for brain
metastasis.
19
The Japanese imaging guideline 2013
5. Gastrointestinal tract
Figure: Bone metastases of HCC
Bone scintigraphy
The tumor marker levels, which decreased
after resection of hepatocellular
carcinoma, rose again. Since no
intrahepatic lesion or lung metastasis was
detected by CT, bone scintigraphy was
performed, resulting in the detection of
metastases to the right scapula and left
femur ( → ).
Index words and secondary materials used as references
A search of PubMed was performed using “neoplasm staging”, “neoplasm metastasis”, “extrahepatic”, “brain”,
“cerebral”, “cerebrum”, “bone”, “skeletal”, “hepatocellular carcinoma”, “bone scan”, and “scintigraphy” as key words.
The Japan Society of Hepatology ed: Clinical Practice Guidelines for Hepatocellular Carcinoma 2009 was also used as
a reference.
References
1) Uchino K et al: Hepatocellular carcinoma with extrahepatic metastasis: clinical features and prognostic factors. Cancer 117: 4475-4483, 2011
(Level 2)
2) Natsuizaka M et al: Clinical features of hepatocellular carcinoma with extrahepatic metastases. J Gastroenterol Hepatol 20: 1781-1787, 2005
(Level 2)
3) Bae HM et al: Protein induced by vitamin K absence or antagonist-II production is a strong predictive marker for extrahepatic metastases in
early hepatocellular carcinoma: a prospective evaluation. BMC Cancer 11: 435, 2011 (Level 2)
4) Senthilnathan S et al: Extrahepatic metastases occur in a minority of hepatocellular carcinoma patients treated with locoregional therapies:
analyzing patterns of progression in 285 patients. Hepatology 55: 1432-1442, 2011 (Level 2)
5) Follow-up Survey Committee, Liver Cancer Study Group of Japan: Report of the 18th follow-up survey of primary liver cancer (2004-2005).
Acta Hepatologica Japonica 51: 460-484, 2010 (Level 4)
6) Lee KH et al: Bone scintigraphy of skeletal metastasis in hepatoma patients treated by TAE. Hepatogastroenterology 50: 1983-1986, 2003
(Level 3)
7) Kim YK et al: Usefulness 18F-FDG positron emission tomography/computed tomography for detecting recurrence of hepatocellular carcinoma
in posttransplant patients. Liver Transpl 16: 767-772, 2010 (Level 4)
8) Sugiyama M et al: 18F-FDG PET in the detection of extrahepatic metastases from hepatocellular carcinoma. J Gastroenterol 39: 961-968, 2004
(Level 4)
9) Lin CY et al: 18F-FDG PET or PET/CT for detecting extrahepatic metastases or recurrent hepatocellular carcinoma: a systematic review and
meta-analysis. Eur J Radiol 81: 2417-2422, 2011 (Level 3)
20
The Japanese imaging guideline 2013
CQ 068
68
Which modalities are appropriate for the evaluation
of the effects of TACE and RFA for hepatocellular
carcinoma?
Recommendation
grade
B
C1
B Dynamic CT or dynamic MRI
C1 Sonazoid contrast-enhanced ultrasonography
Dynamic CT or dynamic MRI is effective and is recommended. If only one or a
few hepatocellular carcinomas have been treated, Sonazoid contrast-enhanced
ultrasonography may also be considered.
Background/objective
Ultrasonography, CT, and MRI are all used for the evaluation of the therapeutic effects of TACE and RFA. For
contrast-enhanced ultrasonography, Levovist and Sonazoid can be used in Japan, but contrasted enhanced ultrasound is
not performed presently at all facilities. However, as ultrasonography has higher spatial and temporal resolutions than
CT or MRI and is very useful for the visualization of one or a few hepatocellular carcinomas, it may be used as a guide
for RFA. Dynamic CT, on the other hand, currently plays a central role for the evaluation of the therapeutic effects on
hepatocellular carcinoma as it can be performed at nearly all facilities with CT equipment and a contrast agent injector
in a short examination time (high throughput). Dynamic MRI using a gadolinium-based extracellular or EOB contrast
agent can also be performed at facilities with a relatively high-performance MRI system. Recently, EOB・Primovist
contrast-enhanced MRI, which can visualize hepatocellular carcinoma in both the dynamic and hepatocyte phases, is
rapidly spreading due to its high detecting ability. Which modalities should be selected for the evaluation of the effects
of TACE and RFA for hepatocellular carcinoma was evaluated.
Comments
After TACE, non-contrast-enhanced CT is performed to examine the degree of lipiodol accumulation. At facilities
where TACE is performed using IVR-CT, non-contrast-enhanced CT can be performed immediately after the treatment,
but the degree of lipiodol accumulation is generally examined within 1 month after TACE. The treatment is expected to
be effective when lipiodol is accumulated in the hepatocellular carcinoma without defects, but the strong hyperdensity
of lipiodol may prevent the detection of recurrent lesions on CT, and contrast-enhanced MRI using a gadolinium-based
extracellular contrast agent or EOB・Primovist is useful. Since the treatment is also expected to be effective when the
diameter of the hepatocellular carcinoma showing lipiodol accumulation has evenly decreased after TACE, follow-up
using CT is also recommended. According to De Santis et al., lipiodol accumulation in hepatocellular carcinoma after
TACE is observed as a hyperintensity on T1-weighted imaging a few days after treatment, but no signal that affects
images of dynamic MRI is observed 3 months or more after the treatment.1) Therefore, it is necessary to confirm contrast
enhancement of the recurrent and residual lesions in the arterial phase or defect (decrease) of uptake of EOB・Primovist
in the hepatocyte phase or wash-out of a gadolinium-based extracellular contrast agent in the equilibrium phase in T1weighted images of dynamic MRI using such contrast agents. Hunt et al. and Murakami et al. reported that contrastenhanced MRI is superior to contrast-enhanced CT for the evaluation of residual hepatocellular carcinoma after
TACE.2,3) Levovist contrast-enhanced ultrasonography is also considered effective for the evaluation of the effect of
TACE for hepatocellular carcinoma4) and may also be selected as an option that allows the evaluation of the site of
recurrence without effects of Lipiodol accumulation. In Japan, Sonazoid contrast-enhanced ultrasonography, in which
the duration contrast enhancement is long, is often selected, but, to the present, there has been no report of a large-scale
study of the effectiveness of Sonazoid contrast-enhanced ultrasonography for the evaluation of the therapeutic effect
after TACE, and further research is necessary.
The therapeutic effect after RFA for hepatocellular carcinoma is secured by a sufficient peripheral margin. According
to Nakazawa et al. and Kim et al., a margin of about 5 mm or more is desirable,5,6) but a sufficient margin may be
technically difficult to obtain depending on the site of hepatocellular carcinoma (near a large blood vessel, in the margin
of the liver, sites difficult to puncture). The therapeutic effects after RFA can be evaluated by ultrasonography, dynamic
CT, or dynamic MRI (using EOB・Primovist or a gadolinium-based extracellular contrast agent), but the usefulness of
21
The Japanese imaging guideline 2013
5. Gastrointestinal tract
3DCT for the evaluation of the safety margin has been suggested by Kim et al.7) Also, analysis of a case series showed
that the therapeutic effect on hepatocellular carcinoma can be assessed by CT even immediately after RFA (after 1
week).8)
Ueda et al. reported that corona-like staining of hepatocellular carcinoma represents outflow tracts of the tumor blood
flow.9) This report has great significance in the determination of the area of involvement of hepatocellular carcinoma and
suggests the importance of the area of corona-like staining as a possible marker of the safety margin. According to casecontrol studies, hepatocellular carcinoma after RFA shows hyperintensity on T1-weighted imaging of MRI due to the
effect of ablation.10,11) Therefore, on dynamic contrast-enhanced imaging for residual tumors, the T1-shortening effect
of a gadolinium-based contrast agent (which also causes hyperintensity) may become difficult to judge. Another casecontrol study reported that the results of evaluation of the ablated area and residual tumors of hepatocellular carcinoma
after RFA were in close agreement between Sonazoid contrast-enhanced 3D ultrasonography and 3DCT,12) but CT and
MRI are less examiner-dependent than ultrasonography and facilitate the objective evaluation of changes in the tumor
diameter and whether or not the safety margin is sufficient. At present, no report of a large-scale study concerning the
evaluation of the effects of RFA using EOB・Primovist can be found, and further research is necessary.
Index words and secondary materials used as references
A search of PubMed was performed using “HCC”, “TACE”, “RFA”, “therapeutic effect”, and “imaging” as key words,
and relevant reports were selected.
References
1) De Santis M et al: Effects of lipiodol retention on MRI signal intensity from hepatocellular carcinoma and surrounding liver treated by chemoembolization. Eur Radiol 7: 10-16, 1997 (Level 3)
2) Hunt SJ et al: Radiologic monitoring of hepatocellular carcinoma tumor viability after transhepatic arterial chemoembolization: estimating the
accuracy of contrast-enhanced cross-sectional imaging with histopathologic correlation. J Vasc Interv Radiol 20: 30-38, 2009 (Level 2)
3) Murakami T et al: Treatment of hepatocellular carcinoma by chemoembolization: evaluation with 3DFT MR imaging. AJR 160: 295-299, 1993
(Level 3)
4) Morimoto M et al: Contrast-enhanced harmonic gray-scale sonographic-histologic correlation of the therapeutic effects of transcatheter arterial
chemoembolization in patients with hepatocellular carcinoma. AJR 181: 65-69, 2003 (Level 3)
5) Nakazawa T et al: Radiofrequency ablation of hepatocellular carcinoma: correlation between local tumor progression after ablation and ablative margin. AJR 188: 480-488, 2007 (Level 2)
6) Kim YS et al: The minimal ablative margin of radiofrequency ablation of hepatocellular carcinoma (> 2 and < 5 cm) needed to prevent local
tumor progression: 3D quantitative assessment using CT image fusion. AJR 195: 758-765, 2010 (Level 2)
7) Kim KW et al: Safety margin assessment after radiofrequency ablation of the liver using registration of preprocedure and postprocedure CT
images. AJR 196: W565-572, 2011 (Level 2)
8) Ninomiya T et al: Evaluation of the therapeutic effect using MDCT immediately after RFA for HCC. Hepatogastroenterology 53: 558-660, 2006
(Level 5)
9) Ueda K et al: Hypervascular hepatocellular carcinoma: evaluation of hemodynamics with dynamic CT during hepatic arteriography. Radiology
206: 161-166, 1998 (Level 2)
10) Shibata T et al: Small hepatocellular carcinoma: comparison of radio-frequency ablation and percutaneous microwave coagulation therapy.
Radiology 223: 331-337, 2002 (Level 2)
11) Khankan AA et al: Hepatocellular carcinoma treated with radio frequency ablation: an early evaluation with magnetic resonance imaging. J
Magn Reson Imaging 27: 546-551, 2008 (Level 2)
12) Luo W et al: Role of Sonazoid-enhanced three-dimensional ultrasonography in the evaluation of percutaneous radiofrequency ablation of
hepatocellular carcinoma. Eur J Radiol 75: 91-97, 2010 (Level 2)
22
The Japanese imaging guideline 2013
CQ 069
69
Which modalities are appropriate for the diagnosis of
liver metastases (metastatic liver tumors)?
Recommendation
grade
A
B
C1
A Dynamic MRI (EOB)
B Dynamic CT
C1 Ultrasonography
There are evidences that MRI using a liver-specific contrast agent is superior to
ultrasonography or contrast-enhanced CTin terms of diagnostic performance, and
therefore the procedure is strongly recommended.
Contrast-enhanced CT has a high diagnostic ability and is recommended.
Contrast-enhanced ultrasonography has a higher ability than B mode ultrasonography
for detecting liver metastases, but scientific evidence is insufficient as to whether or
not its diagnostic performance is higher than that of contrast-enhanced CT or MRI.
Therefore, contrast-enhanced ultrasonography may be worth considering, but it is not
recommended to diagnose liver metastases by this modality alone, and it should be
used in combination with other imaging techniques.
Background/objective
Metastatic liver tumor (liver metastasis) is observed more frequently than primary liver cancer, and it is the most
frequent malignant tumor of the liver. Conventionally, B mode ultrasonography and contrast-enhanced CT have been
generally considered necessary for the diagnosis of liver metastases. Today, however, the modalities used for the
diagnosis of liver metastases are diverse, including contrast-enhanced ultrasonography, dynamic contrast-enhanced CT
using MDCT, dynamic contrast-enhanced MRI using a gadolinium-based extracellular contrast agent, contrast-enhanced
MRI using a liver specific contrast agent such as SPIO and Gd-EOB-DPTA, PET, and PET/CT. Improvements in these
diagnostic imaging techniques have made detection of minute liver masses possible, and liver metastases have begun to
be diagnosed before or after the beginning of treatment for primary lesions more frequently than before. In this article, a
basic clinical question in diagnosing liver metastases was addressed by reviewing the literature.
Clinically, how the diagnosis leads to treatment is important in diagnosing liver metastases. The benefit of hepatectomy
differs among primary lesions, and various studies and guidelines have reached the consensus that the meaning of
diagnosis differs between cancers such as colon cancer, in which the benefit of maximum possible resection of liver
metastases as well as the primary lesion has been established, and those such as pancreatic cancer and biliary tract
cancer, in which the presence or absence of liver metastases is a factor in the judgment of whether the primary lesion
should be resected. Therefore, it must be noted that imaging modalities are expected to provide information that helps
with the accurate diagnosis of the presence or absence, number, and extent of liver metastases for the former type of
tumors in anticipation of resection but information that contributes to the accurate presence diagnosis of liver metastasis
alone for the latter. On the basis of the literature reviewed for this article, the clinical significance of imaging modalities
in different types of cancer could not be evaluated in detail, and it is not discussed separately for colon cancer and other
cancers to avoid complexity, but many references were related to colon cancer.
Comments
Concerning the diagnostic performance of various modalities, there are a large number of reports ranging from metaanalyses to case-control studies. Four meta-analyses were reported in the 2000s. Niekel et al.,1) in their meta-analysis
of 39 reports (3,391 cases) evaluating the diagnostic performance of CT, MRI, and PET (PET/CT) for liver metastases
of colorectal cancer, reported that the sensitivities of CT and MRI were 74.4 (68.7-79.3)% and 80.3 (74.6-85.0)%,
respectively, showing no significant difference, but suggested the usefulness of a liver-specific contrast agent, which
increased the sensitivity to 84.9 (79.3-89.2)%. They also reported that, in lesions less than 10 mm in diameter, the
sensitivities of CT and MRI were 47.3 (40.1-54.5)% and 60.2 (54.4-65.7)%, respectively, being significantly higher for
MRI. Bipats et al.2) performed a similar meta-analysis and reported that the sensitivity by patient was significantly higher
for PET (94.6%), that the sensitivities by tumor of contrast-enhanced helical CT and 1.5T MRI were 63.8 and 64.4%,
respectively, showing no marked difference, but that the sensitivities of contrast-enhanced MRI and SPIO contrastenhanced MRI were significantly higher than that of non-contrast-enhanced MRI or contrast-enhanced CT using 45 g
or less iodinated contrast agent, and that the sensitivity for tumors 1 cm or greater in diameter was significantly higher
for SPIO contrast-enhanced MRI. Also, in their meta-analysis of reports concerning gastrointestinal cancers including
esophageal, stomach, and colon cancers, Kinkel et al.3) reported that the sensitivity was 55 (95% CI: 41-68)% for US,
23
The Japanese imaging guideline 2013
5. Gastrointestinal tract
A
B
C
D
Figure Liver metastases of pancreatic cancer
A, B Contrast-enhanced CT Liver metastasis with ring-like contrast enhancement is identified in S5. The nodule in
S7 shows no contrast enhancement and is considered a cyst. C Arterial phase of EOB-MRI The tumor in S5 similarly
shows clear ring-like contrast enhancement. The nodule in S7 shows no contrast enhancement. D Hepatocyte phase
of EOB-MRI In addition, a nodule 4 mm in diameter with no EOB uptake is visualized at the periphery of S5, and it is
also considered a liver metastasis ( → ).
72 (63-80)% for contrast-enhanced CT, and 76 (57-91)% for contrast-enhanced or non-contrast-enhanced MRI, with no
significant difference between contrast-enhanced CT and MRI. Among recent reports, according to Floriani et al.,4) the
sensitivities of ultrasonography, contrast-enhanced CT, MRI with and without a liver-specific contrast agent, and PET
were 63.0, 74.8, 81.1, and 93.8% by patient, specificities were 97.6, 95.6, 97.2, and 98.7%, and sensitivities by tumor
were 86.3, 82.6, 86.3, and 86.0%, respectively, and the sensitivity by tumor was significantly higher in MRI using a
liver-specific contrast agent than in contrast-enhanced CT.
In the past reports, the sensitivity of ultrasonography was lower than that of contrast-enhanced CT or MRI, and the
usefulness of this modality has not been demonstrated. Concerning contrast-enhanced ultrasonography, it has been a
report by Bernatik et al.5) that 97% of the lesions detected by CT were visualized by contrast-enhanced ultrasonography,
a report with ROC analysis that a combination of B mode ultrasonography and contrast-enhanced ultrasonography
showed a significantly higher sensitivity for liver metastasis than B mode ultrasonography alone (72 vs. 42%, Az=0.44
vs 0.76),6) and a report that while contrast-enhanced ultrasonography may be more useful than B mode ultrasonography
for the diagnosis of liver metastasis, there is no point in adding contrast-enhanced ultrasonography to MRI. Generally,
ultrasonography has defects such as that it requires skill in scanning and shows wider individual variation but has
advantages such as that it is simple and causes a less burden to medical economy, but the evidence that supports its
superiority or performing it alone for the diagnosis of liver metastasis is deficient.
Since MDCT can simultaneously evaluate the liver and entire abdominal and thoracic regions by one scan, it is
considered to be a primary modality for staging or follow-up. The 4 meta-analyses mentioned above included many
reports that the diagnostic performance of contrast-enhanced CT was inferior to that of MRI using a liver-specific
contrast agent. Clinically, however, there may be problems with the throughput and medical economy in performing all
screening for liver metastasis with MRI. In a prospective study of 247 nodules in surgical cases, Valls et al.7) reported
excellent diagnostic performance of contrast-enhanced CT (liver parenchymal phase alone) with a sensitivity of 85.1%
(95% CI: 80.8-89.3%), positive predictive value of 96.1% (92.9-98.1%), and false positive rate of 3.9% (1.9-7.1%)
and regarded the modality as a standard for the preoperative imaging diagnosis. Concerning the imaging timing, the
sensitivity of the liver parenchymal phase (portal venous-dominant phase) was high (81-91%) in many reports.8,9)
Scott et al.10) compared dual-phase imaging and imaging of the liver parenchymal phase alone and reported that dualphase imaging was significantly superior with a sensitivity of 75.3 vs. 69.7% and Az value on ROC analysis of 0.84
vs. 0.82. There are reports supporting and refuting the usefulness of the addition of the arterial-dominant phase to the
liver parenchymal phase,11) and the evidence concerning the usefulness of multiphasic imaging for the diagnosis of
liver metastases is still unclear. After the introduction of MDCT, there have been reports of the usefulness of thin-slice
scanning,12) and the technique may be worth considering.
Regarding the usefulness of MRI for the diagnosis of liver metastases, many comparative studies using modalities
including ultrasonography, contrast-enhanced CT, and PET have been reported. There is a report that no difference was
observed between non-contrast-enhanced MRI and dynamic contrast-enhanced MRI using an extracellular contrast
agent,13) but recent studies have reported higher diagnostic performance compared with non-contrast-enhanced MRI
or its improvement by the addition of contrast-enhanced MRI to non-contrast-enhanced MRI. As for contrast agents
for MRI, there are extracellular contrast agents such as Gd-DTPA and SPIO and EOB as liver-specific contrast agents,
which are specifically taken up by the reticuloendothelial system or hepatocytes, that can be used in Japan. While Ward
et al.14) reported that Gd-DTPA-enhanced MRI and SPIO-enhanced MRI were superior to CT but that there was no
significant difference between them, all the above meta-analyses reported, regarding the diagnostic performance by
tumor, no significant difference in the specificity but a significantly higher sensitivity for MRI using a liver-specific
contrast agent. Therefore, the use of a liver-specific contrast agent is recommended, but the diagnostic ability of MRI
using an extracellular contrast agent is also considered high. There have been a large number of reports on the diagnostic
performance of SPIO contrast-enhanced MRI since its first report in 1995,15) and high sensitivities (80.6-97.2%) have
been reported.14-18) There is also a report that the positive predictive value by SPIO contrast-enhanced MRI (91%) was
24
The Japanese imaging guideline 2013
CQ 069
significantly higher than that by CT (82%) while there was no difference in sensitivity.18)
There have also been a large number of reports on the usefulness of EOB contrast-enhanced MRI, and high diagnostic
performance similar to that of SPIO contrast-enhanced MRI has been documented.17,19-21) Muhi et al.17) reported that the
sensitivity for lesions 1 cm or less in diameter was higher in EOB- (92%) than SPIO- (63%) enhanced MRI but that both
were superior to contrast-enhanced CT. Many of these studies were about liver metastases from colorectal cancer, but
there is a report that the sensitivity of EOB contrast-enhanced MRI (92-94%) was higher than that of contrast-enhanced
CT (74-76%) also for liver metastases from pancreatic cancer (Figure).20) Although MRI with a high magnetic field
intensity has been reported to be more useful,21) evaluations concerning differences in the magnetic field strength have
been few, and no clear evidence exists at present.
Index words and secondary materials used as references
A search of PubMed was performed using “liver”, “hepatic metastasis”, “US”, “sensitivity”, “specificity”, “contrastenhanced CT”, “contrast-enhanced MRI”, “EOB”, and “Gadoxetic acid” as key words.
References
1) Niekel MC et al: Diagnostic imaging of colorectal liver metastases with CT, MR imaging, FDG PET, and/or FDG PET/CT: a meta-analysis of
prospective studies including patients who have not previously undergone treatment. Radiology 257: 674-684, 2010(Level 1)
2) Bipat S et al: Colorectal liver metastases: CT, MR imaging, and PET for diagnosis--meta-analysis. Radiology 237: 123-131, 2005(Level 1)
3) Kinkel K et al: Detection of hepatic metastases from cancers of the gastrointestinal tract by using noninvasive imaging methods(US, CT, MR
imaging, PET): a meta-analysis. Radiology 224: 748-756, 2002(Level 1)
4) Floriani I et al: Performance of imaging modalities in diagnosis of liver metastases from colorectal cancer: a systematic review and metaanalysis. J Magn Reson Imaging 31: 19-31, 2010(Level 1)
5) Bernatik T et al: Detection of liver metastases: comparison of contrast-enhanced wide-band harmonic imaging with conventional ultrasonography. J Ultrasound Med 20: 509-515, 2001(Level 3)
6) Sugimoto K et al: Improved detection of hepatic metastases with contrast-enhanced low mechanical-index pulse inversion ultrasonography
during the liver-specific phase of sonazoid: observer performance study with JAFROC analysis. Acad Radiol 16: 798-809, 2009(Level 3)
7) Valls C et al: Hepatic metastases from colorectal cancer: preoperative detection and assessment of resectability with helical CT. Radiology
218: 55-60, 2001(Level 2)
8) Sheafor DH et al: Comparison of unenhanced, hepatic arterial-dominant, and portal venous-dominant phase helical CT for the detection of
liver metastases in women with breast carcinoma. AJR 172: 961-968, 1999(Level 2)
9) Soyer P et al: Detection of hypovascular hepatic metastases at triple-phase helical CT: sensitivity of phases and comparison with surgical and
histopathologic findings. Radiology 231: 413-420, 2004(Level 2)
10) Scott DJ et al: Dual phase helical CT versus portal venous phase CT for the detection of colorectal liver metastases: correlation with intraoperative sonography, surgical and pathological findings. Clin Radiol 56: 235-242, 2001(Level 3)
11) Wicherts DA et al: Incremental value of arterial and equilibrium phase compared to hepatic venous phase CT in thepreoperative staging of
colorectal liver metastases: an evaluation with different reference standards. Eur J Radiol 77: 305-311, 2011(Level 3)
12) Weg N et al: Liver lesions: improved detection with dual-detector-array CT and routine 2.5-mm thin collimation. Radiology 209: 417-426,
1998(Level 3)
13) Hamm B et al: Liver metastases: improved detection with dynamic gadolinium-enhanced MR imaging? Radiology 202: 677-682, 1997(Level 1b)
14) Ward J et al: Liver metastases in candidates for hepatic resection: comparison of helical CT and gadolinium- and SPIO-enhanced MR imaging.
Radiology 237: 170-180, 2005(Level 2)
15) Hagspiel KD et al: Detection of liver metastases: comparison of superparamagnetic iron oxide-enhanced and unenhanced MR imaging at 1.5T
with dynamic CT, intraoperative US, and percutaneous US. Radiology 196: 471-478, 1995(Level 2)
16) Kim YK et al: Detection and characterization of liver metastases: 16-slice multidetector computed tomography versus superparamagnetic iron
oxide-enhanced magnetic resonance imaging. Eur Radiol 16: 1337-1345, 2006(Level 2)
17) Muhi A et al: Diagnosis of colorectal hepatic metastases: contrast-enhanced ultrasonography versus contrast-enhanced computed tomography
versus superparamagnetic iron oxide-enhanced magnetic resonance imaging with diffusion-weighted imaging. J Magn Reson Imaging 32:
1132-1140, 2010(Level 2)
18) Motosugi U et al: Imaging of small hepatic metastases of colorectal carcinoma: how to use superparamagnetic iron oxide-enhanced magnetic
resonance imaging in the multidetector-row computed tomography age? J Comput Assist Tomogr 33: 266-272, 2009(Level 3)
19) Seo HJ et al: Gadoxetate disodium-enhanced magnetic resonance imaging versus contrast-enhanced 18F-fluorodeoxyglucose positron emission tomography/computed tomography for the detection of colorectal liver metastases. Invest Radiol 46: 548-555, 2011(Level 2)
20) Motosugi U et al: Detection of pancreatic carcinoma and liver metastases with gadoxetic acid-enhanced MR imaging: comparison with contrast-enhanced multi-detector row CT. Radiology 260: 446-453, 2011(Level 3)
21) Sofue K et al: Detection of hepatic metastases by superparamagnetic iron oxide-enhanced MR imaging: prospective comparison between
1.5-T and 3.0-T images in the same patients. Eur Radiol 20: 2265-2273, 2010(Level 2)
25
The Japanese imaging guideline 2013
5. Gastrointestinal tract
70
Are CT during angiography (CTAP, CTHA) and PET
appropriate for the diagnosis of liver metastases?
Recommendation
grade
C1
C2
C1
C2
PET (including PET/CT)
CT during angiography
PET is not sufficiently evidenced to be superior to other imaging modalities and
cannot be recommended for the diagnosis of liver metastases, but because of its high
specificity, it may be considered when the definitive diagnosis is impossible by other
modalities. While CT during angiography has high sensitivity, it is not recommended
not only as the evidence that its diagnostic ability is higher than that of MRI or
CT is deficient but also because it is an invasive examination. MRI using a liverspecific contrast agent is more recommendable. If it cannot be performed, CT during
angiography may be considered.
Background/objective
For diagnosing liver metastases, a wide variety of imaging modalities such as contrast-enhanced ultrasonography,
dynamic contrast-enhanced CT using MDCT, dynamic contrast-enhanced MRI using a gadolinium-based extracellular
contrast agent, contrast-enhanced MRI using a liver-specific contrast agent such as SPIO and Gd-EOB-DPTA, PET,
PET/CT, and CT during angiography are available today. While ultrasonography, CT, and MRI are simple procedures
performed on a routine basis, CT during angiography or PET are regarded as special rather than standard examinations.
However, no guidelines that mention the use of CT during angiography or PET for the diagnosis of liver metastases are
available, and the role of these modalities are unclear. In this article, therefore, the recommendation grades of CT during
angiography and PET were evaluated on the basis of the literature.
Comments
There have been many reports on the diagnostic performance of various modalities from meta-analyses to case
control studies. Four meta-analyses were reported in the 2000s. According to the meta-analysis of 39 reports (3,391
cases) evaluating the diagnostic performance of various modalities for liver metastases of colorectal cancer by Niekel
et al.,1) the sensitivities by lesion of CT, MRI, and PET were 74.4, 80.3, and 81.4%, respectively, with no significant
difference, but the sensitivities by patient of CT, MRI, and PET (PET/CT) were 83.6, 88.2, and 94.1%, respectively,
being significantly higher for PET. In a similar meta-analysis, Bipat et al.2) also reported that the sensitivity by patient of
PET (94.6%) was higher than that of CT or MRI (60.2-75.8%) but that its sensitivity by lesion was higher, though not
significantly, compared with CT or MRI. According to this meta-analysis, the sensitivity for tumors 1 cm or greater in
diameter was significantly higher in SPIO-contrasted MRI. In the meta-analysis by Kinkel et al.,3) in which the review
was restricted to reports on cancer of the digestive organs with a specificity of 85% or higher, the sensitivity of PET was
high at 90% (95%CI: 80-97%), exceeding that of CT or MRI, but the difference compared with MRI was not significant.
In the meta-analysis by Floriani et al.,4) also, the sensitivities by patient of ultrasonography, contrast-enhanced CT,
MRI, and PET were 63.0, 74.8, 81.1, and 93.8%, respectively, and the specificities were 97.6, 95.6, 97.2, and 98.7%,
respectively, being high in PDG-PET, but the sensitivities by tumor were 86.3, 82.6, 86.3, and 86.0%, respectively,
showing no difference compared with MRI using a liver-specific contrast agent. Therefore, the diagnostic performance
of PET is high by patient but not by tumor. In addition, according to the report by Ruers et al.,5) PET was useful for the
determination of the therapeutic approach to liver metastases, but its sensitivity for liver metastases varied with the size
of the lesion, and the sensitivity of contrast-enhanced CT was higher for lesions 1.5 cm or less in diameter. The liver
has been known to show physiologic accumulation of FDG, and there have been many reports that the diagnosis of liver
metastases depends on their size.6-10) By the systematic review by Wiering et al.,7) also, the sensitivity and specificity for
extrahepatic lesions were very satisfactory at 91.2 and 98.4%, but those for liver metastases were at 88.0 and 96.1%,
respectively, showing a decrease in the sensitivity. This defect may be corrected by the development of combined PET/
CT or PET/MRI devices, evidence concerning whether or not these modalities are superior to MRI using a liver-specific
contrast agent in detecting liver metastases is currently unclear. However, PET is considered useful for whole body
scanning and, because of its high specificity, as an supplementary examination when the definitive diagnosis of liver
metastasis is impossible by other modalities (Figure).
While there is no meta-analysis or systematic review on the usefulness of CT during angiography, there have been
a large number of reports on studies comparing it with contrast-enhanced CT or MRI using a liver-specific contrast
agent.11-21) The diagnostic performance has been reported to have improved by combining CTAP and CTHA compared
26
The Japanese imaging guideline 2013
CQ 070
Figure: Liver metastasis from colorectal cancer
A Contrast-enhanced CT A mass showing faint contrast enhancement is detected
in S8 but cannot be identified as a metastasis ( → ). B PET High tracer uptake
(SUV=8.8) is noted at the same site, and a diagnosis of liver metastasis was made
( → ).
with CTAP alone.13) Although CT during angiography has been reported to be superior to MRI using a liver-specific
contrast agent or CT due to its high sensitivity,11,12,21) it has also been reported to be inferior or similar to contrastenhanced CT14-17) or MRI using a liver-specific contrast agent (SPIO).18-20) Therefore, CT during angiography is not
recommended from the standpoints of cost and invasiveness for the diagnosis of liver metastases when MRI using a
liver-specific contrast agent is performed. No report comparing CT during angiography with EOB-enhanced MRI was
found by our review of the literature, and which modality is superior is unclear, but as there are many reports that EOBenhanced MRI has a diagnostic ability comparable to, or higher than, SPIO-enhanced MRI, substituting EOB for SPIO
is considered acceptable.
Index words and secondary materials used as references
A search of PubMed was performed using “liver”, “hepatic metastasis”, “CT arterial portography”, “CT hepatic
arteriography”, “sensitivity”, “specificity”, “PET”, and “PET/CT” as key words.
References
1) Niekel MC et al: Diagnostic imaging of colorectal liver metastases with CT, MR imaging, FDG PET, and/or FDG PET/CT: a meta-analysis of
prospective studies including patients who have not previously undergone treatment. Radiology 257: 674-684, 2010 (Level 1)
2) Bipat S et al: Colorectal liver metastases: CT, MR imaging, and PET for diagnosis--meta-analysis. Radiology 237: 123-131, 2005 (Level 1)
3) Kinkel K et al: Detection of hepatic metastases from cancers of the gastrointestinal tract by using noninvasive imaging methods (US, CT, MR
imaging, PET): a meta-analysis. Radiology 224: 748-756, 2002 (Level 1)
4) Floriani I et al: Performance of imaging modalities in diagnosis of liver metastases from colorectal cancer: a systematic review and metaanalysis. J Magn Reson Imaging 31: 19-31, 2010 (Level 1)
5) Ruers TJ et al: Value of positron emission tomography with [F-18] fluorodeoxyglucose in patients with colorectal liver metastases: a prospective study. J Clin Oncol 20: 388-395, 2002 (Level 2)
6) Fong Y et al: Utility of 18F-FDG positron emission tomography scanning on selection of patients for resection of hepatic colorectal metastases.
Am J Surg 178: 282-287, 1999 (Level 2)
7) Coenegrachts K et al: Comparison of MRI (including SS SE-EPI and SPIO-enhanced MRI) and FDG-PET/CT for the detection of colorectal
liver metastases. Eur Radiol 19: 370-379, 2009 (Level 2)
8) Mainenti PP et al: Detection of colo-rectal liver metastases: prospective comparison of contrast enhanced US, multidetector CT, PET/CT, and
1.5 Tesla MR with extracellular and reticulo-endothelial cell specific contrast agents. Abdom Imaging 35: 511-521, 2010 (Level 3)
9) Wiering B et al: The impact of fluor-18-deoxyglucose-positron emission tomography in the management of colorectal liver metastases. Cancer
104: 2658-2670, 2005 (Level 2)
10) Frohlich A et al: Detection of liver metastases from pancreatic cancer using FDG PET. J Nucl Med 40: 250-255, 1999 (Level 2)
11) Soyer P et al: MRI of liver metastases from colorectal cancer vs. CT during arterial portography. J Comput Assist Tomogr 17: 67-74, 1993
(Level 3)
12) Strotzer M et al: Diagnosis of liver metastases from colorectal adenocarcinoma: comparison of spiral-CTAP combined with intravenous contrast-enhanced spiral-CT and SPIO-enhanced MR combined with plain MR imaging. Acta Radiol 38: 986-992, 1997 (Level 2)
13) Inaba Y et al: Revealing hepatic metastases from colorectal cancer: value of combined helical CT during arterial portography and CT hepatic
arteriography with a unified CT and angiography system. AJR 174: 955-961, 2000 (Level 3)
14) Valls C et al: Helical CT versus CT arterial portography in the detection of hepatic metastasis of colorectal carcinoma. AJR170: 1341-1347,
27
The Japanese imaging guideline 2013
5. Gastrointestinal tract
1998 (Level 2)
15) Schwartz L et al: Prospective, blinded comparison of helical CT and CT arterial portography in the assessment of hepatic metastasis from
colorectal carcinoma. World J Surg 30: 1892-1899, 2006 (Level 2)
16) Kouwenhoven ST et al: The pre-operative stratification of patients with colorectal liver metastases: computed tomography arterial portography
(CTAP) has no added value. Eur J Surg Oncol 36: 36-42, 2010 (Level 2)
17) Furukawa Het al: Is CT during arterial portography useful for the preoperative evaluation of liver metastases from pancreatic carcinoma?
Pancreas 22: 200-202, 2001 (Level 3)
18) Lencioni R et al: Detection of colorectal liver metastases: prospective comparison of unenhanced and ferumoxides-enhanced magnetic resonance imaging at 1.5 T, dual-phase spiral CT, and spiral CT during arterial portography. MAGMA 7: 76-87, 1998 (Level 3)
19) Vogl TJ et al: Preoperative evaluation of malignant liver tumors: comparison of unenhanced and SPIO (Resovist)-enhanced MR imaging with
biphasic CTAP and intraoperative US. Eur Radiol 13: 262-272, 2003 (Level 2)
20) Tanimoto A et al: Superparamagnetic iron oxide-enhanced MR imaging for focal hepatic lesions: a comparison with CT during arterioportography plus CT during hepatic arteriography. J Gastroenterol 40: 371-380, 2005 (Level 3)
21) Nomura K et al: Detection of hepatic metastases from colorectal carcinoma: comparison of histopathologic features of anatomically resected
liver with results of preoperative imaging. J Clin Gastroenterol 41: 789-795, 2007 (Level 3) with CTAP alone.13) Although CT during angiography has been reported to be superior to MRI using a liver-specific contrast agent or CT due to its high sensitivity,11,12,21) it has also been
reported to be inferior or similar to contrast-enhanced CT14-17) or MRI using a liver-specific contrast agent (SPIO).18-20) Therefore, CT during
angiography is not recommended from the standpoints of cost and invasiveness for the diagnosis of liver metastases when MRI using a liverspecific contrast agent is performed. No report comparing CT during angiography with EOB-enhanced MRI was found by our review of the literature, and which modality is superior is unclear, but as there are many reports that EOB-enhanced MRI has a diagnostic ability comparable
to, or higher than, SPIO-enhanced MRI, substituting EOB for SPIO is considered acceptable.
28
The Japanese imaging guideline 2013
CQ 071
71
Which imaging modalities are appropriate when
intrahepatic cholangiocarcinoma is suspected?
Recommendation
grade
A
B
C1
A Dynamic CT
B Dynamic MRI (including EOB)
C1 Ultrasonography
Dynamic CT, which has a high diagnostic ability, is strongly recommended to be
performed.
Dynamic MRI using an extracellular contrast agent provides blood flow information.
EOB contrast-enhanced MRI is useful for staging while it may fail to show delayed
enhancement characteristic of cholangiocarcinoma. So, these modalities are
recommended.
Ultrasonography has no sufficient scientific evidence for its superiority to CT or
MRI in diagnostic performance, but the diagnostic ability of contrast-enhanced
ultrasonography is considered high, and it should be performed in combination with
other imaging modalities.
Background/objective
The biological nature and prognosis of intrahepatic cholangiocarcinoma (cholangiocellular carcinoma) evaluated
by imaging modalities differ from those of HCC, and it is treated primarily by surgery. When intrahepatic
cholangiocarcinoma is suspected, imaging examinations are performed for the presence diagnosis, qualitative diagnosis,
and staging, and modalities must be selected for each objective.
Comments
Intrahepatic cholangiocarcinoma accounts for 3.6% of primary liver cancers, being the second most frequent following
hepatocellular carcinoma. It is macroscopically classified into the mass-forming, bile-duct-infiltrating, and intraductal
growth types. The mass-forming type forms a clear elliptical mass, has a distinct border, and typically shows ring-like
staining of its irreguenhancementlar margin. In the delayed phase, the interior of the tumor is stained. The bile-ductinfiltrating type involves the blood vessels and connective tissue around the bile duct and shows dendritic extension
in the longitudinal direction. The histological extent may be longer than the extent captured by imaging modalities,
and caution is needed. The intraductal-growth type shows papillary or granular growth into the bile duct lumen but
occasionally exhibits extension with dilation of the superficial layer or intrabiliary tumor embolus.
1) US
Ultrasonography, which is non-invasive and readily permits arbitrary selection of imaging planes, should be performed
first. Generally, tumor-forming type cholangiocarcinoma can be recognized as a mass, but the bile-duct-infiltrating type
is often overlooked, and this modality is not considered appropriate for the evaluation of tumor extent. On contrastenhanced ultrasonography, ring-like staining in the arterial to portal-venous phases and defect in the parenchymal phase
are findings characteristic of mass-forming cholangiocarcinoma and metastatic liver cancer. Reportedly, its diagnostic
power is high with sensitivity, specificity, and positive predictive value of 90, 95, and 88%, respectively, and the
modality is useful for the qualitative diagnosis.1)
2) CT
CT is useful for the localization of lesions and evaluation of the presence or absence of arterial or portal venous
invasion and intrahepatic biliary duct dilation. While the mass-forming type is characterized by ring-like enhancement
of the margin and enhancement in the delayed phase, some lesions show early enhancement. Figure 1 shows images of
mass-forming type intrahepatic cholangiocarcinoma. A mass with irregular ring-like marginal enhancement was noted in
S8 of the liver in the hepatic arterial dominant phase, and delayed enhancement was observed in the equilibrium phase.
Lesions that show delayed enhancement have been reported to be rich in fibrous stroma, often invade adjacent nerves,
and have poorer prognosis than lesions that show early enhancement.2,3) In the bile-duct-infiltrating type, the evaluation
of the extent of intrabiliary invasion is generally considered difficult. However, a study using a 16-row MDCT showed
diagnostic accuracies of 80.9 and 100% concerning the horizontal and vertical extents of involvement, respectively,
but the ability of the modality for the diagnosis of N2 lymph node metastasis was limited.4) In CT after biliary drainage
procedures such as endoscopic nasobiliary drainage (ENBD) and biliary stenting, the accuracy of the evaluation is
limited due to enhancement of inflammation, and the evaluation before the biliary draining procedure is considered
important. Figure 2 shows bile-duct-infiltrating type intrahepatic cholangiocarcinoma. Intrahepatic biliary duct dilation
29
The Japanese imaging guideline 2013
5. Gastrointestinal tract
A
B
Figure 1: Intrahepatic cholangiocarcinoma (mass-forming
type)
A Contrast-enhanced CT (hepatic arterial dominant phase): A
mass with irregular ring-like staining of the margin in the hepatic
arterial dominant phase, a finding characteristic of mass-forming
cholangiocarcinoma, is observed in S8 of the liver. B Contrast-enhanced CT (equilibrium phase): Delayed staining is
observed in the equilibrium phase.
Figure 2: Intrahepatic cholangiocarcinoma
(bile-duct-infiltrating type)
Intrahepatic cholagiectasis is observed
in the lateral segment of the left lobe.
On the proximal side of this area is a
region showing indistinctly bordered
delayed staining, which is a finding
characteristic of bile-duct-infiltrating type
cholangiocarcinoma.
is observed in the lateral segment of the left lobe with a region showing indistinctly bordered delayed enhancement on
its proximal side (→).
3) MRI
MRI is useful for the localization of lesions and can also be used for the evaluation of the presence or absence of
arterial or portal venous invasion, degree of intrahepatic biliary duct dilation, and sites of stenosis. Cholangiocarcinoma
is hypointense on T1-weighted imaging and hyperintense on T2-weighted imaging. Hypointensity of the interior
represents fibrosis. On dynamic MRI using an extracellular contrast agent, ring-like enhancement of the margin and
delayed enhancement are findings characteristic of the mass-forming type similarly to CT.
EOB-contrasted MRI has been reported to be excellent in detecting intrahepatic metastatic foci5) and is useful for
designing treatments after the diagnosis of cholangiocarcinoma. For the qualitative diagnosis, however, it must be
noted that the modality often fails to exhibit delayed enhancement, which is observed by imaging using an extracellular
contrast agent, and may make distinction of the disease from other malignant tumors difficult. Also, MRCP, which
allows non-invasive evaluation of the bile duct anatomy and has a high sensitivity of 96% concerning the extent of
malignant tumors, is recommended.6)
Index words and secondary materials used as references
A search of PubMed was performed using “cholangiocarcinoma”, “liver”, “hepatic”, “US”, “CT”, and “MRI” as key
words. Also, Kudo M: Liver Cancer Study Group of Japan: Report of the 17th follow-up survey of primary liver cancer
(2002-2003) (Acta Hepatologica Japonica 48: 117-140, 2007), and Liver Cancer Study Group of Japan: The General
Rules for the Clinical and Pathological Study of Primary Liver Cancer (The 5th Edition, Revised Version), 2009 were
also used as references.
References
1) Tanaka S et al: Dynamic sonography of hepatic tumors. AJR 177: 799-805, 2001 (Level 3)
2) Asayama Y et al: Delayed-phase dynamic CT enhancement as a prognostic factor for mass-forming intrahepatic cholangiocarcinoma.
Radiology 238: 150-155, 2006 (Level 2)
3) Kim SA et al: Intrahepatic mass-forming cholangiocarcinomas: enhancement patterns at multiphasic CT, with special emphasis on arterial
enhancement pattern--correlation with clinicopathologic findings. Radiology 260: 148-157, 2011 (Level 3)
4) Unno M et al: Preoperative assessment of hilar cholangiocarcinoma by multidetector row computed tomography. J Hepatobiliary Pancreat
Surg 14: 434-440, 2007 (Level 4)
5) Kang Y et al: Intrahepatic mass-forming cholangiocarcinoma: enhancement patterns on gadoxetic acid-enhanced MR images. Radiology 264:
751-760, 2012 (Level 3)
6) Lopera JE et al: Malignant hilar and perihilar biliary obstruction: use of MR cholangiography to define the extent of biliary ductal involvement
and plan percutaneous interventions. Radiology 220: 90-96, 2001 (Level 4)
30
The Japanese imaging guideline 2013
CQ 072
72
If a cystic lesion of the liver is detected, which
imaging modalities are appropriate for the
discrimination of benign and malignant diseases?
Recommendation
grade
C1
C1 Ultrasonography
C1 Contrast-enhanced CT
C1 Contrast-enhanced MRI (EOB-contrasted MRI)
There is no sufficient scientific evidence concerning the usefulness of
ultrasonography, contrast-enhanced CT, or contrast-enhanced MRI for the
discrimination of benign and malignant cystic lesions of the liver, and their
discriminating ability is limited. However, as they have some utility, they may be worth
considering.
Background/objective
Various modalities including ultrasonography, contrast-enhanced CT, and contrast-enhanced MRI have been reported
to be useful for the discrimination of benign and malignant cystic lesions of the liver. The ability of each modality to
discriminate benign and malignant cystic lesions of the liver was evaluated.
Comments
Cystic lesions of the liver vary widely from congenital liver cysts including those derived from the liver parenchyma
such as simple liver cysts and those derived from the bile duct such as Caroli disease to inflammation-derived and
tumoral cysts. Malignant cystic tumors of the liver are frequently derived from tumoral cysts, but there have been a
number of reports of malignant lesions developing from other cystic lesions, and they cannot be lumped together. In this
section, of these cystic lesions, the discrimination between benign and malignant lesions of mucinous cystic neoplasm
and intraductal papillary neoplasm of the bile duct, which are often malignant, is primarily discussed.
Ultrasonography, contrast-enhanced CT, and contrast-enhanced MRI are all useful for the examination of septa
and solid areas. Contrast enhancement of septa and solid areas and mural nodules are observed in both benign and
malignant diseases, but papillary solid tumors and nodular thickening of the septa are findings suggestive of malignancy
(sensitivity: 67-100%)1-8) (Figure). However, the ability of each modality in detecting small solid parts or tumors along
walls is limited.1,7,9) Also, benign and malignant diseases cannot be discriminated according to the presence or absence
of calcification, and bleeding is reported to be a highly sensitive but non-specific sign of malignancy.5,8) Also, there have
been few reports concerning EOB contrast-enhanced MRI.
Ultrasonography is the optimal examination for the evaluation of internal properties of cysts such as mucus and septa
as a characteristic of the modality.2,4,6,7) It is also useful for the diagnosis of solid tumors that appear cystic on CT and
MRI such as undifferentiated sarcoma.10,11) However, there have been reports that biliary sludge, mucus plugs, and
calcification foci are occasionally difficult to distinguish from solid parts by ultrasonography and that CT is superior
in delineating solid parts.1,12,13) Ultrasonography is also more dependent on the examiner’s skill.7) Contrast-enhanced
CT has excellent spatial resolution and is useful for the determination of the size and anatomical location of lesions
and evaluation of bile duct and vascular invasion.2,4,6,7,14,15) Similarly to CT, MRI is useful for the evaluation of the size,
vascular invasion, and hepatic involvement and for the examination of internal properties such as bleeding.6,8,14)
Despite insufficiency of evidence and limitation of the discrimination ability, each modality has different characteristics
in diagnostic performance, and the diagnosis by their combined use is recommended.
Index words and secondary materials used as references
A search of PubMed was performed using “liver”, “cyst”, “diagnosis”, “malignant”, “biliary cystadenocarcinoma”,
“intraductal papillary neoplasm of the bile duct”, and “imaging” as key words.
References
1) Lim JH et al: Intraductal papillary mucinous tumor of the bile ducts. Radiographics 24: 53-66, 2004(Level 5)
2) Choi BI et al: Biliary cystadenoma and cystadenocarcinoma: CT and sonographic findings. Radiology 171: 57-61, 1989 (Level 4)
3) Vogt DP et al: Cystadenoma and cystadenocarcinoma of the liver: a single center experience. J Am Coll Surg 200: 727-733, 2005 (Level 3)
4) Korobkin M et al: Biliary cystadenoma and cystadenocarcinoma: CT and sonographic findings. AJR 153: 507-511, 1989 (Level 3)
5) Buetow PC et al: Biliary cystadenoma and cystadenocarcinoma: clinical-imaging-pathologic correlations with emphasis on the importance of
31
The Japanese imaging guideline 2013
5. Gastrointestinal tract
A
B
Figure: Intraductal papillary neoplasm of the bile duct
A Contrast-enhanced CT (liver parenchymal phase) Transverse section B Contrast-enhanced CT (liver parenchymal phase) Coronal section
A cystic mass 3.5 cm in long diameter is observed in the caudate lobe of the liver. A
papillary solid area is noted along the wall in the right part of the mass and shows contrast
enhancement ( → ), which is a finding suggestive of malignancy.
ovarian stroma. Radiology 196: 805-810, 1995 (Level 3)
6) Lee JH et al: Biliary cystadenoma and cystadenocarcinoma of the liver: 10 cases of a single center experience. Hepatogastroenterology 56:
844-849, 2009 (Level 3)
7) Takanami K et al: Intraductal papillary mucininous neoplasm of the bile ducts: multimodality assessment with pathologic correlation. Abdom
Imaging 36: 447-456, 2011(Level 5)
8) Lewin M et al: Assessment of MRI and MRCP in diagnosis of biliary cystadenoma and cystadenocarcinoma. Eur Radiol 16: 407-413, 2006
(Level 3)
9) Kokubo T et al: Mucin-hypersecreting intrahepatic biliary neoplasms. Radiology 168: 609-614, 1988 (Level 4)
10) Buetow PC et al: Undifferentiated (embryonal) sarcoma of the liver: pathologic basis of imaging findings in 28 cases. Radiology 203: 779-783,
1997 (Level 3)
11) Chung EM et al: From the archives of the AFIP: pediatric liver masses: radiologic-pathologic correlation. Part 2. Malignant tumors.
Radiographics 31: 483-507, 2011 (Level 5)
12) Lim JH et al: Radiological spectrum of intraductal papillary tumors of the bile ducts. Korean J Radiol 3: 57-63, 2002(Level 5)
13) Han JK et al:. Intrahepatic intraductal cholangiocarcinoma. Abdom imaging 29: 558-564, 2004 (Level 5)
14) Mortele KJ et al: Cystic focal liver lesions in the adult: differential CT and MR imaging features. Radiographics 21: 895-910, 2001(Level 5)
15) Lee JW et al: CT features of intraductal intrahepatic cholangiocarcinoma. AJR 175: 721-725, 2000 (Level 3)
32
The Japanese imaging guideline 2013
CQ 073
73
Which imaging modalities are appropriate as for the
reliable diagnosis of liver hemangiomas?
Recommendation
grade
A
B
C1
A Extracellular gadolinium contrast-enhanced dynamic MRI
B EOB contrast-enhanced MRI, contrast-enhanced dynamic CT
C1 Ultrasonography and contrast-enhanced ultrasonography
MRI including extracellular gadolinium contrast-enhanced dynamic MRI is the most
reliable and is strongly recommended. EOB contrast-enhanced MRI and contrastenhanced dynamic CT also have a sufficient diagnostic ability and are recommended
to be performed. The diagnostic performance of ultrasonography is improved by the
use of a contrast agent, and the modality should be considered.
Background/objective
Cavernous hemangioma is the most frequent benign tumor of the liver. It is sometimes difficult to discriminate
from primary liver cancer in patients with chronic liver disease and liver metastasis in tumor-bearing patients. It is
often detected incidentally also in healthy individuals. Since it rarely ruptures or transforms into a malignant disease,
unnecessary treatment can be avoided if it is definitively diagnosed by a minimally invasive and highly accurate method.
This also avoids invasive procedures and cost of unnecessary additional examinations or follow-up.
Comments
A majority of liver hemangiomas are cavernous hemangomas, which are benign liver diseases that form localized liver
masses due to tumorous growth of large and small vascular lumens, in which flattened endothelial cells are arranged.
In the interior of vascular lumens, degeneration such as new and old thrombus formation, necrosis, scars, fibrosis,
and calcification is observed. As degeneration advances, the lesion becomes sclerosed hemangioma. It is necessary to
diagnose liver hemangioma using imaging modalities by understanding these tissue architectures and degeneration.1)
Until the early 1990s, liver hemangiomas were occasionally diagnosed definitively by angiography,2) but invasive
angiography has been completely obviated as a diagnostic procedure due to the recent development of less invasive
imaging techniques. Similarly, while radionuclide studies using 99mTc-labeled erythrocytes used to be performed,
it has fallen into disuse due to the unsatisfactory accuracy2) and difficulty of diagnosing small hemangiomas. The
performance of ultrasound devices began to improve since the late 1980s with improvements in the detection sensitivity
for hemangiomas,3) but their differentiation from malignant tumors was not easy by ultrasonography without contrast
enhancement. In the late 1980s, MRI became increasingly available, and its usefulness for the diagnosis of liver
hemangiomas was reported.3-6) According to comparisons of ultrasonography with non-contrast CT and MRI performed
in this period, MRI showed higher detection sensitivity.3-5) Thereafter, there was also a report that non-contrast MRI
was superior to contrast-enhanced CT.7) From the early 1990s, the development of helical CT and high magnetic field
strength MRI progressed, and contrast-enhanced dynamic study became possible with both CT and MRI, resulting
in marked improvements in the diagnostic ability for liver hemangioma8,9) and reports of diagnostic performance
exceeding that by ultrasonography.10) In this period, Doppler ultrasonography was reported to be useful for the diagnosis
of liver hemangioma,11) but the procedure has not been established as a method for the definitive diagnosis. Recently,
also, with the introduction of contrast-enhanced ultrasonography, more detailed analysis of the hemodynamics of liver
hemangiomas has become possible, causing improvements in the diagnostic performance of ultrasonography.12-14)
However, the reliability of contrast-enhanced ultrasonography for the diagnosis of liver hemangioma has not been
securely established due to the presence of dead angles, difficulty in simultaneous evaluation of multiple lesions, and
variability of the results depending on the examiner’s skill and the patient’s physique. In MRI, many hemangiomas
show hyperintensity on T2-weighted imaging, and lesions about 4 mm in diameter has become detectable. On
gadolinium contrast-enhanced MRI, usual staining type hemangiomas, in which marginal nodular staining extends
internally with time, account for about 70% of the lesions.6,15) Some hemangiomas are those with arterioportal (AP)
shunts, early enhancing type hemangiomas, which show intense enhancement of the whole lesion from the early phase
of contrast enhancement, and delayed staining hemangiomas, which show partial dot-like staining (bright-dot sign) or
only pale staining in the margin until the late phase of contrast enhancement. With improvements in the understanding
of these atypical findings,15) it has become possible to diagnose liver hemangiomas with a high level of confidence.
Moreover, radiation exposure cannot be ignored on contrast-enhanced multiphasic CT,16) and, particularly, on secondary
33
The Japanese imaging guideline 2013
5. Gastrointestinal tract
examination of hemangiomas incidentally detected in healthy individuals, MRI with the benefit of no radiation exposure
even on contrast-enhanced multiphasic imaging, is recommended. Recently, EOB・Primovist contrast-enhanced MRI
has begun to be performed widely for close evaluation of liver masses, but it often fails to present clear hyperintensity
of blood pools in the late to delayed phase of contrast enhancement, its diagnostic ability for small hemangiomas is
considered to be limited.17-19)
Index words and secondary materials used as references
A search of PubMed was performed using “liver”, “hemangioma”, “diagnosis”, “CT”, “US”, “MRI”, “angiography”,
“scintigraphy”, and “EOB” as key words.
References
1) Yamashita Y et al: Cavernous hemangioma of the liver: pathologic correlation with dynamic CT findings. Radiology 203: 121-125, 1997 (Level
3)
2) Kagei K et al: Evaluation of the diagnostic rate of liver hemangioma by 99mTc-labeled RBC SPECT—Comparison with US, CT, and angiography. Jpn J Nucl Med 30: 171-180, 1993 (Level 4)
3) Itai Y et al: Noninvasive diagnosis of small cavernous hemangioma of the liver: advantage of MRI. AJR 145: 1195-1199, 1985 (Level 4)
4) Stark DD et al: Magnetic resonance imaging of cavernous hemangioma of the liver: tissue-specific characterization. AJR 145: 213-222, 1985
(Level 4)
5) Ros PR et al: Hemangioma of the liver: heterogeneous appearance on T2-weighted images. AJR 149: 1167-1170, 1987 (Level 4)
6) McNicholas MM et al: T2 relaxation times of hypervascular and non-hypervascular liver lesions: do hypervascular lesions mimic haemangiomas on heavily T2-weighted MR images. Clin Radiol 51: 401-405, 1996 (Level 3)
7) Termanini B et al: Distingusishing small hepatic hemangiomas from vascular liver metastases in gastrinoma: use of a somatostatin-receptor
scintigraphic agent. Radiology 202: 151-158, 1997 (Level 4)
8) Yan FH et al: Role and pitfalls of hepatic helical multi-phase CT scanning in differential diagnosis of small hemangioma and small hepatocellular carcinoma. World J Gastroenterol 4: 343-347, 1998 (Level 4)
9) Brancatelli G et al: Hemangioma in the cirrhotic liver: diagnosis and natural history. Radiology 219: 69-74, 2001 (Level 4)
10) Yu JS et al: Hepatic cavernous hemangioma in cirrhotic liver: imaging findings. Korean J Radiol 1: 185-190, 2000 (Level 4)
11) Young LK et al: Hepatic hemangioma: quantitative color power US angiography-facts and fallacies. Radiology 207: 51-57, 1998 (Level 4)
12) Wilson SR et al: Harmonic hepatic US with microbubble contrast agent: initial experience showing improved characterization of hemangioma,
hepatocellular carcinoma, and metastasis. Radiology 215: 153-161, 2000 (Level 3)
13) Bartolotta TV et al: Liver haemangiomas undetermined at grey-scale ultrasound: contrast-enhancement patterns with SonoVue and pulseinversion US. Eur Radiol 15: 685-693, 2005 (Level 4)
14) Lee JY et al: Improved sonographic imaging of hepatic hemangioma with contrast-enhanced coded harmonic angiography: comparison with
MR imaging. Ultrasound Med Biol 28: 287-295, 2002 (Level 3)
15) Kato H et al: Atypically enhancing hepatic cavernous hemangiomas: high-spatial-resolution gadolinium-enhanced triphasic dynamic gradientrecalled-echo imaging findings. Eur Radiol 11: 2510-2515, 2001 (Level 4)
16) Berrington de González A, Darby S: Risk of cancer from diagnostic X-rays: estimates for the UK and 14 other countries. Lancet 363: 345-351,
2004 (Level 5)
17) Doo KW et al: “Pseudo washout” sign in high-flow hepatic hemangioma on gadoxetic acid contrast-enhanced MRI mimicking hypervascular
tumor. AJR 193: W490-496, 2009 (Level 4)
18) Goshima S et al: Hepatic hemangioma and metastasis: differentiation with gadoxetate disodium-enhanced 3-T MRI. AJR 195: 941-946, 2010
(Level 3)
19) Motosugi U et al: Distinguishing hepatic metastasis from hemangioma using gadoxetic acid-enhanced magnetic resonance imaging. Invest
Radiol 46: 359-365, 2011 (Level 3)
34
The Japanese imaging guideline 2013
CQ 074
74
Which imaging modalities are appropriate for the
definitive diagnosis of focal nodular hyperplasia
(FNH)?
Recommendation
grade
A
B
C1
A Dynamic MRI (EOB)
B Dynamic CT, dynamic MRI using an extracellular contrast agent
C1 Ultrasonography (non-contrast-enhanced)
Since iso-/hyperintensity compared with the surrounding liver parenchyma is a finding
characteristic of FNH in the hepatocyte phase of EOB contrast-enhanced MRI, the
modality is strongly recommended.
Dynamic CT or dynamic MRI using an extracellular contrast agent is also
recommended as modalities sufficiently capable of diagnosing FNH.
FNH is often difficult to diagnose by ultrasonography, but should be considered
because of its convenience.
Background/objective
Focal nodular hyperplasia (FNH) is a hypervascular lesion that arises in the background liver without chronic liver
disease (so-called normal liver), and it is considered a reactive lesion due to regional abnormality (increase) of the blood
flow.1) There are a large number of papers concerning the imaging diagnosis of FNH, and many of them regard “findings
on pathological examination or dynamic CT/MRI” as the gold standard. This suggests that typical findings on dynamic
CT/MRI are sufficient as the basis for the diagnosis of FNH on the clinical level. Practically, however, there are
instances in which the diagnosis is uncertain, and how much the reliability of the diagnosis can be increased is a point in
such cases.
Comments
Typical imaging findings of FNH can be summarized as follows:
1) Dynamic CT/MRI
Homogeneous (isodense or hypodense) interior on plain CT,2) lobulated margin,2) enhancement in the arterial phase
(nearly 100%),2-4) more intense enhancement in the arterial phase than hepatocellular adenoma,5,6) isodensity/isointensity
with the surrounding liver parenchyma in the portal venous-delayed phase,2-4) and central scar that is hypodense/
hypointense in the early phase, but contrast-enhanced in the late phase or thereafter, and hyperintense on T2-weighted
imaging.2,7)
2) Liver-specific phase of MRI using a liver-specific contrast agent
Iso-/hyperintensity compared with the surrounding liver parenchyma in the arterial phase of EOB contrast-enhanced
MRI (91%) (Figure A),5,8) hypointense central scar in the hepatocyte phase of EOB contrast-enhanced MRI (100%
when central scar is identified) (Figure B),8) and isointensity with the surrounding liver parenchyma in the Kupffer cell
phase of SPIO contrast-enhanced MRI (83%).9)
3) Abdominal ultrasonography
Diverse echogenicity,10) delineation of spoke-wheel blood flow signals or central vessels on Doppler or contrastenhanced ultrasonography (Figure C),11) and staining of the entire nodule in the early phase of contrast-enhanced
ultrasonography.11,12)
As mentioned above, FNH is often diagnosable by dynamic CT/MRI, and there have been few reports with a high
evidence level genuinely comparing the diagnostic accuracy among various imaging modalities. In 2008, Zech et al.
reported that FNH could be diagnosed with confidence more frequently by EOB contrast-enhanced MRI than by noncontrast-enhanced MRI or contrast-enhanced dynamic CT.8) Grazioli et al. compared the frequency of the appearance of
various findings on gadoxetic acid-enhanced MRI in 68 lesions of FNH and 43 lesions of hepatocellular adenoma and
reported that 93% (40/43) of the hepatocellular adenomas were hypointense in the hepatocyte phase of EOB contrastenhanced MRI, but that 91% (62/68) of the FNHs were iso-/hyperintense, and that the findings were useful for their
differential diagnosis.5) Bartolotta et al. compared non-contrast-enhanced and contrast-enhanced ultrasonography and
reported that findings characteristic of FNH (spoke-wheel, central scar, feeding vessel) are easier to confirm by contrastenhanced ultrasonography.12)
As observed above, characteristic findings are more often reported by contrast-enhanced ultrasonography, and the
use of a contrast agent is recommended when the diagnosis is made by ultrasonography. Since there has been no study
comparing contrast-enhanced ultrasonography and dynamic CT/MRI, their performance cannot be compared, but if
ultrasonography has demonstrated characteristic features allowing the diagnosis, further examination is unnecessary.
35
The Japanese imaging guideline 2013
5. Gastrointestinal tract
A
B
C
Figure: FNH
A Arterial phase of EOB contrast-enhanced MRI A mass that generally shows nearly homogeneous contrast
enhancement is observed. The margin is lobulated. B Hepatocyte phase of EOB contrast-enhanced MRI: The nodule is hyperintense compared with the surrounding liver
parenchyma except the central scar. C Abdominal ultrasonography: FNH is delineated as a lesion with an unclear border
slightly hypoechoic compared with the surrounding liver parenchyma ( → ).
While FNH can be sufficiently diagnosed by conventional dynamic CT/MRI, findings in the hepatocyte phase of EOB
contrast-enhanced MRI are useful for the definitive diagnosis, and the modality should be selected as the first choice.
Index words and secondary materials used as references
A search of PubMed was performed using “focal nodular hyperplasia”, “magnetic resonance imaging”, “CT”, and
“ultrasound” as key words.
References
1) Bioulac-Sage P et al: Focal nodular hyperplasia and hepatocellular adenoma, WHO Classification of Tumours of the Digestive System, 4th ed.
p198-199, IARC, 2009 (Level 5)
2) Brancatelli G et al: Focal nodular hyperplasia: CT findings with emphasis on multiphasic helical CT in 78 patients. Radiology 219: 61-68, 2001
(Level 4)
3) Mathieu D et al: Hepatic adenomas and focal nodular hyperplasia: dynamic CT Study. Radiology 160: 53-58, 1986 (Level 4)
4) Grazioli L et al: Accurate differentiation of focal nodular hyperplasia from hepatic adenoma at gadobenate dimeglumine-enhanced MR imaging: prospective study. Radiology 236: 166-177, 2005 (Level 4)
5) Grazioli L et al: Hepatocellular adenoma and focal nodular hyperplasia: value of gadoxetic acid-enhanced MR imaging in differential diagnosis.
Radiology 262: 520-529, 2012 (Level 3)
6) Ruppert-Kohlmayr AJ et al: Focal nodular hyperplasia and hepatocellular adenoma of the liver: differentiation with multiphasic helical CT. AJR
176: 1493-1498, 2001 (Level 4)
7) Mortelé KJ et al: Focal nodular hyperplasia of the liver detection and characterization with plain and dynamic-enhanced MRI. Abdom Imaging
27: 700-707, 2001 (Level 4)
8) Zech CJ et al: Diagnostic performance and description of morphological features of focal nodular hyperplasia in Gd-EOB-DTPA-enhanced liver
magnetic resonance imaging: results of a multicenter trial. Invest Radiol 43: 504-510, 2008 (Level 4)
9) Marin D et al: Focal nodular hyperplasia: interaindividual comparison of dynamic gadobenate dimeglumine- and ferucarbotran-enhanced magnetic resonance imaging. J Mag Res Imag 25: 775-782, 2007 (Level 3)
10) Bartolotta TV et al: Focal nodular hyperplasia in normal and fatty liver: a qualitative and quantitative evaluation with contrast-enhanced ultrasound. Eur Radiol 14: 583-591, 2004 (Level 4)
11) Piscaglia F et al: Diagnostic features of real-time contrast-enhanced ultrasound in focal nodular hyperplasia of the liver. Ultraschall Med 31:
276-282, 2010 (Level 4)
12) Bartolotta TV et al: Hepatic focal nodular hyperplasia: contrast-enhanced ultrasound findings with emphasis on lesion size, depth and liver
echogenicity. Eur Radiol 20: 2248-2256, 2010 (Level 4)
36
The Japanese imaging guideline 2013
CQ 075
75
Which imaging modalities are appropriate for the
diagnosis of liver tumors in patients with kidney or
liver dysfunction?
Recommendation
grade
B
C1
B Non-contrast-enhanced MRI, ultrasonography
C1 Contrast-enhanced CT, contrast-enhanced MRI (contrast agent to be used
selected according to kidney function)
Non-contrast-enhanced M R I i n c l u d i n g d i f f u s i o n - w e i g h t e d i m a g i n g a n d
ultrasonography including Sonazoid-enhanced imaging are recommended.
For contrast-enhanced CT or MRI in patients with kidney dysfunction, EOB-enhanced
MRI may be considered when the eGFR is 30-60 mL/min/1.73 m2, Resovist-enhanced
MRI when it is less than 30 mL/min/1.73 m2, and Resovist-enhanced MRI or contrastenhanced CT for dialysis patients.
Concerning contrast-enhanced CT/MRI for patients with liver dysfunction
corresponding to Child-Pugh class C, research on the appropriate selection of
examinations and contrast agents is insufficient.
Background/objective
Since kidney dysfunction restricts the use of iodine- or gadolinium-based contrast agents, and since liver dysfunction
reduces the contrast-enhancing effect of EOB・Primovist or Resovist, limitation of indications and decline in the
diagnostic performance of examinations are expected in patients with kidney or liver dysfunction.
Comments
Since Sonazoid,1) an ultrasound contrast agent, and Resovist, a liver-specific superparamagnetic iron oxide (SPIO)
contrast agent for MRI,2,3) do not affect the kidney function and are not known to increase adverse events associated
with kidney dysfunction, it permits contrast-enhanced imaging also in kidney dysfunction patients as usual.
In patients with an eGFR of less than 60 mL/min/1.73 m2, the risk of contrast-induced nephropathy due to the
administration of an iodine-based contrast agent increases, and contrast-enhanced CT is difficult to perform.4) The risk is
considered to be aggravated further by the concurrence of risk factors including diabetes, dehydration, congestive heart
failure, gout, an age of 70 years or above, and being under medication with NSAIDs.
In patients with kidney dysfunction, the risk of nephrogenic systemic fibrosis (NSF) due to gadolinium-based
contrast agents is increased. For this reason, the administration of an extracellular gadolinium-based contrast agent or
EOB・Primovist is avoided, in dialysis patients, patients with chronic kidney disease with an eGFR of less than 30 mL/
min/1.73 m2, and patients with acute renal failure. If the use of a gadolinium-based contrast agent is desirable after the
evaluation of benefits and risks, Gadodiamide (Omniscan) and Gadopentetate dimeglumine (Magnevist), which have
often been reported to induce NSF, should be avoided.5) Since EOB・Primovist is excreted via the liver as well as the
kidney, it appears to be advantageous compared with an extracellular gadolinium-based contrast agent. In practice,
however, its administration to dialysis patients cannot be recommended as clearance and contrast enhancement of the
liver parenchyma are known to be significantly reduced in dialysis patients.6)
The evidence of the selection of an appropriate contrast agent or examination according to the eGFR for contrastenhanced CT or MRI in patients with kidney dysfunction is insufficient. Therefore, recommendations of the present
guidelines are provisional. When the eGFR is 30-60 mL/min/1.73 m2, contrast-enhanced MRI using EOB・Primovist
with a high diagnostic ability is recommended, because the risk of NSF is not very high. When the eGFR is less than
30 mL/min/1.73 m2, the risk of NSF increases, and which of EOB・Primovist or Resovist should be recommended
for contrast-enhanced MRI is difficult to judge, but Resovist contrast-enhanced MRI is recommended as the package
insert of EOB・Primovist says, “Avoid the administration of this preparation,” and as the administration is likely to be
repeated. For dialysis patients, it is recommended to avoid gadolinium-based contrast agents and to select Resovistenhanced MRI or contrast-enhanced CT using an iodine-based contrast agent, which can be eliminated by dialysis,
according to the circumstances of the facility.
Patients with liver dysfunction show attenuation of the contrast-enhancing effect of EOB・Primovist in the hepatocyte
phase (Figure 1)7-9) and of Resovist in the so-called Kupffer phase.10) Research on the appropriate selection of contrastenhanced CT or MRI for patients with liver dysfunction corresponding to Child-Pugh class C is insufficient, and even
provisional recommendations are difficult.
Diffusion-weighted imaging has been reported to have some usefulness although it does not surpass that of contrastenhanced MRI (Figure 2).11-13) In patients with compromised kidney or liver function, diffusion-weighted imaging has
37
The Japanese imaging guideline 2013
5. Gastrointestinal tract
A
B
Figure 1: Hepatocellular carcinoma Poor contrast enhancement
in the hepatocyte phase of EOB・Primovist contrast-enhanced
MRI
A Arterial phase B Hepatocyte phase: A hypervascular hepatocellular
carcinoma is delineated in S5 of the liver in the arterial phase of
EOB・Primovist contrast-enhanced MRI ( → ). In the hepatocyte phase,
the signal intensity is nearly equal in the liver parenchyma and spleen,
indicating a decrease in contrast enhancement in the liver parenchyma.
The hepatocellular carcinoma ( → ) is nearly isointense with the
surrounding liver parenchyma, and its detection is difficult by hepatocyte
phase imaging alone.
Figure 2: Hepatocellular carcinoma
Diffusion-weighted imaging
By diffusion-weighed imaging with a b
value = 800, hepatocellular carcinoma
on the surface of the lateral segment
of the left hepatic lobe is visualized as
a hyperintense nodule ( → ). The lesion
was identified by surgery as a well-/
moderately-differentiated hepatocellular
carcinoma.
greater importance than usual.
Index words and secondary materials used as references
A search of PubMed was performed using “child score”, “liver function”, “ICG”, “liver failure”, “contrast media”,
“EOB”, “gadolinium”, “SPIO”, “superparamagnetic iron”, “iodinated contrast”, “iodine contrast”, “Sonazoid”,
“Oxides”, “diagnostic use”, “diagnostic imaging”, “MRI”, “CT”, “ultrasonography”, “diffusion weighted”, “DWI”,
and “hepatocellular carcinoma” as key words. The Japan Society of Hepatology ed: Clinical Practice Guidelines for
Hepatocellular Carcinoma 2009 update and Japan Radiological Society and Japanese Society of Nephrology eds:
Guidelines for Administering Gadolinium-Based Contrast Agents to Patients with Renal Dysfunction Second edition,
and ESUR guidelines on contrast media, version 7.0 were also used as references.
References
1) Binder T et al: NC100100, a new echo contrast agent for the assessment of myocardial perfusion--safety and comparison with technetium-99m
sestamibi single-photon emission computed tomography in a randomized multicenter study. Clin Cardiol 22: 273-282, 1999 (Level 2)
2) Kopp AF et al: MR imaging of the liver with Resovist: safety, efficacy, and pharmacodynamic properties. Radiology 204: 749-756, 1997 (Level 2)
3) Reimer P et al: Ferucarbotran (Resovist): a new clinically approved RES-specific contrast agent for contrast-enhanced MRI of the liver: properties, clinical development, and applications. Eur Radiol 13: 1266-1276, 2003 (Level 2)
4) European Society of Urogenital Radiology E: ESUR guidelines on contrast media, version 7.0. http://www.esur.org/Contrast-media.51.0.html.
2012 (Level 5)
5) Japan Radiological Society and Japanese Society of Nephrology eds.: Guidelines for Administering Gadolinium-Based Contrast Agents to
Patients with Renal Dysfunction (Second Edition). Joint Committee on NSF and the Use of Gadolinium-Based Contrast Agents, 2009 (Level 5)
6) Gschwend S et al: Pharmacokinetics and imaging properties of Gd-EOB-DTPA in patients with hepatic and renal impairment. Invest Radiol 46:
556-566, 2011 (Level 2)
7) Utsunomiya T et al: Possible utility of MRI using Gd-EOB-DTPA for estimating liver functional reserve. J Gastroenterol 47: 470-476, 2011
(Level 2)
8) Katsube T et al: Estimation of liver function using T1 mapping on Gd-EOB-DTPA-enhanced magnetic resonance imaging. Invest Radiol 46:
277-283, 2011 (Level 2)
9) Motosugi U et al: Liver parenchymal enhancement of hepatocyte-phase images in Gd-EOB-DTPA-enhanced MR imaging: which biological
markers of the liver function affect the enhancement? J Magn Reson Imaging 30: 1042-1046, 2009 (Level 3)
10) Chung YE et al: Quantification of superparamagnetic iron oxide-mediated signal intensity change in patients with liver cirrhosis using T2 and
T2* mapping: a preliminary report. J Magn Reson Imaging 31: 1379-1386, 2010 (Level 3)
11) Park MS et al: Hepatocellular carcinoma: detection with diffusion-weighted vs. contrast-enhanced MRI in pre-transplant patients. Hepatology
56: 140-148, 2012 (Level 3)
12) Vandecaveye V et al: Diffusion-weighted MRI provides additional value to conventional dynamic contrast-enhanced MRI for detection of hepatocellular carcinoma. Eur Radiol 19: 2456-2466, 2009 (Level 4)
13) Xu PJ et al: Added value of breathhold diffusion-weighted MRI in detection of small hepatocellular carcinoma lesions compared with dynamic
contrast-enhanced MRI alone using receiver operating characteristic curve analysis. J Magn Reson Imaging 29: 341-349, 2009 (Level 4)
38
The Japanese imaging guideline 2013
CQ 076
76
Which imaging examinations are appropriate when
acute cholangitis is suspected?
Recommendation
grade
A
B
C1
C2
A
B
C1
C2
Ultrasonography, CT
MR/MRCP
Plain radiography
ERCP
Ultrasonography is strongly recommended for all patients suspected to have acute
cholangitis because of its convenience and high diagnostic performance. CT is also
strongly recommended as it is excellent in determining the cause of acute cholangitis
and, particularly, delineating common bile duct stones that are difficult to visualize
by ultrasonography and the mechanism of obstruction by tumor and is useful for the
evaluation of the presence or absence of complications including abscess.
MRI/MRCP is recommended as it is useful for the determination of the cause of acute
cholangitis. Particularly, the delineation rate of common bile duct stones that are
difficult to visualize by ultrasonography is high.
While acute cholangitis cannot be diagnosed by plain radiography itself, it may be
considered for the differential diagnosis from other diseases. ERCP is basically
performed for drainage and is not recommended to be used for purely diagnostic
purposes. However, ERCP is performed preferentially for the diagnosis as well as
treatment of moderate to severe acute cholangitis, which may be fatal.
Background/objective
Acute cholangitis is an infection in which the bile duct is obstructed, preventing the flow of bile and allowing abnormal
proliferation of bacteria in bile. Severe acute cholangitis rapidly progresses to sepsis, which may be fatal, and prompt
diagnosis and treatment are needed. The significance of imaging modalities in acute cholangitis is high, and they are
performed for the evaluation of the presence or absence of bile duct obstruction/dilation and determination of the cause
of obstruction. As for assessment of severity of acute cholangitis, routine clinical information is usually used and local
imaging findings are not useful, except when an apparent abscess is formed.
Comments
Since there is no finding specific to acute cholangitis on plain radiography, it is impossible to diagnose the disease
by this modality alone. It should be regarded as an examination for the diagnosis of other diseases that must be
differentiated from acute cholangitis such as pneumonia, gastrointestinal perforation, and ileus.1,2) If CT has been
performed, plain radiography is unnecessary.
In patients suspected to have acute cholangitis, ultrasonography is the examination to be performed first as it is the
most convenient and least invasive.3,4) The findings of ultrasonography include biliary dilation, bile duct wall thickening,
and pneumobilia, but they are all non-specific.5) In addition to these findings, if a stone is delineated, it provides
additional support for the diagnosis. However, the sensitivity of ultrasonography for common bile duct stones is 20-60%
and is unsatisfactory.6)
CT is superior to ultrasonography in that a wider area can be scanned. CT findings of cholangitis itself are non-specific,
including biliary dilation, pneumobilia, and bile duct wall thickening, but uneven staining of the entire liver on dynamic
CT has recently been reported as an additional finding suggestive of active inflammation.7) Dynamic CT is also useful
for the determination of the cause of obstruction and the presence or absence of complications such as liver abscess
and peribiliary abscess. Examinations including non-contrast CT are useful for the diagnosis of stones as a cause of
obstruction.8) (See CQ77 and CQ78)
By MRI, it is possible to visualize bile duct dilation, edema of the bile duct mucosa, peribiliary edema, and
fluid retention,9) but comprehensive evaluation based on findings including clinical information is still important.
Hypointensity on heavily T2-weighted imaging and moderate signal intensity on fat-suppressed T1-weighted imaging
are considered to be findings specific to pus in the bile duct,9) but its discrimination from biliary sludge is a problem.
39
The Japanese imaging guideline 2013
5. Gastrointestinal tract
Although hyperintensity along the portal tract observed on T2-weighted imaging, which suggests inflammation, is also
observed frequently but is non-specific.10) MRCP satisfactorily visualizes biliary stones and malignant diseases that
can cause obstruction.12,13) Since it allows the evaluation of the entire biliary system, it is useful as a guide for drainage.
While its sensitivity and specificity are both 90% or higher for delineation of stones,11,12,14) its diagnostic performance for
small (≤ 6 mm) stones is reportedly limited.11,15)
ERCP is very important as it has the highest ability for diagnosing the cause of obstruction in acute cholangitis and is
also used therapeutically for drainage. The above non-invasive examinations are performed if the disease is clinically
mild, but ERCP is selected preferentially with drainage in mind if the disease is moderate or severe and can be lethal.16)
Index words and secondary materials used as references
A search of PubMed was performed using “cholangitis”, “radiography”, “ultrasonography”, “computed tomography”,
“magnetic resonance imaging”, and “endoscopic retrograde cholangiopancreatography” as key words. Committee for
the Preparation of Tokyo guidelines for the management of acute cholangitis ed: Tokyo guidelines for the management
of acute cholangitis and cholecystitis, 1st edition, 2005, and Evidence-Based Imaging, 2011 were also used as
references.
References
1) Laméris JS, van Overhagen H: Imaging and intervention in patients with acute right upper quadrant disease. Baillieres Clin Gastroenterol 9:
21-36, 1995 (Level 5)
2) Rothrock SG et al: Efficacy of plain abdominal radiography in patients with biliary tract disease. J Emerg Med 8: 271-275, 1990 (Level 4)
3) Rosen CL et al: Ultrasonography by emergency physicians in patients with suspected cholecystitis. Am J Emerg Med 19: 32-36, 2001 (Level
3)
4) Kendall JL, Shimp RJ: Performance and interpretation of focused right upper quadrant ultrasound by emergency physicians. J Emerg Med 21:
7-13, 2001 (Level 2)
5) Laméris JS, van Overhagen H: Imaging and intervention in patients with acute right upper quadrant disease. Baillieres Clin Gastroenterol 9:
21-36, 1995 (Level 5)
6) Gandolfi L et al: The role of ultrasound in biliary and pancreatic diseases. Eur J Ultrasound 16: 141-159, 2003 (Level 5)
7) Arai K et al: Dynamic CT of acute cholangitis: early inhomogeneous enhancement of the liver. AJR 181: 115-118, 2003 (Level 2)
8) Balthazar EJ et al: Acute cholangitis: CT evaluation. J Comput Assist Tomogr 17: 283-289, 1993 (Level 3)
9) Håkansson K et al: MR characteristics of acute cholangitis. Acta Radiol 43: 175-179, 2002 (Level 4)
10) Watanabe Y et al: MR imaging of acute biliary disorders. Radiographics 27: 477-495, 2007 (Level 5)
11) Laokpessi A et al: Value of magnetic resonance cholangiography in the preoperative diagnosis of common bile duct stones. Am J
Gastroenterol 96: 2354-2359, 2001 (Level 3)
12) Lomanto D et al: Magnetic resonance-cholangiopancreatography in the diagnosis of biliopancreatic diseases. Am J Surg 174: 33-38, 1997
(Level 4)
13) Fulcher AS et al: Half-Fourier RARE MR cholangiopancreatography: experience in 300 subjects. Radiology 207: 21-32, 1998 (Level 3)
14) Verma D et al: EUS vs MRCP for detection of choledocholithiasis. Gastrointest Endosc 64: 248-254, 2006 (Level 1)
15) Zidi SH et al: Use of magnetic resonance cholangiography in the diagnosis of choledocholithiasis: prospective comparison with a reference
imaging method. Gut 44: 118-122, 1999 (Level 2)
16) Lai EC et al: Endoscopic biliary drainage for severe acute cholangitis. N Engl J Med 326: 1582-1586, 1992 (Level 2)
40
The Japanese imaging guideline 2013
CQ 077
77
Which examinations are appropriate when
choledocholithiasis accompanied by biliary
obstruction is suspected?
Recommendation
grade
A
B
C1
C2
A
B
C1
C2
Ultrasonography
MRI/MRCP
CT
ERCP
Ultrasonography, which is simple and shows high diagnostic performance, is strongly
recommended as the examination to be performed first for all patients suspected to
have choledocholithiasis accompanied by biliary obstruction.
MRI/MRCT has high detection sensitivity and specificity for choledocholithiasis and is
recommended to be performed.
Non-contrast CT is less sensitive than MRI/MRCP but more sensitive than
ultrasonography and should be considered.
ERCP is the gold standard for the diagnosis of choledocholithiasis but is invasive. It is
not an imaging modality to be selected first and should be performed for the treatment
as well as diagnosis of abnormalities detected by less invasive modalities.
Background/objective
When choledocholithiasis accompanied by biliary obstruction is suspected, which examinations should be performed
and at what timing? For the efficient diagnosis and prompt initiation of treatment, characteristics and roles of 4
diagnostic modalities were evaluated in this section.
Comments
1) Ultrasonography
Its specificity for detecting choledocholithiasis is nearly 100%, but its sensitivity is 68% at the highest and is less
than 50% in many reports.1) This low sensitivity is due to limitations of delineation of stones in the common bile
duct depending on their size, skill of the examiner, and various other factors. Also, according to a study comparing
the common bile duct diameter measured by ultrasonography and intraoperative cholangiographic findings, stones
were detected in 6% of the patients with a normal common bile duct diameter (≤ 5 mm) but 37.5% of those with a
diameter of >5 mm.2) Therefore, a dilated common bile duct can be a marker for suspecting choledocholithiasis. Since
ultrasonography is easy to perform and non-invasive, it should be the imaging examination of choice and is one of
the predictive factors when choledocholithiasis is suspected. In addition, the detection of choledocholithiasis has been
reported to be facilitated further by tissue harmonic imaging.3)
2) CT
Non-contrast CT plays the primary role (See the standard imaging techniques for imaging techniques to be performed
when stones are suspected). The sensitivity of CT for the detection of choledocholithiasis has been reported to be 6588%.4-7) Stones may be isodense depending on their composition, and the sensitivity decreases to 24-26%, making their
detection difficult.8,9)
3) MRI/MRCP
According to a meta-analysis of 67 papers (4,711 cases), both the sensitivity and specificity of MRCP for the
detection of choledocholithiasis are high at 92 (80-97) and 97 (90-99)%, respectively.10) As shown in the figure, MRI/
MRCP can clearly visualize stones in the common bile duct and is considered to be the most reliable non-invasive
examination. While the sensitivity of MRCP for biliary obstruction is 95%, its sensitivity for choledocholithiasis is
lower at 92%, and that for malignant diseases is even lower at 88%.10) One of the causes of this decrease in sensitivity
for choledocholithiasis is the size of stones. There are reports that the sensitivity decreased from 100 to 64% in common
bile duct stones 3 mm or less in diameter11) and that 100% of common bile duct stones 5 mm or greater in diameter but
only 62% of stones less than 5 mm in diameter could be detected.12) EUS is an examination as reliable as MRI/MRCP
for the diagnosis of choledocholithiasis. A systematic review comparing EUS and MRCP reported no difference in the
detection power for common bile duct stones.13)
41
The Japanese imaging guideline 2013
5. Gastrointestinal tract
Figure: Choledocholithiasis MRI/MRCP
3D fast spin echo sequence (SPACE)
A stone in the common bile duct is clearly
visualized as a defect.
4) ERCP
Since ERCP has been regarded as the standard for the diagnosis of choledocholithiasis, reports of the results by
ERCP alone are limited. Recently, its sensitivity and specificity have been reported to be 93 and 100%, respectively.14)
Incidental events such as pancreatitis, infection, bleeding, and perforation as well as unsuccessful attempts have been
reported. If moderate or severe signs of infection are observed in the initial diagnostic procedure, diagnostic ERCP with
treatment in mind is recommended to be performed without additional examinations.
Index words and secondary materials used as references
A search of PubMed was performed using “biliary obstruction”, “choledocholithiasis”, “US”, “CT”, “MRI”, and
“ERCP” as key words limited to reports up until July, 2012. ASGE guideline 2010 and Springer Evidence-based
imaging, 2011 were also used as references.
References
1) Gandolfi L et al: The role of ultrasound in biliary and pancreatic diseases. Eur J Ultrasound 16: 141-159, 2003 (Level 3)
2) Majeed AW et al: Common duct diameter as an independent predictor of choledocholithiasis: is it useful? Clin Radiol 54: 170-172, 1999 (Level
4)
3) Ortega D et al: Tissue harmonic imaging: is it a benefit for bile duct sonography? Am J Radiol 176: 653-659, 2001 (Level 4)
4) Soto JA et al: Diagnosing bile duct stones: comparison of unenhanced helical CT, oral contrast-enhanced CT cholangiography, and MR cholangiography. AJR 175: 1127-1134, 2000 (Level 2)
5) Neitlich JD et al: Detection of choledocholithiasis: comparison of unenhanced helical CT and endoscopic retrograde cholangiopancreatography. Radiology 203: 753-757, 1997 (Level 3)
6) Tseng CW et al: Can computed tomography with coronal reconstruction improve the diagnosis of choledocholithiasis? J Gastroenterol Hepatol
23: 1586-1589, 2008 (Level 4)
7) Anderson SW et al: Detection of biliary duct narrowing and choledocholithiasis: accuracy of portal venous phase multidetector CT. Radiology
247: 418-427, 2008 (Level 3)
8) Baron RL et al: CT evaluation of gallstones in vitro: correlation with chemical analysis. AJR 151: 1123-1128, 1988 (Level 2)
9) Brakel K et al: Predicting gallstone composition with CT: in vivo and in vitro analysis. Radiology 174: 337-341, 1990 (Level 2)
10) Romagnuolo J et al: Magnetic resonance cholangiopancreatography: a meta-analysis of test performance in suspected biliary disease. Ann
Intern Med 139: 547-557, 2003 (Level 1)
11) Mendler MH et al: Value of MR cholangiography in the diagnosis of obstructive diseases of the biliary tree: a study of 58 cases. Am J
Gastroenterol 93: 2482-2490, 1998 (Level 3)
12) Boraschi P et al: Choledocholithiasis: diagnostic accuracy of MR cholangiopancreatography. Three-year experience. Magn Reson Imaging 17:
1245-1253, 1999 (Level 3)
13) Verma D et al: EUS vs MRCP for detection of choledocholithiasis. Gastrointest Endosc 64: 248-254, 2006 (Level 1)
14) Tseng LJ et al: Over-the-wire US catheter probe as an adjunct to ERCP in the detection of choledocholithiasis. Gastrointest Endosc 54: 720723, 2001 (Level 4)
42
The Japanese imaging guideline 2013
CQ 078
78
Which modalities are appropriate for the diagnosis of
gallstones/bile duct stones?
Recommendation
grade
A
C1
C2
D
A
A
C1
C1
C2
D
Ultrasonography (recommended as the initial examination)
MRI/MRCP (recommended when bile duct stones are suspected)
CT
DIC (performed as DIC-CT)
ERCP
Plain radiography
Ultrasonography is strongly recommended as the initial examination. MRI/MRCP is
also strongly recommended when bile duct stones are suspected. CT is inferior to
MRI/MRCP in sensitivity for bile duct stones, but its use may be worth considering.
DIC may also be worth considering if it is performed as DIC-CT using MDCT.
ERCP is not recommended for pure diagnostic uses, but it should be performed
preferentially if it is necessary for treatment. Plain radiography is not recommended
because of the radiation exposure and low detection power.
Background/objective
Various imaging modalities have been used from early times for the detection of gallstones and bile duct stones. They
vary widely from non-invasive to highly invasive methods regarding radiation exposure and incidental events. Many
studies on the diagnostic abilities of various examinations and their comparisons have been reported. In this section,
these reports were summarized, and the commendation grade of each examination in clinical practice was determined.
Comments
1) Plain radiography
Of biliary tract stones, 15-20% are considered to have calcification sufficient to be visualized by plain radiography.1)
While the modality is inexpensive, it is not recommended for the detection of gallstones/bile duct stones due to radiation
exposure and low detection sensitivity.2) In non-traumatic abdominal pain, plain radiography is often ineffective for
acute abdomen, and its effectiveness is limited to the detection of ileus and foreign bodies.3,4)
2) Ultrasonography
Ultrasonography is an inexpensive and safe examination. Its sensitivity, specificity, and accuracy for gallstones were
about 75, 62, and 72%, respectively, in an early study,5) but the accuracy improved to 93%6,7) or exceeded 95% in
subsequent evaluations.R-1) In the diagnosis of gallbladder disorders in general, the overall accuracy was 98.9%, false
negative rate was 2.2%, and false positive rate was 2.8%.8) The accuracy of ultrasonography for all diseases was 93%,
false negative rate was 11%, and unclear diagnosis rate was 4%. According to a meta-analysis of the diagnostic ability
of emergency unit bedside ultrasonography for gallstones (8 papers, 710 cases), the sensitivity was 89.8% (95% CI:
86.4-92.5%), and the specificity was 88% (95% CI: 83.7-91.4%).9)
For common bile duct stones, its sensitivity and specificity were 25 and 89%,10) or 63 and 95%, respectively.11)
In conclusion, ultrasonography is recommended as the initial imaging examination for the presence diagnosis of bile
duct stones/gallstones although its detection ability for bile duct stones remains questionable.
3) CT
According to an evaluation in 1987, gallstones were detected by CT at a sensitivity of 79.1%, specificity of 100%,
and accuracy of 89.8%.12) By another report published in the same year, the sensitivity of CT for bile duct stones was
76% and considered insufficient (Figure).13) A study comparing the usefulness of plain radiography and non-contrastenhanced CT for the examination of non-traumatic acute abdomen including gallstones reported that the sensitivity of
plain radiography was low, and that non-contrast-enhanced CT was accurate. CT can replace plain radiography as the
initial imaging examination.3)
In a relatively new report concerning bile duct stones, the sensitivity and specificity of non-contrast-enhanced CT were
65 and 84%, respectively,14) and the sensitivity, specificity, and accuracy of CT with MPR for common bile duct stones
were 88.9, 92.6, and 90.7%, respectively.15)
CT for the presence diagnosis of stones is typically non-contrast-enhanced.
4) MRI/MRCP
According to a meta-analysis reviewing 67 reports with appropriate diagnostic criteria (4,711 cases), the sensitivity and
43
The Japanese imaging guideline 2013
5. Gastrointestinal tract
Figure: Gallstones CT and MRI
Even latest CT with improved image quality often completely fails to
delineate stones.
specificity of MRCT for biliary tract diseases were 95 and 97%, respectively, the sensitivity for gallstones was 92%, and
the sensitivity for malignant tumors was 88%.16) MRCP was concluded as a non-invasive and appropriate examination
for biliary tract diseases.
Two meta-analyses of papers comparing MRCP and EUS (301 and 405 cases) reported no significant difference in the
diagnostic ability between the two modalities.17,18) While there is a report that patients in whom ERCP can be spared by
the information obtained by MRCP are limited,19) MRCP is recommended as a non-invasive examination for gallstones/
bile duct stones in symptomatic patients.
5) DIC
There is no clear report about the ability of conventional 2-dimensional DIC to detect gallstones/bile duct stones.
Contrast agents used for DIC tend to more often cause adverse events than "other" iodine-based contrast agents.20) Also,
the biliary tract may not be visualized depending on its patency or liver function. The sensitivity and specificity of CT
cholangiography using 8-detector-row MDCT were 78 and 100% for gallstones/bile duct stones, and those of MRCP
performed simultaneously were 94 and 88%, respectively.20)
DIC cannot be a standard examination for gallstones/bile duct stones due to side effects of iodine-based contrast
agents, radiation exposure, and reduced delineation ability in the presence of hyperbilirubinemia.
6) ERCP
The detection power of ERCP for bile duct stones is high, and the modality has been used as a standard examination in
many studies. There is also a report that patients in whom ERCP can be spared by the information obtained by MRCP
are limited.20) However, ERCP is associated with risks that cannot be ignored such as pancreatitis and cholangitis.18)
Even when ERCP is performed for the diagnosis alone, 3-5% of the patients develop pancreatitis with a mortality rate of
0.2-0.5%. Also, ERCP is reported to be unnecessary in gallstone patients who are normal on biliary ultrasonography and
liver function tests.21)
While ERCP is not recommended for purely diagnostic purposes, it should be performed preferentially when treatment
is necessary.
Index words and secondary materials used as references
A search of PubMed was performed using “gallstone”, “cholecystolithiasis”, “choledocholithiasis”, “detection”,
“abdominal radiograph”, “US”, “CT”, “MRI”, “MRCP”, “DIC”, and “ERCP” as key words.
References
1) Bortoff GA et al: Gallbladder stones: imaging and intervention. Radiographics 20: 751-766, 2000 (Level 5)
2) Eisenberg RL et al: Evaluation of plain abdominal radiographs in the diagnosis of abdominal pain. Ann Intern Med 97: 257-261, 1982 (Level 3)
3) Mackersie AB et al: Nontraumatic acute abdominal pain: unenhanced helical CT compared with three-view acute abdominal series. Radiology
237: 114-122, 2005 (Level 2)
4) Ahn SH et al: Acute nontraumatic abdominal pain in adult patients: abdominal radiography compared with CT evaluation. Radiology 225: 159164, 2002 (Level 2)
5) Goldberg BB et al: Ultrasonic and radiographic cholecystography, a comparison. Radiology 111: 405-409, 1974(Level 4)
44
The Japanese imaging guideline 2013
CQ 078
6) Bartrum RJ et al: Ultrasonic and radiographic cholecystography. N Engl J Med 296: 538-541, 1977 (Level 2)
7) Crade M et al: Surgical and pathologic correlation of cholecystsonography and cholecystography. AJR 131: 227-229, 1978 (Level 4)
8) Mclntosh DMF et al: Gray-scale ultrasonography as a screening procedure in the detection of gallbladder disease. Radiology 136: 725-727,
1980 (Level 4)
9) Ross M et al: Emergency physician-performed ultrasound to diagnose cholelithiasis: a systematic review. Acad Emerg Med 18: 227-235, 2011
(Level 1)
10) Gross BH et al: Ultrasonic evaluation of common bile duct stones: prospective comparison with endoscopic retrograde cholangiopancreatography. Radiology 146: 471-474, 1983 (Level 2)
11) Sugiyama M et al: Endoscopic ultrasonography for diagnosing choledocholithiasis: a prospective comparative study with ultrasonography and
computed tomography. Gastrointest Endosc 45: 143-146, 1997 (Level 3)
12) Barakos JA et al: Cholelithiasis: evaluation with CT. Radiology 162: 415-418, 1987 (Level 3)
13) Baron RL.: Common bile duct stones: reassessment of criteria for CT diagnosis. Radiology 162: 419-424, 1987 (Level 3)
14 Soto JA et al: Diagnosing bile duct stones: comparison of unenhanced helical CT, oral contrast-enhanced CT cholangiography, and MR cholangiography. AJR 175: 1127-1134, 2000 (Level 2)
15) Chung WS et al: Diagnostic accuracy of multidetector-row computed tomography for common bile duct calculi: is it necessary to add noncontrast-enhanced images to contrast-enhanced images? J Comput Assist Tomogr 31: 508-512, 2007 (Level 2)
16) Romagnuolo J et al: Magnetic resonance cholangiopancreatography: a meta-analysis of test performance in suspected biliary disease. Ann
Intern Med 139: 547-557, 2003 (Level 1)
17) Verma D et al: EUS vs MRCP for detection of choledocholithiasis. Gastrointest Endosc 64: 248-254, 2006 (Level 1)
18) Ledro-Cano D: Suspected choledocholithiasis: endoscopic ultrasound or magnetic resonance cholangiopancreatography? A systematic
review. Eur J Gastroenterol Hepatol 19: 1007-1011, 2007 (Level 1)
19) Sahai AV et al: The decision-making value of magnetic resonance cholangiopancreatography in patients seen in referral center for suspected
biliary and pancreatic disease. Am J Gastroenterol 96: 2074-2080, 2001 (Level 2)
20) Okada M et al: The value of drip infusion cholangiography using multidetector-row helical CT in patients with choledocholithiasis. Eur Radiol
15: 2140-2145, 2005 (Level 3)
21) Changchien CS et al: Is ERCP necessary for symptomatic gallbladder stone patients before laparoscopic cholecystectomy. Am J
Gastroenterol 90: 2124-2127, 1995 (Level 3)
45
The Japanese imaging guideline 2013
5. Gastrointestinal tract
79
Which imaging modalities are appropriate when acute
cholecystitis is suspected?
Recommendation
grade
A
B
C1
C2
A
B
C1
C2
Ultrasonography
CT, MRI/MRCP
Plain radiography
Biliary scintigraphy, DIC
Ultrasonography is strongly recommended to be performed first in all patients
suspected to have acute cholecystitis.
CT need not be performed in all patients but is recommended as it is useful when
the definitive diagnosis is difficult by other examinations or for the evaluation of local
complications.
Plain radiography should be considered for the differentiation from other diseases.
MRI/MRCP is recommended to be performed as it is useful for the diagnosis of acute
cholecystitis and shows high delineation rate for stones in the neck of gallbladder
and cystic duct. However, biliary scintigraphy and DIC, which used to be used for the
diagnosis of acute cholecystitis, are scarcely performed in Japan today. It is also not
recommended from the viewpoint of convenience.
Background/objective
Acute cholecystitis is a collective term for all inflammatory diseases of the gallbladder. It is reported to be caused by
gallstones in 90-95% of the patients and to occur in every 2 of 3 patients with gallstones. It may also occur after surgery,
trauma, or burn injury or be caused by long-term intravenous alimentation, malignant neoplasms, hepatic arterial
infusion therapy, diabetes, drugs, or infection (non-calculous cholecystitis), and these conditions are reportedly more
difficult to diagnose and more often follow a serious or lethal course than acute cholecystitis due to gallstones.
Acute cholecystitis is diagnosed comprehensively on the basis of clinical symptoms such as fever, right upper quadrant
pain, and Murphy sign, blood test results such as elevated WBC and CRP, and imaging findings. Although the total
mortality rate due to acute cholecystitis is low, being less than 10%, severe conditions such as gangrenous cholecystitis,
purulent cholecystitis, gallbladder perforation, and emphysematous cholecystitis are occasionally observed, and the
urgency and contents of treatment vary with the condition. Imaging examination plays an important role in the severity
evaluation.
Comments
Ultrasonography is the examination that should be performed first in patients suspected to have acute cholecystitis as
it is the most convenient and least invasive.1,2) Findings suggestive of acute cholecystitis include pain on compression
of the gallbladder with a probe (sonographic Murphy sign), gallbladder enlargement, gallbladder wall thickening of
3 mm or more, gallstones, biliary sludge, free fluid around the gallbladder, and hypoechoic zones showing irregular
multilaminate structures.2,3) Among them, a combination of the presence of gallstones and sonographic Murphy sign
is considered to be the most sensitive.3,4) Gallbladder wall thickening of 3 mm or more and hypoechoic zones showing
irregular multilaminate structures are also findings with relatively high diagnostic value.2) However, as stones in the
neck of gallbladder or cystic duct causing acute cholecystitis are occasionally difficult to visualize by ultrasonography,
careful examination by scanning from multiple angles and with changes in the body position is necessary. There is also
a report that the sensitivity, specificity, and accuracy could be improved to 95, 100, and 99%, respectively, surpassing
the usual diagnostic ability of ultrasonography (86, 99, and 92%, respectively), by evaluating increases in the blood flow
of the gallbladder wall by (color or power) Doppler ultrasonography.2)
It has been reported that CT has lower diagnostic power than ultrasonography and that acute cholecystitis was
diagnosed in 82% of the patients by ultrasonography but in only 36% by contrast-enhanced CT.5) CT findings suggestive
of acute cholecystitis include gallbladder enlargement, gallbladder wall thickening, increased radiodensity of bile, fluid
around the gallbladder, fat stranding around the gallbladder, and subserosal edema (Figure 1).6) However, the modality
is considered useful for the diagnosis of local complications such as perforation and abscess, and tear of the gallbladder
wall was reported to be difficult to detect by ultrasonography with an accuracy of 39% but to be detected more often by
contrast-enhanced CT with an accuracy of 69%.7) Also, as the evaluation of gallstones by non-contrast CT is essential, a
combination of non-contrast and contrast-enhanced CT is appropriate for the diagnosis of acute cholecystitis.
By MRI, gallbladder enlargement, wall thickening, and inflammatory changes around the gallbladder can be visualized.
Hyperintensities around the gallbladder on T2-weighted imaging correspond to fluid retention and edema. MRI is
46
The Japanese imaging guideline 2013
CQ 079
Figure 1: Acute cholecystitis CT
The gallbladder shows enlargement, wall thickening,
and subserosal edema, findings consistent with acute
cholecystitis. Faintly hyperdense structures about
3 mm thick are observed in the fundus and neck of
gallbladder, suggesting stones.
Figure 2: Acute cholecystitis MRI T2-weighted
imaging
A few hypointense nodules about 3 mm in diameter,
suspected to be gallstones, are observed in the
fundus of gallbladder. The gallbladder wall is
thickened to 3 mm, and hyperintense areas observed
around the gallbladder are considered to represent
subserosal edema and fluid retention, which do not
contradict acute cholecystitis.
useful for the diagnosis of acute cholecystitis (Figure 2).8) However, it must be noted that hyperintensities around
the gallbladder in T2-weighted images are false positive findings in patients with liver cirrhosis.8) In addition, MRCP
showed an accuracy of 97%, which was higher than the accuracy by ultrasonography (77%), for stones in the neck of
gallbladder and cystic duct.9)
Plain radiography is useful for the discrimination of diseases that must be differentiated from acute cholecystitis such
as gastrointestinal perforation and ileus, but there is no finding specific to acute cholecystitis.10)
On biliary scintigraphy, acute cholecystitis can be diagnosed if the gallbladder is not delineated despite nearly normal
technetium hepatobiliary iminodiacetic acid uptake by the liver or excretion into the common bile duct. In 1982, the
accuracy of biliary scintigraphy (85%) was comparable to that of ultrasonography (88%),11) and the modality used to be
the first choice examination for acute cholecystitis in Western countries, but its priority has presently been reduced due
to the long scanning time and radiation exposure.
Drip infusion cholangiography (DIC) is a simple method to visualize the bile duct and gallbladder that used to be
used for the diagnosis of acute cholecystitis and gallstones as the only technique for biliary tract imaging other than
intraoperative cholangiography,12) but is has been mostly eliminated due to the low diagnostic performance and high
frequency of allergic reactions to the contrast agent.
Index words and secondary materials used as references
A search of PubMed was performed using “cholecystitis”, “radiography”, “ultrasonography”, “CT”, “MRI”,
“scintigraphy”, and “intravenous cholangiography” as key words.
References
1) Rosen CL et al: Ultrasonography by emergency physicians in patients with suspected cholecystitis. Am J Emerg Med 19: 32-36, 2001 (Level 2)
2) Soyer P et al: Color velocity imaging and power Doppler sonography of the gallbladder wall: a new look at sonographic diagnosis of acute cholecyctitis. AJR 171: 183-188, 1998 (Level 3)
3) Ralls PW et al: Real-time sonography in suspected acute cholecystitis: prospective evaluation of primary and secondary signs. Radiology 155:
767-771, 1985 (Level 4)
4) Bree RL et al: Further observations on the usefulness of the sonographic Murphy sign in the evaluation of suspected acute cholecystitis. J Clin
Ultrasound 23: 169-172, 1995 (Level 4)
5) Harvey RT et al: Acute biliary disease: initial CT and follow-up US versus initial US and follow-up CT. Radiology 213: 831-836, 1999 (Level 3)
6) Fidler J et al: CT evaluation of acute cholecyctitis: findings and usefulness in diagnosis. AJR 166: 1085-1088, 1996 (Level 3)
7) Kim PN et al: Gallbladder perforation: comparison of US findings with CT. Abdom Imaging 19: 239-242, 1994 (Level 4)
8) Hakansson K et al: MR imaging in clinically suspected acute cholecyctitis. A comparison with ultrasonography. Acta Radiol 41: 322-328, 2000 (Level 3)
9) Park MS et al: Acute cholesystitis: comparison of MR cholangiography and US. Radiology 209: 781-785, 1998 (Level 2)
10) Rothrock SG et al: Efficacy of plain abdominal radiography in patients with biliary tract disease. J Emerg Med 8: 271-275, 1990 (Level 3)
11) Ralls PW et al: Prospective evaluation of 99mTc-IDA cholescintigraphy and gray-scale ultrasound in the diagnosis of acute cholecystitis.
Radiology 144: 369-371, 1982 (Level 4)
12) Persson A et al: Volume rendering of three-dimensional drip infusion CT cholangiography in patients with suspected obstructive biliary disease: a retrospective study. Br J Radiol 78: 1078-1085, 2005 (Level 3)
47
The Japanese imaging guideline 2013
5. Gastrointestinal tract
80
Is CT appropriate when cholangiocarcinoma is
suspected?
Recommendation
grade
B
CT is useful or the diagnosis of cholangiocarcinoma and is recommended.
Background/objective
For the diagnosis of cholangiocarcinoma, CT and MRI as well as abdominal ultrasonography are generally performed
as non-invasive examinations, and there have been a number of reports on their usefulness. Recently, the excellence and
reliability, particularly, of MDCT as a first-line examination are being established at many facilities. The usefulness of
CT for the diagnosis of cholangiocarcinoma is evaluated.
Comments
CT is superior to ultrasonography in the delineation of obstruction or dilation of intra- and extrahepatic bile ducts
and is useful for the presence diagnosis of bile duct obstruction. Particularly, in ultrasonography of obese patients and
patients with gas in the gastrointestinal tract, the middle/lower biliary tract is often difficult to evaluate but can mostly
be visualized clearly by CT.
Also, contrast-enhanced CT is an examination appropriate for the diagnosis of bile duct obstruction1,2) and can provide
clear visual information necessary for this purpose including information concerning the site of the tumor or obstruction
and adjacent anatomical structures. For the diagnosis of malignant neoplasms in patients with bile duct obstruction, the
sensitivity, specificity, and accuracy of CT are reported to be 77, 63, and 83%, respectively.3,4)
CT has also been reported to be useful for the staging of malignant neoplasms and superior to other modalities in
diagnosing vascular invasion, with an accuracy of 85%.4)
While its diagnostic ability for cancer of the ampulla of Vater and invasive cholangiocarcinoma is limited, it has
recently become possible to obtain high-quality images by the introduction of MDCT with high spatial resolution,
resulting in improvements in the delineation of bile duct and vascular structures. In the evaluation of the longitudinal
extent of invasion of cholangiocarcinoma, the accuracy of MDCT was reported to be 90-100%.5)
Moreover, in the evaluation of morphological subtypes of cholangiocarcinoma (nodular, periductal infiltrating, and
intraductal growing types), exact typing was reportedly possible by MDCT with an accuracy of 78.6%.6) Particularly,
as a combination of transverse and coronal images more accurately reflects pathological features of the tumor than
transverse images alone, high-quality multiplanar reconstruction (MPR) images in MDCT have been suggested to
facilitate the evaluation of the anatomy of the biliary system and extent of tumor invasion, and the evaluation with the
addition of MPR images is recommended (Figure).
Index words and secondary materials used as references
A search of PubMed was performed using “CT” and “extrahepatic cholangiocarcinoma” as key words. Evidence-Based
Imaging (Springer), 2011 was also used as a reference.
References
1) Mortele KJ et al: CT and magnetic resonance imaging in pancreatic and biliary tract malignancies. Gastrointest Endosc 56: S206-212, 2002
(Level 4)
2) Talamonti MS et al: Staging and surgical management of pancreatic and biliary cancer and inflammation. Radiol Clin North Am 40: 1397-1410,
2002 (Level 4)
3) Rösch T et al: A prospective comparison of the diagnostic accuracy of ERCP, MRCP, CT, and EUS in biliary strictures. Gastrointest Endosc
55: 870-876, 2002 (Level 4)
4) Schwartz LH et al: Neoplastic pancreaticobiliary duct obstruction: evaluation with breath-hold MR cholangiopancreatography. AJR 170: 14911495, 1998 (Level 4)
5) Park MS et al: Preoperative staging accuracy of multidetector row computed tomography for extrahepatic bile duct carcinoma. J Comput Assist
Tomogr 30: 362-367, 2006 (Level 4)
6) Seo H et al: Evaluation of the gross type and longitudinal extent of extrahepatic cholangiocarcinomas on contrast-enhanced multidetector row
computed tomography. J Comput Assist Tomogr 33: 376-382, 2009 (Level 4)
48
The Japanese imaging guideline 2013
CQ 080
A
B
Figure: Invasive cholangiocarcinoma
A On MDCT/MPR imaging, contrast enhancement of the thickened wall is observed from the upper biliary
tract to the right and left hepatic ducts ( → ).
B In the transverse image of MDCT, circumferential wall thickening is noted with dilatation of the intrahepatic
bile duct ( → ).
49
The Japanese imaging guideline 2013
5. Gastrointestinal tract
81
Are MRI and MRCP appropriate when
cholangiocarcinoma is suspected?
Recommendation
grade
B
MRI and MRCP are useful for the diagnosis of cholangiocarcinoma and are
recommended.
Background/objective
Generally, for the diagnosis of cholangiocarcinoma, CT and MRI as well as abdominal ultrasonography are performed
as non-invasive examinations, and there have been a number of reports on their usefulness. MRI of the abdominal
region has continued to be improved with the recent innovations in hardware and software. The role of MRI and MRCP
in the diagnosis of cholangiocarcinoma is evaluated.
Comments
MRCP can clearly visualize the entire biliary system compared with ultrasonography and is excellent in identifying the
site of obstruction. It can also delineate the normal common bile duct in 98% or more of the patients.1) According to a
meta-analysis concerning the presence diagnosis of benign or malignant bile duct obstruction and determination of the
sites of obstruction,2) the sensitivity was 97 and 98%, respectively. In other studies, also, the accuracy was 95-100% and
97-100%, respectively.1,3-6)
Also, unlike other techniques for direct imaging of the bile duct such as ERCP and PTC, MRCP is useful for imaging
of the dilated bile duct proximal to the site of stenosis and excels, particularly, in the visualization of the stenotic area
and diagnosis of multiple bile duct stenoses.7,8) While MRCP is highly accurate in the diagnosis of bile duct obstruction
and identification of the obstruction sites, its accuracy in the qualitative diagnosis of bile duct obstruction is presently
not considered sufficient. There have been a report that the sensitivity of MRCP for the discrimination of benign
and malignant diseases was 88%2) and another report that its sensitivity, specificity, and accuracy for the detection
of cholangiocarcinoma were 74.3, 71.4, and 73.2%, respectively.9) The recent improvements in the performance of
MR devices and development of imaging techniques including parallel imaging have contributed to the shortening of
the scanning time and improvements in the SNR and spatial resolution and have advanced the MRI diagnosis in the
abdominal region.
Particularly, diffusion-weighted imaging is widely applied today to clinical practice. The detection rate of
cholangiocarcinoma by this modality has been reported to be significantly higher than that by MRCP with sensitivity,
specificity, and accuracy of 94.3, 100, and 96.4%, respectively.9) According to an evaluation concerning the delineation
of cholangiocarcinoma by dynamic study combined with 3D fat-suppressed imaging at 3T, tumors and surrounding
structures could be clearly visualized, and the procedure was useful for the evaluation of vascular obstruction/stenosis
and tumor invasion and, with the addition of coronal images, contributed to the evaluation of the growth pattern of
tumors and longitudinal extent of tumor invasion.10) Although the diagnostic ability of MRI for cholangiocarcinoma is
suggested to be improved by diffusion-weighted imaging and fat-suppressed dynamic study using 3D imaging technique
inclusing coronal views as well as MRCP (Figure), further evaluation is considered necessary.
Index words and secondary materials used as references
A search of PubMed was performed using “MRI” and “extrahepatic cholangiocarcinoma” as key words. EvidenceBased Imaging (Springer), 2011 was also used as a reference.
50
The Japanese imaging guideline 2013
CQ 081
A
C
Figure: Invasive cholangiocarcinoma
B
A MRCP/3D showed a defect in the hilar bile
duct and marked dilatation of the intrahepatic
bile duct ( → ).
B On LAVA (3T)/coronal imaging, contrast
enhancement is observed in the thickened wall
from the upper bile duct to the left and right
hepatic ducts ( → ).
C On DWI, a hyperintense area is noted at the
site of the tumor ( → ).
References
1) Soto JA et al: Magnetic resonance cholangiography: comparison with endoscopic retrograde cholangiopancreatography. Gastroenterology
110: 589-597, 1996 (Level 4)
2) Romagnuolo J et al: Magnetic resonance cholangiopancreatography: a meta-analysis of test performance in suspected biliary disease. Ann
Intern Med 139: 547-557, 2003 (Level 2)
3) Calvo MM et al: Role of magnetic resonance cholangiopancreatography in patients with suspected choledocholithiasis. Mayo Clin Proc 77:
422-428, 2002 (Level 4)
4) Schwartz LH et al: Neoplastic pancreaticobiliary duct obstruction: evaluation with breath-hold MR cholangiopancreatography. AJR 170: 14911495, 1998 (Level 4)
5) Varghese JC et al: A prospective comparison of magnetic resonance cholangiopancreatography with endoscopic retrograde cholangiopancreatography in the evaluation of patients with suspected biliary tract disease. Clin Radiol 54: 513-520, 1999 (Level 4)
6) Zhong L et al: Imaging diagnosis of pancreato-biliary diseases: a control study. World J Gastroenterol 9: 2824-2827, 2003 (Level 4)
7) Lopera JE et al: Malignant hilar and perihilar biliary obstruction: use of MR cholangiography to define the extent of biliary ductal involvement
and plan percutaneous interventions. Radiology 220: 90-96, 2001 (Level 4)
8) Fulcher AS et al: HASTE MR cholangiography in the evaluation of hilar cholangiocarcinoma. AJR 169: 1501-1505, 1997 (Level 4)
9) Xing-Yu Cui et al: Role of diffusion-weighted magnetic resonance imaging in the diagnosis of extrahepatic cholangiocarcinoma. World J
Gastroenterol 16: 3196-3201, 2010 (Level 4)
10) Li N et al: MRCP and 3D LAVA imaging of extrahepatic cholangiocarcinoma at 3 T MRI. Clin Radiol 67: 579-586, 2012 (Level 4)
51
The Japanese imaging guideline 2013
5. Gastrointestinal tract
82
Are CT and MRI appropriate for the discrimination
between cholangiocarcinoma and cholangitis?
Recommendation
grade
C1
No clear evidence has been reported regarding the usefulness of CT/MRI for the
discrimination between cholangiocarcinoma and cholangitis. However, it is important
to detect tumors and evaluate findings suggestive of cholangiocarcinoma such as
metastatic foci including lymph node metastasis and vascular invasion.
Background/objective
Reports on the discrimination between benign and malignant diseases by CT/MRI in patients suspected to have
biliary tract stenosis are few, and the discrimination is often clinically difficult. The usefulness of these modalities
for the discrimination of benign and malignant diseases is evaluated on the basis of reports on CT/MRI findings in
cholangiocarcinoma and cholangitis.
Comments
Generally, for the diagnosis of biliary tract stenosis due to malignant tumors, it is important to detect tumors and
metastatic foci including lymph node metastases and vascular invasion.1-3) Also, it has been reported that many benign
stenoses including traumatic and non-traumatic ones are characteristically short in extent, smooth, and symmetric,
but dilatation of the bile duct proximal to the site of stenosis is more notable in malignant biliary tract stenoses and
the extent of stenosis tends to be longer than in benign stenoses.1,3,4) On the other hand, primary sclerosing cholangitis
causing diffuse bile duct stenosis has been reported to be characterized by multifocal bile duct stenosis/dilatations and
to have been accurately diagnosed by MRCP in 90% or more of the patients.5,6) Clinically, however, the discrimination
of benign and malignant diseases is not always easy, and the discrimination of primary sclerosing cholangitis and
sclerosing cholangitis related to autoimmune (IgG4-related) pancreatitis from cholangiocarcinoma is often difficult.7-9)
Concerning sclerosing cholangitis related to autoimmune pancreatitis, in particular, it has recently been reported that
the disease shows significant differences in the extent of stenosis and maximum diameter of the part of the bile duct
showing wall thickening, that wall thickening is eccentric in cholangiocarcinoma but concentric in cholangitis, and that
this difference contributes to their discrimination.10) According to another report, however, no significant difference was
noted in these respects, the extent of the area of wall thickening was significantly longer in cholangitis, and the area
of stenosis was not necessarily in agreement with the area of wall thickening, contradicting with previous reports.11)
Moreover, the frequency of skip lesions has been reported to be higher in cholangitis than in cholangiocarcinoma,11) but
there have been no consistent findings concerning the discrimination between the two disorders.
Recently, with technological innovations in hardware and software of CT/MRI, high-quality MPR and 3D images
of MDCT and diffusion-weighted imaging and fat-suppressed 3D dynamic study including coronal views have been
suggested to contribute to improvements in the diagnosis of disorders of the biliary system (Figure).12-17) Further
evaluation is considered necessary for the future.
Index words and secondary materials used as references
A search of PubMed was performed using “CT”, “MRI”, “extrahepatic cholangiocarcinoma”, and “cholangitis” as key
words. Evidence-Based Imaging (Springer), 2011 was also used as a reference.
52
The Japanese imaging guideline 2013
CQ 082
A
B
Figure: Sclerosing cholangitis complicating autoimmune pancreatitis
A On MDCT (MPR image), contrast enhancement is noted in the diffusedly thickened wall of the upper to
lower bile duct with smooth tapering to the lower bile duct ( → ). B CT shows circumferential wall thickening
and stenosis ( → ).
References
1) Choi SH et al: Differentiating malignant from benign common bile duct stricture with multiphasic helical CT. Radiology 236: 178-183, 2005
(Level 4)
2) Rosch T et al: A prospective comparison of the diagnostic accuracy of ERCP, MRCP, CT, and EUS in biliary strictures. Gastrointest Endosc
55: 870-876, 2002 (Level 4)
3) Park MS et al: Differentiation of extrahepatic bile duct cholangiocarcinoma from benign stricture: findings at MRCP versus ERCP. Radiology
233: 234-240, 2004 (Level 4)
4) Soto JA et al: Biliary obstruction: findings at MR cholangiography and cross-sectional MR imaging. Radiographics 20: 353-366, 2000 (Level 4)
5) Fulcher AS et al: HASTE MR cholangiography in the evaluation of hilar cholangiocarcinoma. AJR 169: 1501-1505, 1997 (Level 4)
6) Textor HJ et al: Three-dimensional magnetic resonance cholangiopancreatography with respiratory triggering in the diagnosis of primary sclerosing cholangitis: comparison with endoscopic retrograde cholangiography. Endoscopy 34: 984-990, 2002 (Level 4)
7) Hayashi K et al: Autoimmune sclerosing cholangiopancreatitis with little pancreatic involvements by imaging findings. Hepatogastroenterology
54: 2146-2151, 2007 (Level 4)
8) Hamano H et al: Immunoglobulin G4-related lymphoplasmacytic sclerosing cholangitis that mimics infiltrating hilar cholangiocarcinoma: part of
a spectrum of autoimmune pancreatitis? Gastrointest Endosc 62: 152-157, 2005 (Level 4)
9) Kuroiwa T et al: Bile duct involvement in a case of autoimmune pancreatitis successfully treated with an oral steroid. Dig Dis Sci 47: 18101816, 2002 (Level 4)
10) Arikawa S et al: Comparison of sclerosing cholangitis with autoimmune panreatitis and infiltrative extrahepatic cholangiocarcinoma: multidetector-row computed tomography findings. Jpn J Radiol 28: 205-213, 2010 (Level 4)
11) Maeda E et al: Comparison of CT findings of biliary tract changes with autoimmune panreatitis and extrahepatic bile duct cholangiocarcinoma.
Jpn J Radiol 30: 227-234, 2012 (Level 4)
12) Park MS et al: Preoperative staging accuracy of multidetector row computed tomography for extrahepatic bile duct carcinoma. J Comput Assist
Tomogr 30: 362-367, 2006 (Level 4)
13) Cho ES et al: Biliary ductal involvement of hilar cholangiocarcinoma: multidetector computed tomography versus magnetic resonance cholangiography. J Comput Assist Tomogr 31: 72-78, 2007 (Level 4)
14) Ahmetoglu A et al: MDCT cholangiography with volume rendering for the assessment of patients with biliary obstruction. AJR 183: 1327-1332,
2004 (Level 4)
15) Kim HJ et al: Biliary ductal evaluation of hilar cholangiocarcinoma: three-dimensional direct multi-detector row CT cholangiographic findings
versus surgical and pathologic results-feasibility study. Radiology 238: 300-308, 2006 (Level 4)
16) Xing-Yu Cui et al: Role of diffusion-weighted magnetic resonance imaging in the diagnosis of extrahepatic cholangiocarcinoma. World J
Gastroenterol 16: 3196-3201, 2010 (Level 4)
17) Li N et al: MRCP and 3D LAVA imaging of extrahepatic cholangiocarcinoma at 3 T MRI. Clin Radiol 67: 579-586, 2012 (Level 4)
53
The Japanese imaging guideline 2013
5. Gastrointestinal tract
83
Is CT appropriate when gallbladder cancer is
suspected?
Recommendation
grade
B
When gallbladder cancer is suspected, CT is useful for the qualitative diagnosis of
the lesion and determination of the therapeutic approach and is recommended to be
performed.
Background/objective
While abdominal ultrasonography (US) is commonly used for screening of gallbladder lesions, MDCT has recently
become widely available in clinical practice to provide images with high spatial resolution, and the degree of
contribution of CT to the diagnosis of gallbladder lesions has increased. When gallbladder cancer is suspected, the
usefulness of CT for the differentiation of benign and malignant diseases and determination of the therapeutic strategy
was evaluated.
Comments
When gallbladder cancer is suspected, it is the most important first to differentiate benign and malignant diseases.
According to a report comparing CT and EUS, the sensitivity and specificity of EUS were 86 and 87%, and those of
CT were 72 and 91%, respectively, being in favor of EUS.1) Particularly, CT shows a high specificity of 94% for early
intramural gallbladder cancer but a considerably low sensitivity of 33%,2) and the diagnosis is difficult even with the
exhaustive use of MPR images by multislice CT. While polypoid lesions can be diagnosed with relatively high accuracy
using morphological criteria (size>1 cm, wide-based), the ability of CT is insufficient to distinguish benign and
malignant lesions with diffuse wall thickening.3,4)
The evaluation of the local depth of the lesion is important for the determination of the surgical procedure and
prognosis. According to reports to date, the accuracy of T staging by CT is relatively high at 71-93%,2,5-7) but EUS,
which visualizes the laminar structure of the gallbladder wall, is superior in evaluating intramural lesions (≤ T2)
(Figure).3,8,9) However, concerning T3 or more advanced lesions showing invasion beyond the serosa such as direct
intrahepatic invasion and invasion to the bile duct side, there are many reports that CT is superior with a sensitivity
of 80-100% and a specificity of 81-95% compared with EUS, which has limitations in the scanning area, and that it is
useful for the determination of the surgical procedure.2,3,6,9)
CT is superior to other modalities in evaluating the presence or absence of involvement of the portal vein or arteries
and distant metastases including lymph node and liver metastases, which is important for the determination of the
therapeutic approach to advanced cancers.8,9) However, concerning lymph node metastases, judgments are presently
dependent on the size (≥ 1 cm) and morphology (round), and the accuracy has been less than 80% in many reports to
date.10,11)
To summarize the above observations, if gallbladder cancer is intramural (≤ T2), the usefulness of CT, with a limited
ability to delineate the laminar structure of the gallbladder wall, is insufficient for its discrimination from benign
diseases or evaluation of its depth. However, if the lesion has spread beyond the serosa (≥ T3), CT is equally or more
useful than other modalities for the evaluation of involvement of surrounding organs, lymph node metastasis, and
distant metastasis. It is indispensable for the determination of the surgical procedure or therapeutic strategy for advanced
cancers.
Index words and secondary materials used as references
A search of PubMed was performed using “gallbladder”, “cancer”, “carcinoma”, and “CT” as key words. Papers
considered useful among those cited in the initially selected materials were adopted as additional references.
54
The Japanese imaging guideline 2013
CQ 083
A
B
Figure: Gallbladder cancer Dynamic contrast-enhanced CT
A Early phase B Delayed phase: An elevated lesion protruding into the lumen is observed in the wall
of the gallbladder body on the abdominal cavity side. The tumor was relatively well-enhanced in the early
phase, and delayed enahncement was noted at the base of the elevated lesion ( → ). Such findings on
MRI have been reported to be possible signs of subserosal invasion, but those on CT may also be useful.
(Yoshimitsu K et al: Magnetic resonance differentiation between T2 and T1 gallbladder carcinoma:
significance of subserosal enhancement on the delayed phase dynamic study. Magn Reson Imaging,
2012)
References
1) Jang JY et al: Differential diagnostic and staging accuracies of high resolution ultrasonography, endoscopic ultrasonography, and multidetector
computed tomography for gallbladder polypoid lesions and gallbladder cancer. Ann Surg 250: 943-949, 2009 (Level 2)
2) Yoshimitsu K et al: Helical CT of the local spread of carcinoma of the gallbladder: evaluation according to the TNM system in patients who
underwent surgical resection. AJR 179: 423-428, 2002 (Level 2)
3) Rodríguez-Fernández A et al: Application of modern imaging methods in diagnosis of gallbladder cancer. J Surg Oncol 93: 650-664, 2006
(Level 4)
4) Onoyama H et al: Diagnostic imaging of early gallbladder cancer: retrospective study of 53 cases. World J Surg 23: 708-712, 1999 (Level 4)
5) Kim SJ et al: Accuracy of preoperative T-staging of gallbladder carcinoma using MDCT. AJR 190: 74-80, 2008 (Level 4)
6) Kumaran V et al: The role of dual-phase helical CT in assessing resectability of carcinoma of the gallbladder. Eur Radiol 12: 1993-1999, 2002
(Level 3)
7) Kim BS et al: Accuracy of CT in local staging of gallbladder carcinoma. Acta Radiol 43: 71-76, 2002 (Level 3)
8) Sadamoto Y et al: Preoperative diagnosis and staging of gallbladder carcinoma by EUS. Gastrointest Endosc 58: 536-541, 2003 (Level 3)
9) Reid KM et al: Diagnosis and surgical management of gallbladder cancer: a review. J Gastrointest Surg 11: 671-681, 2007 (Level 4)
10) Ohtani T et al: Carcinoma of the gallbladder: CT evaluation of lymphatic spread. Radiology 189: 875-880, 1993 (Level 3)
11) Lee SW et al: Clinical usefulness of 18F-FDG PET-CT for patients with gallbladder cancer and cholangiocarcinoma. J Gastroenterol 45: 560566, 2010 (Level 4)
55
The Japanese imaging guideline 2013
5. Gastrointestinal tract
84
Is MRI appropriate when gallbladder cancer is
suspected?
Recommendation
grade
C1
When gallbladder cancer is suspected, MRI provides information useful for the
qualitative diagnosis of the lesion and determination of the therapeutic strategy and
should be considered.
Background/objective
While extracorporeal ultrasonography (US) is widely used for screening of gallbladder lesions, MRI has also become a
more routine examination than before with improvements in spatial resolution due to advances in MRI technology. The
high contrast resolution characteristic of MRI may contribute to the diagnosis of gallbladder lesions. The usefulness of
MRI for the differentiation of benign and malignant lesions and determination of treatment when gallbladder cancer is
suspected is summarized.
Comments
When gallbladder cancer is suspected, it is the most important first to discriminate benign and malignant lesions. In
polypoid lesions, it has been reported that the lesions are suspected to be malignant when delayed phase enhancement is
observed on dynamic contrast-enhanced imaging,1) but the diagnosis presently depends on morphological criteria (size>1
cm, wide-based). Concerning lesions showing diffuse wall thickening, MRI is not considered to have a sufficient ability
for qualitative diagnosis except for lesions that show clear extramural invasion. According to a recent evaluation, the
ability of diffusion-weighted imaging to discriminate benign and malignant lesions is presently considered insufficient,
with sensitivity and specificity being both 78%.2) However, the delineation of Rokitansky-Aschoff sinus (RAS) by
MRCP is useful for the differentiation of gallbladder cancer from gallbladder adenomyomatosis.3)
The evaluation of the local depth is important for the determination of the surgical procedure and prognosis. In lesions
showing extraserosal spread such as direct intrahepatic invasion and invasion to the bile duct side, the sensitivity and
specificity of MRI are high at 67-100 and 86-100%, respectively, which are similar to those of CT, and many reports
suggest the usefulness of MRI for the determination of the surgical procedure.4-7) Regarding intramural lesions, the
evaluation has been conventionally considered difficult by MRI as well as CT, but, due to the recent improvements in
spatial and temporal resolutions in addition to the high contrast resolution, it has been reported that T1 and T2 lesions
could be diagnosed with sensitivity and specificity of 86 and 88%, respectively, based on delayed phase enhancement of
the subserosal layer on dynamic contrast-enhanced MRI.8)
Similarly to CT, MRI excels other modalities in the evaluation of the presence or absence of portal and arterial
invasion and distant metastases such as lymph node and liver metastases, which are important for the determination of
surgical indications in advanced cancers.4-7) However, MRI is slightly inferior to CT in the area that can be scanned at a
time and preoperative evaluation of detailed anatomical orientation of the lesion.
To summarize the above observations, MRI is excellent in the evaluation of extraserosal spread of lesions such as
invasion to surrounding organs and lymph node and distant metastases similarly to CT, but it is slightly inferior to CT
in the scanning area and preoperative evaluation of detailed anatomical orientation of the lesion. While its usefulness
does not surpass that of CT at present, improvements in its usefulness for the qualitative diagnosis are expected due to
dynamic contrast-enhanced imaging by diffusion-weighted and 3D imaging techniques (Figure).
Index words and secondary materials used as references
A search of PubMed was performed using “gallbladder”, “cancer”, “carcinoma”, and “MRI” as key words. Also,
papers considered useful among those cited in the initially selected materials were used as additional references.
56
The Japanese imaging guideline 2013
CQ 084
A
B
Figure: Gallbladder cancer with liver invasio
A Contrast-enhanced MRI B Contrast-enhanced CT: A lesion showing irregular diffuse wall thickening is
observed in the fundus of the gallbladder. Contrast enhancement of the mucosa is interrupted, and direct
invasion to the liver bed is noted.
References
1) Yoshimitsu K et al: Dynamic MRI of the gallbladder lesions: differentiation of benign from malignant. J Magn Reson Imaging 7: 696-701, 1997
(Level 4)
2) Ogawa T et al: High b-value diffusion-weighted magnetic resonance imaging for gallbladder lesions: differentiation between benignity and
malignancy. J Gastroenterol 47: 1352-1360, 2012 (Level 4)
3) Haradome H et al: The pearl necklace sign: an imaging sign of adenomyomatosis of the gallbladder at MR cholangiopancreatography.
Radiology 227: 80-88, 2003 (Level 4)
4) Schwartz LH et al: Gallbladder carcinoma: findings at MR imaging with MR cholangiopancreatography. J Comput Assist Tomogr 26: 405-410,
2002 (Level 4)
5) Kim JH et al: Preoperative evaluation of gallbladder carcinoma: efficacy of combined use of MR imaging, MR cholangiography, and contrastenhanced dual-phase three-dimensional MR angiography. J Magn Reson Imaging 16: 676-684, 2002 (Level 3)
6) Rodríguez-Fernández A et al: Application of modern imaging methods in diagnosis of gallbladder cancer. J Surg Oncol 93: 650-664, 2006
(Level 4)
7) Kaza RK et al: Evaluation of gall bladder carcinoma with dynamic magnetic resonance imaging and magnetic resonance cholangiopancreatography. Australas Radiol 50: 212-217, 2006 (Level 4)
8) Yoshimitsu K et al: Magnetic resonance differentiation between T2 and T1 gallbladder carcinoma: significance of subserosal enhancement on
the delayed phase dynamic study. Magn Reson Imaging 30: 854-859, 2012(Level 4)
57
The Japanese imaging guideline 2013
5. Gastrointestinal tract
85
Are CT and MRI appropriate for the discrimination
between gallbladder cancer and cholecystitis?
Recommendation
grade
C1
The diagnosis of diffuse wall thickening type gallbladder cancer and cholecystitis,
particularly xanthogranulomatous cholecystitis, by CT and MRI is still often difficult.
However, discriminating findings have been reported, and these modalities should be
considered.
Background/objective
Symptoms and clinical findings of gallbladder cancer and cholecystitis often overlap, and their differential diagnosis is
frequently difficult. However, they are diseases completely different in treatment and prognosis, and it is very important
to more accurately discriminate them. The usefulness of CT and MRI for the discrimination between gallbladder cancer
and cholecystitis is summarized on the basis of the reports to date.
Comments
If gallbladder cancer presents as a polypoid lesion, it poses little problem in the discrimination from cholecystitis,
and its differentiation from benign polyps is a greater problem. However, if it is a diffuse wall thickening type, it is
important to discriminate it from cholecystitis. Regarding points of differentiation, uneven wall thickening, interruption
of contrast enhancement on the mucosal surface, and invasion to surrounding tissues have been reported to suggest
gallbladder cancer, and the presence of gallstones and intramural defects of contrast enhancement suggesting intramural
abscesses as findings indicating cholecystitis.1,2) It has also been reported that gallbladder cancer is more often visualized
in the early phase of dynamic imaging,3) shows uneven contrast enhancement of the wall, presents stronger contrast
enhancement on the luminal side of the thickened wall,4) or is hyperintense (reduced ADC) at diffusion-weighted
imaging.5) In practice, however, its discrimination from chronic cholecystitis is often difficult, and its differentiation
from xanthogranulomatous cholecystitis in particular is even more difficult. According to reports to the present, diffuse
wall thickening (sensitivity: 89%, specificity: 65%), continuity of the mucosa (sensitivity: 61%, specificity: 71%),
hypodensity in the thickened wall (sensitivity: 67%, specificity: 71%), lack of invasion to the liver bed (sensitivity: 72%,
specificity: 77%), and lack of intrahepatic bile duct dilatation (sensitivity: 67%, specificity: 71%) have been useful for
the differentiation between gallbladder cancer and xanthogranulomatous cholecystitis, and the sensitivity and specificity
were 83 and 100%, respectively, when at least 3 of these findings were present.6-8) There are also reports that fat in
xanthogranuloma could be detected by chemical shift imaging.9,10) In practice, however, findings frequently overlap,
making their differential diagnosis difficult. It is also important to note that the presence or absence of metastatic foci
such as lymph node metastasis can be a point of differentiation although it is an indirect finding.
At present, CT and MRI allow the discrimination between gallbladder cancer and cholecystitis, particularly
xanthogranulomatous cholecystitis, to some extent, but the findings often overlap (Figure). Therefore, it is often
impossible to exclude gallbladder, and the dependence on surgical resection persists due to the difficulty in precise
differentiation.
Index words and secondary materials used as references
A search of PubMed was performed using “gallbladder”, “cancer”, “cholecystitis”, and “CT or MRI” as key words.
Papers considered useful among those cited in the initially selected materials were also adopted as additional references.
58
The Japanese imaging guideline 2013
CQ 085
A
B
C
Figure: Xanthogranulomatous cholecystitis
A Contrast-enhanced CT B Contrast-enhanced MRI C MRI T2-weighted imaging Marked wall thickening and a
large number of defects of contrast enhancement suggestive of intramural abscesses are observed. Gallstones are
noted in the areas considered to be the lumen. The disease was confirmed as xanthogranulomatous cholecystitis by
surgery.
References
1) Demachi H et al: Dynamic MRI using a surface coil in chronic cholecystitis and gallbladder carcinoma: radiologic and histopathologic correlation. J Comput Assist Tomogr 21: 643-651, 1997 (Level 4)
2) Liang JL et al: Gallbladder carcinoma manifesting as acute cholecystitis: clinical and computed tomographic features. Surgery 146: 861-868,
2009 (Level 3)
3) Yoshimitsu K et al: dynamic MRI of the gallbladder lesions: differentiation of benign from malignant. J Magn Reson Imaging 7: 696-701, 1997
(Level 4)
4) Kim SJ et al: Analysis of enhancement pattern of flat gallbladder wall thickening on MDCT to differentiate gallbladder cancer from cholecystitis.
AJR 191: 765-771, 2008 (Level 4)
5) Ogawa T et al: High b-value diffusion-weighted magnetic resonance imaging for gallbladder lesions: differentiation between benignity and
malignancy. J Gastroenterol 47: 1352-1360, 2012(Level 4)
6) Goshima S et al: Xanthogranulomatous cholecystitis: diagnostic performance of CT to differentiate from gallbladder cancer. Eur J Radiol 74:
e79-83, 2010 (Level 2)
7) Chang BJ et al: Distinguishing xanthogranulomatous cholecystitis from the wall-thickening type of early-stage gallbladder cancer. Gut Liver 4:
518-523, 2010 (Level 3)
8) Uchiyama K et al: Xanthogranulomatous cholecystitis: the use of preoperative CT findings to differentiate it from gallbladder carcinoma. J
Hepatobiliary Pancreat Surg 16: 333-338, 2009 (Level 3)
9) Hatakenaka M et al: Xanthogranulomatous cholecystitis: importance of chemical-shift gradient-echo MR imaging. Eur Radiol 13: 2233-2235,
2003 (Level 5)
10) Nakayama T et al: Fat detection in gallbladder carcinoma with extensive xanthogranulomatous change demonstrated by chemical shift MR
imaging. Abdom Imaging 28: 684-687, 2003 (Level 5)
59
The Japanese imaging guideline 2013
5. Gastrointestinal tract
86
Is contrast-enhanced CT appropriate for diagnosis
and assessment of severity in acute pancreatitis?
Recommendation
grade
A
Contrast-enhanced CT is strongly recommended for the diagnosis and severity
assessment of acute pancreatitis.
Background/objective
Acute pancreatitis is classified as acute abdomen. It is acute inflammation of the pancreatic parenchyma and is divided
into mild cases that can be managed by conservative treatment and severe cases in which inflammation is not localized
in the pancreatic parenchyma but spreads to tissues and organs not only around, but also distant from, the pancreas, and
fatal complications such as systemic circulatory insufficiency, multiple organ failure, and severe infections develop due
to systemic inflammatory response syndrome (SIRS). Imaging modalities play an important role in the evaluation of
complications affecting the whole body as well as the state of the pancreas itself. If the disease follows a serious course,
the mortality rate is very high, and the assessment of disease severity is closely related to the appropriateness of the
selection of treatments.1)
Comments
Acute pancreatitis is frequently manifest as an edematous pancreas and responds to conservative treatments. However,
about 20% of the cases are classified as severe acute pancreatitis, showing systemic inflammatory changes and
subsequently developing various complications, with a high mortality rate.1) If the diagnosis of acute pancreatitis cannot
be confirmed, or if the cause of pancreatitis cannot be identified by clinical findings, blood tests, and urinalysis, CT
should be performed readily.
CT provides objective images of a wide area of the body without being affected by gas in the gastrointestinal tract
or adipose tissue in the abdominal wall or cavity and is suitable for the evaluation of not only pancreatic necrosis and
changes around the pancreas but also complications extending to other parts.2-5) CT is used for the severity assessment
as well as diagnosis of acute pancreatitis as mentioned below, and contrast-enhanced CT is recommended, if possible. If
the condition is mild edematous pancreatitis, the only findings on contrast-enhanced CT are homogeneous delineation
of the pancreatic parenchyma, normal-sized or only mildly enlarged pancreatic parenchyma itself (Figure 1), and slight
hyperdensity of the adipose tissue around the pancreas.1) Local edema extends along the mesentery, mesocolon, and
hepatoduodenal ligament to the abdominal cavity, and typical CT findings are enlargement of the pancreas, increased fat
density in tissues around the pancreas to the retroperitoneal cavity (primarily, the anterior pararenal space), mesocolon,
and mesentery proper, exudate retention (Figure 2), pseudocyst formation, heterogeneous density of the pancreatic
parenchyma, pancreatic necrosis (Figure 3), fat necrosis of the retroperitoneal cavity and mesentery, hematoma, and
pancreatic rupture on injury. Gas in and around the pancreas is often caused by fistula formation to the intestine or
infection by gas-producing microorganisms (Figure 4). In more distant areas, bilateral pleural effusion and atelectasis
may also occur.6) Indications of contrast-enhanced CT should be evaluated in consideration of the history of allergy to
contrast agents and renal function.
The criteria for assessment of severity in acute pancreatitis by the Ministry of Health, Labour and Welfare (2008)
consist of 9 prognostic factors and also mention the contrast-enhanced CT grade as an independent item. These
assessment criteria are also adopted in the guidelines for the management of acute pancreatitis: JPN guidelines 2010,
and the disease is judged to be severe when the prognostic factor score is 3 or higher, or the contrast-enhanced CT grade
is 2 or higher. Since the presence or absence of pancreatic necrosis and extrapancreatic spread of inflammation are
closely related to the frequency of the occurrence of complications and mortality rate,1,7) these factors are incorporated
in the contrast-enhanced CT grade. For contrast-enhanced CT grading, the pancreatic parenchyma is divided into 3
segments for convenience, i.e. the head, body, and tail, poorly enhanced areas are regarded as necrotic areas, and the
extent of necrotic areas is reflected in the grade. Also, the extent of extrapancreatic spread of inflammation is added to
the assessment as another factor, and the grade elevates as inflammation extends to the anterior pararenal space, to the
base of the mesocolon, and to areas beyond the lower pole of the kidney. Advantages of contrast-enhanced CT are its
usefulness for the diagnosis of complications such as pseudocysts, abscesses, mesenteric hemorrhage, non-obstructive
mesenteric ischemia, false aneurysms, and portal thrombosis4,5) and its excellence in delineation of pancreatic duct
stenosis due to small pancreatic cancers,8) which may cause acute pancreatitis, in addition to the evaluation of the area
of intra- and extra-pancreatic spread mentioned above.
60
The Japanese imaging guideline 2013
CQ 086
degree of extrapancreatic
spread
*
*
anterior
pararenal
space
hypo-enhanced
area of pancreas
localized in a segment of,
or around, the pancreas
base of the
mesocolon
lower pole of
the kidney
*
involving 2 segments
occupying 2 entire
segments or wider
Grade 1
Grade 2
Severe when CT Grade >2
Grade 3
Figure 1: Acute edematous pancreatitis (CT Grade 1)
On contrast-enhanced CT, the entire pancreatic parenchyma is enlarged, but no clear hypo-enhanced
area is noted. Effusion (*) is observed around the pancreas, and a diagnosis of acute pancreatitis with a
CT Grade of 1 can be made.
transverse mesocolon
*
*
*
*
right anterior
pararenal space
degree of extrapancreatic
spread
hypo-enhanced
area of pancreas
*
left anterior
pararenal space
anterior
pararenal
space
base of the
mesocolon
lower pole of
the kidney
*
localized in a segment of,
or around, the pancreas
involving 2 segments
*
occupying 2 entire
segments or wider
Grade 1
Grade 2
Severe when CT Grade >2
Grade 3
Figure 2: Severe acute pancreatitis (CT Grade 2)
While the entire pancreatic parenchyma is enlarged, no clear hypo-enhanced area is noted. Fat necrosis (*) is
observed in the transverse mesocolon and anterior pararenal space and extends beyond the lower pole of the
kidney. A diagnosis of severe acute pancreatitis of CT Grade 2 can be made.
Index words and secondary materials used as references
A search of PubMed was performed using “acute pancreatitis”, “CT”, and “computed tomography” as key words.
Committee for Revision and Publication of the Guidelines for the Management of Acute Pancreatitis: JPN guidelines
2010 ed: Guidelines for the Management of Acute Pancreatitis: JPN guidelines 2010, third edition, 2010 was also used
as a reference.
References
1) Balthazar EJ et al: Acute pancreatitis: value of CT in establishing prognosis. Radiology 174: 331-336, 1990 (Level 2)
2) Balthazar EJ: Acute pancreatitis: assessment of severity with clinical and CT evaluation. Radiology 223: 603-613, 2002 (Level 5)
3) Bharwani N et al: Acute pancreatitis: the role of imaging in diagnosis and management. Clin Radiol 66: 164-175, 2011 (Level 5)
4) O’Connor OJ et al: Imaging of acute pancreatitis. AJR 197: W221-225, 2011 (Level 5)
61
The Japanese imaging guideline 2013
5. Gastrointestinal tract
hypo-enhanced
area of pancreas
degree of extrapancreatic
spread
hypo-enhanced
area of pancreas
anterior
pararenal
space
base of the
mesocolon
lower pole of
the kidney
localized in a segment of,
or around, the pancreas
*
involving 2 segments
occupying 2 entire
segments or wider
Grade 1
Grade 2
Severe when CT Grade >2
Grade 3
Figure 3: Severe acute pancreatitis (CT Grade 3)
The entire pancreatic parenchyma is enlarged, and hypo-enhanced areas are observed in the body and tail of
the pancreas. Fat necrosis (*) extends beyond the lower pole of the kidney, and a diagnosis of severe acute
pancreatitis of CT Grade 3 can be made.
Figure 4: Infectious pancreatic necrosis
The head of the pancreas is enlarged, and hypo-enhanced areas are observed in the body. Gas ( → ) is
noted in the area of necrosis, and infectious pancreatic necrosis was demonstrated by FNA.
5) O’Connor OJ et al: Imaging of the complications of acute pancreatitis. AJR 197: W375-381, 2011 (Level 5)
6) Heller SJ et al: Pleural effusion as a predictor of severity in acute pancreatitis. Pancreas 15: 222-225, 1997 (Level 3)
7) Mortele KJ et al: A modified CT severity index for evaluating acute pancreatitis: improved correlation with patient outcome. AJR 183: 12611265, 2004 (Level 3)
8) Mujica VR et al: Acute pancreatitis secondary to pancreatic carcinoma. Study Group Participants. Pancreas 21: 329-332, 2000 (Level 2)
62
The Japanese imaging guideline 2013
CQ 087
87
Is CT appropriate for the diagnosis of chronic
pancreatitis?
Recommendation
grade
B
CT is useful and is recommended. However, close examination by modalities such as
EUS is necessary for the diagnosis of early chronic pancreatitis.
Background/objective
In Japan, the Clinical Diagnostic Criteria for Chronic Pancreatitis have been used for the diagnosis of chronic
pancreatitis. The criteria were revised in 2009, incorporating the concept of early chronic pancreatitis. The usefulness of
CT for the diagnosis of chronic pancreatitis is evaluated in consideration of the revised diagnostic criteria.
Comments
Chronic pancreatitis is defined as “a pathological condition in which chronic changes such as irregular fibrosis, cell
infiltration, parenchymal loss, and granulation occur in the interior of the pancreas and cause pancreatic exocrine and
endocrine dysfunctions.” The disease is often irreversible and is classified into alcoholic and non-alcoholic depending
on the etiology. Autoimmune and obstructive pancreatitis, which are reversible, are presently handled separately as
chronic inflammation of the pancreas.
According to international reports on the diagnosis of chronic pancreatitis, the sensitivity and specificity of CT for
the diagnosis of chronic pancreatitis are 74-91 and 78-98%, respectively.1-3) The sensitivity and specificity for diffuse
calcification of the pancreas have been reported to be 53 and 94%, and those for pancreatic calculus to be 43 and 88%,
respectively.4) Because of the high specificity, CT is considered useful for the diagnosis (Figure).
The pathological concept of early chronic pancreatitis was incorporated in the diagnostic criteria during the last
revision on the basis of the Rosemont classification, international endoscopic ultrasound (EUS)-based criteria for the
diagnosis of chronic pancreatitis. According to these criteria, patients who cannot be diagnosed with definite or probable
chronic pancreatitis are diagnosed to have suspected chronic pancreatitis when two or more of 4 clinical findings are
fulfilled: “Recurrent attacks of upper abdominal pain”, “abnormal blood or urinary pancreatic enzyme levels”, “pancreatic
exocrine insufficiency”, and “sustained drinking of 80 g/day or more as pure ethanol”. For such patients with suspected
chronic pancreatitis, early (within 3 months) further examination by EUS or ERCP is recommended, and a diagnosis of
early chronic pancreatitis is made when imaging findings shown in the table are obtained. The Rosemont classification
is based on EUS findings, and CT findings are not included in the diagnostic criteria for early chronic pancreatitis in this
revision. In foreign countries CT has been reported to be less sensitive5,6) and to have limited diagnostic ability7,8) for
early chronic pancreatitis compared with EUS or ERCP. By the Clinical Diagnostic Criteria for Chronic Pancreatitis 2009,
EUS is performed first for the imaging diagnosis of early chronic pancreatitis in consideration of incidental diseases, and
ERCP is performed when necessary for symptomatic patients strongly suspected to have pancreatic lesions. Therefore,
close examination by modalities such as EUS is useful for the imaging diagnosis of early chronic pancreatitis. While
the new diagnostic criteria are epoch-making in that they opened the way to the early diagnosis/early treatment by the
introduction of the concept of early chronic pancreatitis, the diagnostic criteria for early chronic pancreatitis are not
based on sufficient data, and the diagnostic value and validity of CT also need further evaluation through accumulation
of cases.
Index words and secondary materials used as references
A search of PubMed was performed using “chronic pancreatitis”, “pancreatic calcification”, “diagnosis”, “stage”,
“sensitivity”, and “specificity” as key words. The Research Committee for the Intractable Pancreatic Diseases supported
by the Ministry of Health, Labour and Welfare of Japan, et al eds: Japanese clinical diagnostic criteria for chronic
pancreatitis 2009 and Catalano MF et al: EUS-based criteria for the diagnosis of chronic pancreatitis: the Rosemont
classification (Gastrointest Endosc 69: 1251-1261, 2009) were also used as references.
63
The Japanese imaging guideline 2013
5. Gastrointestinal tract
A
B
Figure: Chronic pancreatitis
A Non-contrast CT (axial view): The pancreatic parenchyma is atrophied, and the main
pancreatic duct is dilated ( → ). Calcification foci are scattered over the pancreatic parenchyma
(small → ). B Contrast-enhanced CT (arterial phase, oblique image): A pancreatic calculus is
observed in the main pancreatic duct ( → ).
Table: Imaging findings of early chronic pancreatitis (cited from the Japanese clinical
diagnostic criteria for chronic pancreatitis 2009)
Either a or b is observed.
a. Of the 7 EUS findings shown below, 2 or more including at least one of (1)-(4) are noted.
(1) Lobularity, honeycombing type
(2) Nonhoneycombing lobularity
(3) Hyperechoic foci (non-shadowing)
(4) Stranding
(5) Cysts
(6) Dilated side branches
(7) Hyperechoic MPD margin
b. Irregular dilatation of 3 or more side branches on ERCP.
References
1) Buscail L et al: Endoscopic ultrasonography in chronic pancreatitis: a comparative prospective study with conventional ultrasonography, computed tomography, and ERCP. Pancreas 10: 251-257, 1995 (Level 3)
2) Bozkurt T et al: Comparison of pancreatic morphology and exocrine functional impairment in patients with chronic pancreatitis. Gut 35: 11321136, 1994 (Level 3)
3) Rosch T et al: Modern imaging methods versus clinical assessment in the evaluation of hospital in-patients with suspected pancreatic disease.
Am J Gastroenterol 95: 2261-2270, 2000 (Level 3)
4) Campisi A et al: Are pancreatic calcifications specific for the diagnosis of chronic pancreatitis? A multidetector-row CT analysis. Clin Radiol 64:
903-911, 2009 (Level 3)
5) Remer EM et al: Imaging of chronic pancreatitis. Radiol Clin North Am 40: 1229-1242, 2002 (Level 5)
6) Chong AK et al: Diagnostic performance of EUS for chronic pancreatitis: a comparison with histopathology. Gastrointest Endosc 65: 808-814,
2007 (Level 3)
7) Buchler MW et al: A proposal for a new clinical classification of chronic pancreatitis. BMC Gastroenterol 9: 93, 2009 (Level 5)
8) Aoun E et al: Rapid evolution from the first episode of acute pancreatitis to chronic pancreatitis in human subjects. JOP 8: 573-578, 2007
(Level 4)
64
The Japanese imaging guideline 2013
CQ 088
88
Is CT appropriate for the diagnosis and severity
assessment of pancreatic fistula?
Recommendation
grade
C1
While the evidence is deficient, CT is used widely for the severity assessment of
pancreatic fistula and should be considered.
(There is no relevant literature concerning the diagnosis.)
Background/objective
Pancreatic fistula is a pathologic condition in which pancreatic juices leak out of the pancreatic duct. The degrees of
contribution of CT to the diagnosis and severity assessment were evaluated.
Comments
Pancreatic fistula occurs primarily as a postoperative complication or is caused by chronic pancreatitis, acute
pancreatitis, or pancreatic injury. Pancreatic fistulae are classified into external and internal fistulae (extra- and
intracorporeal leakage of pancreatic juices, respectively).
Since pancreatic fistulae frequently develop as a postoperative complication, the usefulness of CT primarily for the
evaluation of postoperative pancreatic fistulae is discussed in this article.
There used to be no standard diagnostic criteria for pancreatic fistulae, but the International Study Group on Pancreatic
Fistula (ISGPF) first showed clinical diagnostic criteria in 2005.1)
According to these criteria, pancreatic fistula is defined as “a condition in which the amylase level in the drained fluid
is 3 or more times higher than the normal serum amylase level on the third postoperative day or thereafter.”
Fistulae in agreement with these diagnostic criteria are also classified into Grades A (no clinical symptom), B (there
are signs of infection, but the management by conservative treatment is possible), and C (serious pancreatic fistula
complicated by intraperitoneal hemorrhage or sepsis, and care in the ICU or re-operation is necessary).
Performing CT postoperatively for the evaluation of the presence or absence of pancreatic fistula is controversial.
Some perform routine postoperative CT examination, but others refute it, because the discrimination between
postoperative fluid retention and pancreatic fistula is impossible. Recently, there have been positive reports about the
usefulness of CT due to its contribution to the clinical diagnosis of pancreatic fistula.2,3) Hashimoto et al. maintained that
retention of fluid, particularly fluid containing air bubbles, at the site of pancreaticojejunal anastomosis or drainage from
the pancreatic bed demonstrated by CT after pancreaticoduodenectomy strongly suggests pancreatic fistula.2) Bruno
et al. reported that fluid retention after surgery is likely to suggest pancreatic fistula and that CT occasionally suggests
clinically unclear pancreatic fistula.3)
There was no mention as to whether or not CT is useful for the severity assessment of pancreatic fistula in the papers
found by our search.
Index words and secondary materials used as references
A search of PubMed was performed using “pancreas”, “fistula”, and “CT” as key words.
References
1) Bassi C et al: Postoperative pancreatic fistula: an international study group (ISGPF) definition. Surgery 138: 8-13, 2005 (Level 5)
2) Hashimoto M et al: CT features of pancreatic fistula after pancreaticoduodenectomy. AJR 188: 323-327, 2007 (Level 4)
3) Bruno O et al: Utility of CT in the diagnosis of pancreatic fistula after pancreaticoduodenectomy in patients with soft pancreas. AJR 193: 175180, 2009 (Level 3)
65
The Japanese imaging guideline 2013
5. Gastrointestinal tract
89
What are imaging modalities appropriate for the
detection of pancreatic cancer?
Recommendation
grade
B
Dynamic CT is recommended. The evaluation should be made by dynamic CT, using
pancreatic-parenchymal and portal-venous phase images at a slice thickness of 2-3
mm. If only secondary signs are observed, the addition of delayed phase imaging,
dynamic imaging using MRI or US, EUS, or PET is desirable.
Background/objective
Resection is the only curative treatment for pancreatic cancer. However, small pancreatic cancers are often
asymptomatic and are overlooked by imaging studies. Many lesions are unresectable at the diagnosis, and this is the
primary reason for the poor prognosis. Imaging modalities useful for the detection of pancreatic cancer in patients
suspected to have, or at a high risk for, the disease are evaluated.
Comments
Relatively non-invasive imaging modalities used for detecting pancreatic cancer include US, CT, and MRI dynamic
studies. While all these methods are generally satisfactory for the detection of cancers 20 mm or greater in diameter
showing extrapancreatic spread, CT is commonly regarded as the first choice, unless there are contraindications, because
of the consistency of the image quality and high objectivity of MDCT.1,2)
To find a hypoattenuating mass, which is the finding on contrast-enhanced CT most useful for detecting pancreatic
cancer, pancreatic-parenchymal and portal-venous phase imaging is recommended.3) Since image reading experiments
have shown that the concomitant use of the coronal view and curved MPR significantly improves the diagnostic
performance for pancreatic cancer, it is desirable to perform MDCT at a detector thickness of 1.25 mm or less and
prepare 2-3 mm thick horizontal views and MPR images for the evaluation.4,5)
Pancreatic-parenchymal phase imaging, in which the pancreas shows maximum enhancement, is important to obtain
satisfactory contrast between cancer and pancreatic parenchyma. While satisfactory pancreatic-parenchymal phase
images can be usually obtained by injecting a contrast agent at 300 mgI/mL at a volume of 1.5-2 mL/kg of body weight
over 30 seconds and scanning about 40 seconds after the beginning of the administration of the contrast agent,6) bolus
tracking is frequently employed to cope with individual variation in hemodynamics. At image reading, it is important to
check whether the images are adequate pancreatic-parenchymal phase images, the marks of which are enhancement of
the aorta slightly after the peak and strong enhancement of the splenic-portal veins.6)
Regarding overlooking of pancreatic cancer by CT, images suggestive of cancer were reportedly obtained 6-18 months
before it was diagnosed in more than 50% of the patients,7) and the detection rate of pancreatic cancer 20 mm or less
in diameter by dynamic CT was 77% (14/18).8) By dynamic studies using MDCT, 5.4% (35/644) of cancers9) and 27%
(16/59) of those 20 mm or less in diamter10) were reported to be isoattenuating with the surrounding parenchyma,
making diagnosis impossible. Histological characteristics of such cancers are considered to be a diameter of 20 mm or
less, high degree of differentiation, and persistence of acinar tissue and islet cells in the tissue.9-11) Staining in the delayed
phase is useful for their detection,11) and attention to findings such as interruption of the main pancreatic duct, dilatation
of the pancreatic or bile duct or atrophy of the parenchyma in the upstream of the mass, and changes in the morphology
at the mass is necessary. It has been reported that 79.2% (19/24) and 73.7% (14/19) of isoattenuating tumors were
detected by MR and PET/CT, respectively (Figure).9)
The abilities of MRI and US dynamic studies to detect pancreatic cancer are reported to be comparable to, or higher
than, that of CT,12,13) and that EUS, which is more invasive, is reported to have higher detecting ability than MDCT,14)
but there is no study that strictly compared their abilities to detect resectable cancers 20 mm or less in diameter with that
of MDCT, and further evaluation is needed with this respect. However, as US and MRI are more sensitive than CT due
to the difference in contrast enhancement, they should be performed when only secondary signs have been detected by
CT. The sensitivity and specificity of PET/CT for the detection of pancreatic cancer have been reported to be 89% (41/46)
and 69% (9/13), respectively,15) and, despite problems with the detection of small cancers and uptake by inflammatory
masses, it is worth attempting in patients showing equivocal CT images.
Index words and secondary materials used as references
A search of PubMed was performed using “pancreatic adenocarcinoma”, “computed tomography”, “magnetic
resonance imaging”, “ultrasonography”, and “positron emission tomography” as key words.
66
The Japanese imaging guideline 2013
CQ 089
A
B
Figure: Dynamic CT of pancreatic cancer
In the pancreatic parenchymal phase (A), the entire area is evenly enhanced, and the
hypoattenuating mass is unclear. In the delayed phase (B), a mass that shows more
intense enhancement than the pancreatic parenchyma ( → ) is clearly observed.
References
1) Schima W et al: Pancreatic adenocarcinoma. Eur Radiol 17: 638-649, 2007 (Level 5)
2) Sahani DV et al: Radiology of pancreatic adenocarcinoma: current status of imaging. J Gastrointest Hepatol 23: 23-33, 2008 (Level 5)
3) McNulty NJ et al: Multi-detector row helical CT of the pancreas: effect of contrast-enhanced multiphasic imaging on enhancement of the pancreas, peripancreatic vasculature, and pancreatic adenocarcinoma. Radiology 220: 97-102, 2001 (Level 4)
4) Erturk SM et al: Pancreatic adenocarcinoma: MDCT versus MRI in the detection and assessment of locoregional extension. J Comput Assist
Tomogr 30: 583-590, 2006 (Level 2)
5) Fukushima H et al: Diagnostic value for curved multiplanar reformatted images in multislice CT for the detection of resectable pancreatic ductal
adenocarcinoma. Eur Radiol 16: 1709-1718, 2006 (Level 2)
6) Goshima S et al: Pancreas: optimal scan delay for contrast-enhanced multi-detector row CT. Radiology 241: 167-174, 2006 (Level 3)
7) Gangi S et al: Time interval between abnormalities seen on CT and the clinical diagnosis of pancreatic cancer: retrospective review of CT
scans obtained before diagnosis. AJR 182: 897-903, 2004 (Level 3)
8) Bronstein YL et al: Detection of small pancreatic tumors with multiphasic helical CT. AJR 182: 619-623, 2004 (Level 3)
9) Kim JH et al: Visually isoattenuating pancreatic adenocarcinoma at dynamic-CT: frequency, clinical and pathologic characteristics, and diagnosis at imaging examinations. Radiology 257: 87-96, 2010 (Level 2)
10) Yoon SH et al: Small (<20mm) pancreatic adenocarcinoma: analysis of enhancement patterns and secondary signs with multiphasic multidetector CT. Radiology 259: 442-452, 2011 (Level 2)
11) Ishigami K et al: Diagnostic value of the delayed phase image for iso-attenuating pancreatic carcinoma in the pancreatic parenchymal phase
on multidetector computed tomography. Eur J Radiol 69: 139-146, 2009 (Level 3)
12) Park HS et al: Preoperative evaluation of pancreatic cancer: comparison of Gadolinium-enhanced dynamic MRI with MR cholangiopancreatigrahy versus MDCT. J Magn Reson Imaging 30: 586-595, 2009 (Level 3)
13) Kitano M et al: dynamic imaging of pancreatic diseases by contrast enhanced coded phase inversion harmonic ultrasonography. Gut 53: 854859, 2004 (Level 4)
14) Dewitt J et al: Comparison of endoscopic ultrasonography and multidetector computed tomography for detecting and staging pancreatic cancer. Ann Intern Med 141: 753-763, 2004 (Level 3)
15) Heinrich S et al: Positron emission tomography/computed tomography influences on the management of resectable pancreatic cancer and its
cost-effectiveness. Ann Surg 242: 235-243, 2005 (Level 2)
67
The Japanese imaging guideline 2013
5. Gastrointestinal tract
90
Which imaging modalities are appropriate for the
evaluation of the degree of spread (staging) of
pancreatic cancer?
Recommendation
grade
B
Dynamic CT is recommended. The evaluation should be performed by dynamic
CT, and if a diagnosis of clearly unresectable pancreatic cancer is made, no
further imaging study is necessary. If the lesion is judged by CT to be resectable or
borderline resectable, it is desirable also to perform MRI and PET/CT with some other
imaging techniques, if necessary, and to comprehensively stage the lesion.
Background/objective
For pancreatic cancer, surgery is the only curative treatment. The assessment of the local spread, lymph node
metastasis, and distant metastasis by imaging modalities is very important in evaluating the need for surgery. The
usefulness of CT, MRI, and PET/CT for the staging of pancreatic cancer was evaluated.
Comments
For the T staging (General Rules for the Study of Pancreatic Cancer), the size of the tumor and invasion to the
intrapancreatic bile duct, duodenum, peripancreatic tissue, extrapancreatic nerve plexus, neighboring major vessels,
and other organs must be evaluated. The assessment of invasion to posterior tissues, extrapancreatic nerve plexus,
and blood vessels, which affects the therapeutic strategy and prognosis, is of particular importance. Regarding the
diagnostic performance of dynamic CT, Mazzeo et al. 1) reported that retroperitoneal fat tissue invasion could be
diagnosed with a sensitivity of 80%, specificity of 84%, and accuracy of 82%, and, according to Mochizuki et al.,
those for extrapancreatic nerve plexus invasion were 100, 83, and 95%, respectively.2) Also, Lu et al.3) reported that the
diagnostic sensitivity, specificity, and accuracy for vascular invasion, which was defined as contact with tumor over half
the circumference or more of the vessel, were 84, 98, and 94%, respectively, suggesting high precision of CT for local
staging of the disease. There is also a report that the diagnostic performance for local spread or vascular invasion was
improved by the addition of MPR.4) Concerning MRI, peripancreatic tissue or vascular invasion was reported to have
been diagnosed by 3D GRE dynamic MRI similarly to CT.5,6)
Concerning N staging, small regional lymph nodes may be metastatic and conversely large ones may be reactively
enlarged. Roche et al.7) compared CT images and resected specimens of regional lymph nodes in resectable pancreatic
cancer patients and reported that the sensitivity, specificity, and accuracy of the diagnosis of lymph node metastasis
were 14, 85, and 73%, respectively, when lymph nodes with a short diameter of 10 mm or greater were assumed to be
metastatic, indicating the low sensitivity of CT. Kauhanen et al.8) also reported the sensitivities of CT, MRI, and PET/
CT for lymph node metastasis to be 30, 9, and 30%, respectively, with all these modalities being unsatisfactory in
sensitivity.
As for M staging, the assessment of liver metastasis and peritoneal dissemination is particularly important. Motosugi
et al.9) reported that the sensitivity for liver metastasis was 92-94% by Gd-EOB-DTPA contrast-enhanced MRI and 7476% by CT (P=0.030-0.044), so the concomitant use of CT with more sensitive MRI is recommended for detecting
liver metastasis. Regarding PET/CT, Kauhanen et al.8) reported its usefulness for the detection of distant metastasis
with sensitivities of CT, MRI, and PET/CT being 38, 38, and 88%, respectively. Heinrich et al.10) also reported that
unnecessary radical surgery could be avoided in 16% by performing PET in patients with pancreatic cancer judged to
be resectable by modalities such as CT. However, according to Frohlich et al.,11) the sensitivity of PET for metastatic
foci 1 cm or less in diameter was low at 43%, and Wakabayashi et al.12) also reported that the sensitivity of PET was
not superior to that of CT for liver metastasis (53% by PET vs. 74% by CT) or peritoneal dissemination (43 vs. 57%).
PET/CT is worth attempting for lesions difficult to assess by CT or MRI, but its necessity as a routine examination is
controversial from the viewpoints of cost-effectiveness and exposure.
In predicting the resectability of pancreatic cancer, the abilities of CT and MRI have been reported to be comparable
(Table). MRI may be used as a substitute for CT for local assessment, but as the thoracic to pelvic regions can be
scanned at one time by CT, and as the vascular anatomy necessary for surgery can be readily evaluated by CTA,
dynamic CT is considered to be the procedure to be performed first.
Index words and secondary materials used as references
A search of PubMed was performed using “pancreatic cancer”, “CT”, “MRI”, and “PET” as key words.
68
The Japanese imaging guideline 2013
CQ 090
Table: Resectability predicted by various modalities
Author/year of report
Modality Sensitivity (%) Specificity (%)
Accuracy (%)
Park HS et al5)
2009
Koelblimger C et al6)
2011
Lee JK et al
2010
13)
Positive
Negative
predictive
predictive
value (%)
value (%)
CT
83
64 〜 75
80 〜 82
90 〜 92
53 〜 56
MRI
83 〜 86
64
80 〜 82
90
53 〜 57
CT
87
63 〜 75
78 〜 83
81 〜 87
71 〜 75
MRI
93
50 〜 75
78 〜 87
78 〜 88
80 〜 86
CT
90
59 〜 65
80 〜 82
83 〜 85
71 〜 73
MRI
90
29 〜 41
71 〜 75
74 〜 78
56 〜 64
References
1) Mazzeo S et al: Multidetector CT in the evaluation of retroperitoneal fat tissue infiltration in ductal adenocarcinoma of the pancreatic head: correlation with histopathological findings. Abdom Imaging 35: 465-470, 2010 (Level 3)
2) Mochizuki K et al: MDCT findings of extrapancreatic nerve plexus invasion by pancreas head carcinoma: correlation with en bloc pathological
specimens and diagnostic accuracy. Eur Radiol 20: 1757-1767, 2010 (Level 2)
3) Lu DS et al: Local staging of pancreatic cancer: criteria for unresectability of major vessels as revealed by pancreatic-phase, thin-section helical CT. AJR 168: 1439-1443, 1997 (Level 2)
4) Brügel M et al: Assessment of vascular invasion in pancreatic head cancer with multislice spiral CT: value of multiplanar reconstructions. Eur
Radiol 14: 1188-1195, 2004 (Level 2)
5) Park HS et al: Preoperative evaluation of pancreatic cancer: comparison of gadolinium-enhanced dynamic MRI with MR cholangiopancreatography versus MDCT. J Magn Reson Imaging 30: 586-595, 2009 (Level 3)
6) Koelblinger C et al: Gadobenate dimeglumine-enhanced 3.0-T MR imaging versus multiphasic 64-detector row CT: prospective evaluation in
patients suspected of having pancreatic cancer. Radiology 259: 757-766, 2011 (Level 2)
7) Roche CJ et al: CT and pathologic assessment of prospective nodal staging in patients with ductal adenocarcinoma of the head of the pancreas. AJR 180: 475-480, 2003 (Level 2)
8) Kauhanen SP et al: A prospective diagnostic accuracy study of 18F-fluorodeoxyglucose positron emission tomography/computed tomography,
multidetector row computed tomography, and magnetic resonance imaging in primary diagnosis and staging of pancreatic cancer. Ann Surg
250: 957-963, 2009 (Level 2)
9) Motosugi U et al: Detection of pancreatic carcinoma and liver metastases with gadoxetic acid-enhanced MR imaging: comparison with contrast-enhanced multi-detector row CT. Radiology 260: 446-453, 2011 (Level 2)
10) Heinrich S et al: Positron emission tomography/computed tomography influences on the management of resectable pancreatic cancer and its
cost-effectiveness. Ann Surg 242: 235-243, 2005 (Level 3)
11) Frohlich A et al: Detection of liver metastases from pancreatic cancer using FDG PET. J Nucl Med 40: 250-255, 1999 (Level 2)
12) Wakabayashi H et al: Role of 18F-fluorodeoxyglucose positron emission tomography imaging in surgery for pancreatic cancer. World J
Gastroenterol 14: 64-69, 2008 (Level 4)
13) Lee JK et al: Prediction of vascular involvement and resectability by multidetector-row CT versus MR imaging with MR angiography in patients
who underwent surgery for resection of pancreatic ductal adenocarcinoma. Eur J Radiol 73: 310-316, 2010 (Level 2)
69
The Japanese imaging guideline 2013
5. Gastrointestinal tract
91
Which are imaging modalities appropriate for the
detection of pancreatic endocrine tumors?
Recommendation
grade
B
Ultrasonography, endoscopic ultrasonography, dynamic CT, and dynamic MRI are
recommended.
Background/objective
Pancreatic endocrine tumors can be divided into functional and non-functional types. Non-functional tumors are often
detected after they have grown to a considerable size. Functional tumors are smaller in size and often multiple. CT is
performed first when endocrine tumor is suspected. MRI and ultrasonography is frequently used for the qualitative
diagnosis of lesions.
Comments
1) Ultrasonography
(1) Extracorporeal ultrasonography
Insulinoma is the most frequent functional endocrine tumor (accounting for about 60% of all endocrine tumors), and
it is mostly a solitary lesion. It is often small, and the preoperative detection rate was reported to be 60%.1) Recently,
its detection rate has been reported to have improved to about 80% due to the development of new technology. 2)
Gastrinoma is the second most frequent functional endocrine tumor (accounting for about 20% of all endocrine tumors)
and is likely to show multiple occurrences. It is larger than insulinoma and can often be detected easily. Non-functional
endocrine tumors account for about 30% of all endocrine tumors. They vary widely in size from 1-20 cm, and large ones
are relatively easy to detect.
(2) Endoscopic ultrasonography
In 2012, Fiebrich et al. reviewed the literature concerning pancreatic endocrine tumors published in 1995-2010
and evaluated their detectability by (1) examinations performed when hormonal abnormalities were present, (2)
those performed to closely examine the pancreas when endocrine carcinoma had been demonstrated at sites other
than the pancreas but as the primary lesion had not been identified, and (3) those performed for screening when
gene abnormalities (such as MEN type 1 and Von Hippel Lindau disease) had been suggested. They concluded that
endoscopic ultrasonography showed the highest detection performance in all 3 situations.3)
(3) Intraoperative ultrasonography
Small insulinomas that are isoechoic on extracorporeal ultrasonography are often difficult to detect preoperatively.
Intraoperative ultrasonography may be indicated when endocrine tumor is clinically suspected due to symptoms but
cannot be detected by extracorporeal ultrasonography, CT, or MRI. Intraoperative ultrasonography could reportedly
detect such lesions in 86-100% of the patients.4,5)
2) Dynamic CT
Some authors are skeptical about the role of dynamic CT for the preoperative search for endocrine tumors.6) By MDCT,
however, the detection of endocrine tumors has been facilitated by combining its high temporal and spatial resolutions
with an intravenous bolus injection of the contrast agent (Figure), and preoperative detection sensitivities surpassing
80% have been reported.7-11) Particularly, imaging in the late arterial phase (also called pancreatic-parenchymal phase)
performed about 40 seconds after the beginning of intravenous injection of the contrast agent has a high detection
ability.11)
3) MRI
Contrast-enhanced dynamic MRI, reportedly with a preoperative sensitivity exceeding 80%, has been suggested to be
an excellent modality.12,13) A manganese-based contrast agent, which cannot be used in Japan, has also been reported to
be useful for detecting small insulinomas of the pancreas.14)
Each of the above examinations is useful for the detection of pancreatic endocrine tumors. In clinical practice,
abdominal ultrasonography, dynamic CT, or dynamic MRI is recommended to be performed first when pancreatic
endocrine tumor is suspected, followed by endoscopic or intraoperative ultrasonography if more detailed evaluation is
considered necessary.
Index words and secondary materials used as references
A search of PubMed was performed using “pancreas, tumor, and ultrasound”, “pancreas, tumor, and CT”, and “pancreas,
70
The Japanese imaging guideline 2013
CQ 091
Figure: Insulinoma
Dynamic CT revealed an intensely enhancing
small mass in the body of the pancreas ( → ).
tumor, and MRI” as key words
References
1) Galiber AK et al: Localization of pancreatic insulinoma: comparison of pre- and intraoperative ultrasound with computer tomography and angiography. Radiology 166: 405-408, 1988 (Level 4)
2) Angeli E et al: Value of abdominal sonography and MR imaging at 0.5 T in preoperative detection of pancreatic insulinoma: a comparison with
dynamic CT and angiography. Abdom Imaging 22: 295-303, 1997 (Level 4)
3) Fiebrich HB et al: Tailored imaging of islet cell tumors of the pancreas amidst increasing options. Crit Rev Oncol Hematol 82: 213-226, 2012
(Level 3)
4) Hiramoto JS et al: Intraoperative ultrasound and preoperative localization detects all occult insulinomas. Arch Surg 136: 1020-1025; discussion
1025-1026, 2001 (Level 4)
5) Kuzin NM et al: Preoperative and intraoperative topographic diagnosis of insulinomas. World J Surg 22: 593-598, 1998 (Level 4)
6) Hashimoto LA et al: Preoperative localization of insulinomas is not necessary. J Am Coll Surg 189: 368-373, 1999 (Level 4)
7) King AD et al: Dual phase spiral CT in the detection of small insulinomas of the pancreas. BJR 71: 20-23, 1998 (Level 4)
8) Ichikawa T et al: Islet cell tumor of the pancreas: biphasic CT versus MR imaging in tumor detection. Radiology 216: 163-171, 2000 (Level 3)
9) Van Hoe L et al: Helical CT for the preoperative localization of islet cell tumors of the pancreas: value of arterial and parenchymal phase images. AJR 165: 1437-1439, 1995 (Level 4)
10) Horton KM et al: Multi-detector row CT of pancreatic islet cell tumors. Radiographics 26: 453-464, 2006 (Level 3)
11) Fidler JL et al: Preoperative detection of pancreatic insulinoma on multiphasic helical CT. AJR 181: 775-780, 2003 (Level 4)
12) Ichikawa T et al: Islet cell tumor of the pancreas: biphasic CT versus MR imaging in tumor detection. Radiology 216: 163-171, 2000 (Level 3)
13) Owen NJ et al: MRI of pancreatic neuroendocrine tumours. BJR 74: 968-973, 2001 (Level 4)
14) Hamoud AK et al: Mangan-enhanced MR imaging for the detection and localisation of small pancreatic insulinoma. Eur Radiol 14: 923-925,
2004 (Level 4)
71
The Japanese imaging guideline 2013
5. Gastrointestinal tract
92
Which of CT, MRI, and EUS is the most appropriate
imaging modality for the discrimination of cystic
pancreatic masses?
Recommendation
grade
B
CT and MRI are recommended. Their diagnostic abilities are nearly equal.
Background/objective
With recent improvements in the imaging diagnosis, the detection rate of asymptomatic cystic masses of the pancreas
has risen, and patients treated by surgery have increased.1) Guidelines for the management of small asymptomatic cystic
masses about 2-3 cm in diameter have not been established, and as many cystic tumors are mildly malignant, they
are often resected.2) This makes the role of imaging modalities important. Which modality is the most useful for the
discrimination of cystic masses of the pancreas was evaluated.
Comments
It is indisputable that CT and MRI are useful for the diagnosis of cystic masses of the pancreas.1) Many case reports
have suggested the usefulness of MRI for the diagnosis of cystic masses of the pancreas, emphasizing the advantages
of MRI such as high tissue contrast resolution, usefulness for the diagnosis of hemorrhage, and applicability of MRCP.
However, according to recent retrospective studies using a large number of patients, the diagnostic performance of
MRI has been reported more often not to differ significantly (Figure)3-5) than to be superior6) compared with CT. The
diagnostic ability of CT has been enhanced by the high spatial resolution and usefulness of reconstructed 3D images
of multislice CT. Although there have also been sporadic reports discussing the usefulness of diffusion-weighted MR
imaging and the apparent diffusion coefficient,7) restriction of diffusion of intracystic fluid should be regarded as a
relative finding as it can also occur due to various causes in non-tumoral lesions and serous cysts.8)
According to a relatively old report comparing the usefulness of CT, MRI, and EUS for the diagnosis of pancreatic
tumors in general,9) EUS was superior, particularly, for masses 3 cm or less in diameter. However, the image quality of
current CT or MRI is clearly improved, and this report cannot be endorsed at present. By our search, there has been only
1 report each making comparison between CT and EUS10) and between MRI and EUS11) concerning the differentiation
of cystic pancreatic masses, and no significant difference was observed in the diagnostic performance in either report.
Due to the lack of multiple reports, the evidence concerning the usefulness of EUS compared with CT or MRI must be
deemed to be absent. It is also unrealistic to attempt to diagnose cystic masses of the pancreas by EUS alone.
Index words and secondary materials used as references
A search of PubMed was performed using “pancreas”, “cystic mass”, “differential diagnosis”, “CT”, “MRI”, and “EUS”
as key words.
References
1) Brugge WR et al: Cystic neoplasms of the pancreas. N Engl J Med 351: 1218-1226, 2004 (Level 5)
2) Sahani DV et al: Pancreatic cysts 3 cm or smaller: how aggressive should treatment be? Radiology 283: 912-919, 2006 (Level 3)
3) Sahani DV et al: Intraductal papillary mucinous neoplasm of pancreas: multi?detector row CT with 2D curved reformations-correlation with
MRCP. Radiology 238: 560-569, 2006 (Level 2)
4) Visser BC et al: Characterization of cystic pancreatic masses: relative accuracy of CT and MRI. AJR 189: 648-656, 2007 (Level 3)
5) Sainani NI et al: Comparative performance of MDCT and MRI with MR cholangiopancreatography in characterizing small pancreatic cysts.
AJR 193: 722-731, 2009 (Level 3)
6) Song SJ et al: Differentiation of intraductal papillary mucinous neoplasms from other pancreatic cystic masses: comparison of multirow-detector CT and MR imaging using ROC analysis. J Magn Reson Imaging 26: 86-93, 2007 (Level 3)
7) Inan N et al: Diffusion-weighted imaging in the differential diagnosis of cystic lesions of the pancreas. AJR 191: 1115-1121, 2008 (Level 4)
8) Wang Y et al: Diffusion-weighted MR imaging of solid and cystic lesions of the pancreas. Radiographics 31: E47-E65, 2011 (Level 5)
9) Müller MF et al: Pancreatic tumors: evaluation with endoscopic US, CT, and MR imaging. Radiology 19: 745-751, 1994 (Level 3)
10) Gerke H et al: Endoscopic ultrasound and computer tomography are inaccurate methods of classifying cystic pancreatic lesions. Dig Liver Dis
38: 39-44, 2006 (Level 4)
11) Kim YC et al: Comparison of MRI and endoscopic ultrasound in the characterization of pancreatic cystic lesions. AJR 195: 947-952, 2010
(Level 3)
72
The Japanese imaging guideline 2013
CQ 092
A
B
Figure: Serous cystic neoplasm
A Early phase contrast-enhanced CT B T2-weighted MRI The lesion appears solid on CT but is clearly
diagnosed to be an aggregation of microcysts on T2-weighted imaging. With experience, however, the
lesion is sufficiently diagnosable also by CT.
73
The Japanese imaging guideline 2013
5. Gastrointestinal tract
93
Which is the imaging modality most appropriate
for the assessment of the degree of malignancy of
intraductal papillary mucinous neoplasm (IPMN)?
Recommendation
grade
B
CT and MRI are recommended. Their diagnostic abilities are nearly equal. EUS is
also useful when intramural nodules are suspected.
Background/objective
IPMN, which can be classified into the main duct and branch duct types, is a tumor that grows slowly, following the
adenoma-carcinoma sequence, and has been considered to have a better prognosis than common pancreatic cancer.
With accumulation of knowledge, however, its prognosis has been suggested to be worse than was initially reported.1)
The main duct type is frequently malignant and is invariably an indication of surgery, but the branch duct type is often
benign and may be observed in some patients.2) Therefore, the differentiation of benign and malignant diseases is of
clinical importance in branch duct IPMN. The diagnostic performance of each modality, particularly its precision in the
assessment of the degree of malignancy, was evaluated.
Comments
Pathologically, IPMN is often a mixed type, in which lesions are present in both the main pancreatic duct and its
branches, but it is basically a mucosal disease and is nearly impossible to accurately diagnose by imaging modalities.3)
Clinically, it is practical to classify the disease into the main duct and branch duct types depending on the relative
dominance in images. MRCP is generally considered useful for the evaluation of the overall picture of IPMN,3) but it is
not considered to be clearly superior to CT or EUS. Thus, there is no difference in the usefulness among the 3 modalities
for the differential diagnosis between the main duct and branch duct types.
The international consensus guidelines for the management of IPMN underwent a major revision in 2012.3) Notable
points of revision include the reduction of the criterion of dilatation of the main pancreatic duct to 5 mm to detect
main duct (MD) type IPMN with less missed diagnosis, classification of MD-IPMN with dilatation to 5-9 mm as a
“worrisome feature” and dilatation to 10 mm or more as “high-risk stigmata”, recommendation of 2-stage classification
also of branch duct (BD) IPMN into a “worrisome feature” and “high-risk stigmata”, and approval of observation even
when the diameter exceeds 3 cm, which was conventionally an indication for resection, if no “high-risk stigmata” are
observed. Thus, highly malignant MD-IPMN was regarded as a surgical indication, and the surgical indication of less
malignant BD-IPMN was reserved. According to the guidelines, dilatation of the main pancreatic duct and the cyst
diameter may be evaluated by either multislice CT or MRCP, but EUS is necessary for the evaluation of intramural
nodules.
While there have been a number of reports that MRI is useful for the diagnosis of IPMN including the differentiation
between benign and malignant diseases,4,5) CT has recently been reported to show high diagnostic performance by
the use of multislice CT and image reconstruction techniques such as curved-reformation, 1,6) and reports suggesting
an ability comparable to that of MRI have increased.7,8) Although there have been many reports emphasizing high
diagnostic performance of EUS,9,10) those comparing it with CT or MRI are extremely few. Clinically, IPMN is rarely
evaluated by EUS alone. According to a report in 1998,11) there was no difference in the abilities of CT, MRI, and EUS
to discriminate benign and malignant diseases. Recently, it has been reported that there is no difference in the diagnostic
ability between EUS and CT and that EUS may be unnecessary.12) However, the study population was small in these
reports, and the usefulness of EUS for the evaluation of small intramural nodules is readily understood in consideration
of its high spatial resolution. As the guidelines mention, EUS is still considered necessary for detailed evaluation
(Figure). It must be noted, however, that the findings on EUS depend on the examiner’s skill and are unsatisfactory in
objectivity.13)
Index words and secondary materials used as references
A search of PubMed was performed using “IPMN”, “CT”, “MRI”, and “EUS” as key words.
74
The Japanese imaging guideline 2013
CQ 093
Figure: EUS of branch duct type IPMN
An intramural nodule is clearly delineated in a
multilocular cyst ( → ). The lesion was difficult to
detect by CT or MRI. Pathologically, the disease
was non-invasive carcinoma.
References
1) Ogawa H et al: Intraductal papillary mucinous neoplasm of the pancreas: assessment of the likelihood of invasiveness with multisection CT.
Radiology 248: 876-886, 2008 (Level 2)
2) Irie H et al: Natural history of pancreatic intraductal papillary mucinous tumor of branch duct type: follow-up study by magnetic resonance cholangiopancreatography. J Comput Assist Tomogr 28: 117-122, 2004 (Level 3)
3) Tanaka M et al: International consensus guidelines for management of intraductal papillary mucinous neoplasms and mucinous cystic neoplasms of the pancreas. Pancreatology 6: 17-32, 2006 (Level 5)
4) Irie H et al: MR cholangiopancreatographic differentiation of benign and malignant intraductal mucin-producing tumors of the pancreas. AJR
174: 1403-1408, 2000 (Level 3)
5) Fukukura Y et al: Intraductal papillary mucinous tumors of the pancreas: comparison of helical CT and MR imaging. Acta Radiologica 44: 464471, 2003 (Level 3)
6) Takada A et al: Branch duct-type intraductal papillary mucinous tumor: diagnostic value of multiplanar reformatted images in multislice CT. Eur
Radiol 15: 1888-1897, 2005 (Level 3)
7) Sahani DV et al: Intraductal papillary mucinous neoplasm of pancreas: multi?detector row CT with 2D curved reformations-correlation with
MRCP. Radiology 238: 560-569, 2006 (Level 2)
8) Zhang HM et al: The differences in imaging features of malignant and benign branch duct type of Intraductal Papillary Mucinous Tumor. Eur J
Radiol 80: 744-748, 2011 (Level 3)
9) Yamao K et al: Endoscopic diagnosis and staging of mucinous cystic neoplasms and intraductal papillary-mucinous tumors. J Hepatobiliary
Pancreat Surg 10: 142-146, 2003 (Level 4)
10) Okabayashi T et al: Clinicopathological features and medical management of intraductal papillary mucinous neoplasms. J Gastroenterol
Hepatol 21: 462-467, 2006 (Level 4)
11) Cellier C et al: Intraductal papillary and mucinous tumors of the pancreas: accuracy of preoperative computed tomography, endoscopic retrograde pancreatography and endoscopic ultrasonography, and long-term outcome in a large surgical series. Gastrointest Endosc 47: 42-49,
1998 (Level 4)
12) Cone MM et al: Endoscopic ultrasound may be unnecessary in the preoperative evaluation of intraductal papillary mucinous neoplasm. HPB
(Oxford) 13: 112-116, 2011 (Level 4)
13) Petrone MC et al: Role of endoscopic ultrasound in the diagnosis of cystic tumours of the pancreas. Dig Liver Dis 40: 847-853, 2008 (Level 4)
75
The Japanese imaging guideline 2013
5. Gastrointestinal tract
94
Which imaging modalities are appropriate for
preoperative examination of esophageal cancer?
Recommendation
grade
B
CT and PET/CT are useful for staging of the disease and are recommended.
Esophagography is useful for the preoperative determination of the site and
assessment of the severity of stenosis and is recommended.
Background/objective
In the management of esophageal cancer, accurate preoperative staging is important for the selection of treatment.
The effectiveness of esophagography, CT, MRI, and PET/CT as a preoperative examination for esophageal cancer was
evaluated.
Comments
The visualization rate by esophagography decreases when the depth of invasion is slight.1,2) There is no report
comparatively evaluating the invasion depth of superficial cancers determined by esophagography and that determined
by endoscopy or endoscopic ultrasound (EUS). Regarding advanced esophageal cancer, the positive predictive value
and imaging sensitivity of esophagography performed for esophageal and cardiac cancer have been reported to be 42%
and higher than 90%, respectively.3) While there has been no report concerning the effectiveness of esophagography for
the diagnosis of advanced esophageal cancer, esophagography is superior to endoscopy in the determination of the site
and evaluation of the severity of stenosis, objectivity of findings, delineation of the tumor area even when the lesion
does now allow the passage of the endoscope. And it is more cost-effective (Figure). According to a report comparing
esophagography and CT, the delineation of esophageal cancer did not significantly differ between the two modalities,
but the accuracy of the diagnosis of the longitudinal extent of the lesion was higher by esophagography (59%) than by
CT (32%).4) Therefore, in advanced esophageal cancer, barium contrast radiography is very useful as it is superior to
other examinations in comprehensive evaluation of the lesion including its resectability and spatial relationship with the
adjacent organs.
CT is used as the first choice for the diagnosis of distant metastasis in preoperative examination of esophageal cancer.
CT particularly allows the evaluation of the liver, lungs, and bones, which are frequent sites of distant metastasis,
and is highly useful. Concerning the liver, the sensitivity of CT for liver metastases 1 cm or greater in diameter has
been reported to be about 90%.5) For lung metastases, also, CT has been reported to be very sensitive. However,
histopathological examination may be necessary in smokers, because there is the possibility of primary lung cancer.
As for the evaluation of the primary lesion (T staging), the ability of CT in the determination of the depth of invasion
is limited. Many esophageal cancers are visualized by CT as wall thickening, but the differential staging of T1-T3 is
impossible by CT alone. In the literature comparing CT and EUS, there have been some reports that the accuracy of T
staging by CT was inferior to that by EUS.6,7) Therefore, the most important role of CT in the diagnosis of the depth of
invasion is to discriminate T3 lesions, which can be radically resectable, and T4 lesions, which are not indications for
surgical treatment. The evaluation of the fat layer between the tumor and adjacent organs is of particular importance.
In fact, the sensitivity and specificity of CT for mediastinal invasion have been reported to be 88-100 and 85-100%,
respectively, suggesting that the modality is useful for diagnosing T4 lesions.8,9) Also, it has recently become possible to
perform MRP or prepare detailed 3D images due to the increased availability of MDCT, but there is no evidence of its
usefulness.
On the other hand, the assessment of lymph node metastasis by CT has a number of problems. Generally, lymph
nodes in the thoracic or abdominal cavity are considered to be enlarged when they are 10 mm or greater in diameter,
and supraclavicular lymph nodes to be enlarged when they are 5 mm or greater in short diameter.10,11) However, many
metastatic lymph nodes are normal in size, and this is a major factor for the poor accuracy of the staging of esophageal
cancers. According to early reports, the sensitivity and specificity of CT for lymph node metastasis with a criterion of 10
mm or greater were 30-60 and 60-80%, respectively,12,13) and nearly all metastatic lymph nodes 7 mm or less in diameter
were indistinguishable from normal nodes.8)
Concerning the ability of MRI and CT to stage advanced esophageal cancers, while there was a report that MRI
showed higher sensitivity, specificity, and accuracy in the evaluation of the depth of invasion and lymph node metastasis
than CT,14) more reports denied significant differences between the two modalities.15,16) Also, as MRI is more expensive,
has a narrower scanning area, and is more susceptible to artifacts due to respiration and cardiac pulsation than CT, it
cannot be recommended as a preoperative examination.
PET, by which the whole body can be searched for distant metastases at one time, is not utilized for staging (T staging)
76
The Japanese imaging guideline 2013
CQ 094
B
A
C
Figure: Preoperative images of thoracic esophageal cance
A Esophagogram: A circumferential type 2 lesion is observed in the midthoracic
esophagus. B Endoscopic view: A tumoral lesion occupying the entire esophageal
lumen is observed. The overall extent of the lesion is easier to evaluate by
esophagography. C PET/CT image: Uptake of FDG is noted at the site of a
metastatic mediastinal lymph node.
of the primary lesion, because it is difficult to evaluate the degree of tumor invasion by PET alone despite its high
sensitivity for the presence of disease compared with CT.12,17) It is also difficult to visualize early esophageal cancer by
PET, and no correlation between FDG uptake and degree of tumor invasion has been demonstrated.18,19)
PET is considered to be very useful for the diagnosis of lymph node metastasis as it permits functional assessment
regardless of the size (Figure). The sensitivity/specificity of PET for lymph node metastasis have been reported to be
65.5/100, 57/90, and 51/84%.20,21) In all these reports, the specificity was sufficiently high, and the modality, which
can reliably detect lymph node metastasis, if there is uptake, is considered to be a useful examination, while the
discrimination of false positives due to conditions such as chronic inflammation is still necessary.20) The low sensitivity
is related to the difficulty in the assessment of metastatic lymph nodes adjacent to the tumor. By PET/CT, the evaluation
based on both the uptake and size is possible, and the sensitivity may well be improved. When compared with CT
or EUS, PET has a significantly higher specificity,18) and the diagnostic specificity for lymph node metastasis can be
improved by the addition of PET to conventional examination by CT and EUS.
Concerning the diagnostic performance of PET for distant metastasis, the sensitivity and specificity were reported to be
69 and 95%, respectively, but its detection power is insufficient for lesions 6-7 mm or less in diameter, and MDCT has
higher spatial resolution. There is also a report that PET has no major significance in the evaluation of early esophageal
cancer and is not recommended.18) At any rate, the assessment of distant metastasis is insufficient by PET alone, and a
combination of contrast-enhanced CT and PET or PET/CT is necessary.
Index words and secondary materials used as references
A search of PubMed was performed using “esophageal cancer”, “esophagogram”, “CT”, “MRI”, “PET”, “diagnosis”,
and “staging” as key words. The Japan Radiological Society and Japan College of Radiology (JCR) Joint Guideline
Committee eds: Guidelines for Diagnostic Imaging of the Digestive Tract 2007 and Evidence-based Guideline
Recommendations on the Use of Positron Emission Tomography Imaging in Oesophageal Cancer (Clin Oncol 24: 86-104,
2012) were also used as references.
77
The Japanese imaging guideline 2013
5. Gastrointestinal tract
References
1) Sugimachi K et al: Clinicopathologic study of early stage esophageal carcinoma. Surgery 105: 706-710, 1989 (Level 4)
2) Chen YJ et al: Diagnosis and treatment of superficial oesophageal carcinoma. J Gastroenterol Hepatol 12: 778-784, 1997 (Level 4)
3) Levine MS et al: Carcinoma of the esophagus and esophagogastric junction: sensitivity of radiographic diagnosis. AJR 168: 1423-1426, 1997
(Level 4)
4) Drudi FM et al: Esophagogram and CT vs endoscopic and surgical specimens in the diagnosis of esophageal carcinoma. Radiol Med (Torino)
103: 344-352, 2002 (Level 4)
5) Kuszyk BS et al: Portal phase contrast-enhanced helical CT for the detection of malignant hepatic tumors: sensitivity based on comparison
with intraoperative and pathologic findings. AJR 166: 91-95, 1996 (Level 3)
6) Wakelin SJ et al: A comparison of computerized tomography, laparoscopic ultrasound and endoscopic ultrasound in the preoperative staging
of oesophago-gastric carcinoma. Eur J Radiol 41: 161-167, 2002 (Level 3)
7) Wallace MB et al: An analysis of multiple staging management strategies for carcinoma of the esophagus: computed tomography, endoscopic
ultrasound, positron emission tomography, and thoracoscopy/laparoscopy. Ann Thorac Surg 74: 1026-1032, 2002 (Level 2)
8) Picus D et al: Computed tomography in the staging of esophageal carcinoma. Radiology 146: 433-438, 1983 (Level 5)
9) Daffner RH et al: CT of the esophagus. II. Carcinoma. AJR 133: 1051-1055, 1979 (Level 5)
10) Dorfman RE et al: Upper abdominal lymph nodes: criteria for normal size determined with CT. Radiology 180: 319-322, 1991 (Level 4)
11) Fultz PJ, et al: Detection and diagnosis of nonpalpable supraclavicular lymph nodes in lung cancer at CT and US. Radiology 222: 245-251,
2002 (Level 4)
12) Block MI et al: Improvement in staging of esophageal cancer with the addition of positron emission tomography. Ann Thorac Surg 64: 770-777,
1997 (Level 3)
13) Kato H et al: Comparison between positron emission tomography and computed tomography in the use of the assessment of esophageal carcinoma. Cancer 94: 921-928, 2002 (Level 4)
14) Hamada H et al: Usefulness of magnetic resonance imaging in diagnosis of invasion to the adventitia and lymph node metastasis of esophageal carcinoma. Jpn J Gastroenterol Surg 24: 962-967, 1991 (Level 4)
15) Takashima S et al: Carcinoma of the esophagus: CT vs MR imaging in determining resectability. AJR 156: 297-302, 1991 (Level 3)
16) Wu LF et al: Preoperative TN staging of esophageal cancer: comparison of miniprobe ultrasonography, spiral CT and MRI. World J
Gastroenterol 9: 219-224, 2003 (Level 4)
17) Flanagan FL et al: Staging of esophageal cancer with fluorodeoxyglucose positron emission tomography. AJR 168: 417-424, 1997 (Level 3)
18) Flamen P et al: Utility of positron emission tomography for the staging of patients with potentially operable esophageal carcinoma. J Clin Oncol
18: 3202-3210, 2000 (Level 3)
19) Fukunaga T et al: Evaluation of esophageal cancers using 18F-fluorodeoxyglucose PET. J Nucl Med 39: 1002-1007, 1998 (Level 3)
20) van Westreenen HL et al: Systematic review of the staging performance of 18F-fluorodeoxyglucose positron emission tomography in esophageal cancer. J Clin Oncol 22: 3805-3812, 2004 (Level 1)
21) Kato H et al: The incremental effect of positron emission tomography on diagnostic accuracy in the initial staging of esophageal carcinoma.
Cancer 103: 148-156, 2005 (Level 3)
78
The Japanese imaging guideline 2013
CQ 095
95
Which imaging modalities are appropriate for the
postoperative follow-up of esophageal cancer?
Recommendation
grade
C1
While CT, PET, and esophagography are performed for postperative follow up, there
are no clear grounds for recommending any of these modalities.
Background/objective
Although the therapeutic results of esophageal cancer are improving, advanced cancer still frequently recurs. It is
important to detect local recurrence and metastases to lymph nodes and other organs as early as possible by scheduled
and careful postoperative surveillance. Which modalities are useful for postoperative surveillance was evaluated.
Comments
Since the prognosis of esophageal cancer has been reported to be more favorable in the asymptomatic than
symptomatic group at recurrence,1) early detection may improve the outcome.
There is a report that esophagography is effective for the diagnosis of local recurrence in the esophageal lumen.2) While
mucosal changes in anastomotic recurrence can be detected by esophagography, extramural recurrence and lymph node
enlargement cannot, limiting the usefulness of the modality. Endoscopic ultrasound is effective for diagnose them, but
postoperative changes such as fibrosis are difficult to differentiate from recurrence.
Some reports have recommended PET as useful for the diagnosis of recurrence,3-5) reporting its diagnostic accuracy to
be 87.2% (sensitivity: 93.1%, specificity: 75.7%).3) The literature on CT is scarce, but its accuracy has been reported to
be 84 and 87%, being comparable to that of PET.4,5) Regarding the diagnosis of local recurrence by PET, the sensitivity
is high, but the specificity is further reduced (50%) due to false positive findings. Also, PET has been reported to be
sensitive for bone metastases but less sensitive than CT for lung metastases, and CT has been suggested to be superior
depending on the recurrence pattern. The two modalities are expected to cover for each other’s weaknesses when
combined as PET/CT.
While there is no scientific report concerning the interval or duration of surveillance, follow-ups are generally
performed every 6 months over 5 years. Some patients in the high-risk group for recurrence are followed up every 3-4
months.1)
Index words and secondary materials used as references
A search of PubMed was performed using “esophageal cancer”, “surveillance”, “postoperative”, “CT”, “PET”, and
“esophagogram” as key words. The Japan Esophageal Society ed: Guidelines for Diagnosis and Treatment of Carcinoma
of the Esophagus, 2012 (3rd edition) was also used as a reference.
References
1) Matsubara H et al: Follow-up of patients after surgery of esophageal cancer from the viewpoint of recurrence treatment. J Clin Surg 57: 751775, 2002 (Level 4)
2) Revathy B et al: Diagnosis, Staging, and Follow-Up of Esophageal Cancer. AJR 181: 785-793, 2003 (Level 5)
3) Teyton P et al: Use of positron emission tomography in surgery follow-up of esophageal cancer. J Gastrointest Surg 13: 451-458, 2009 (Level
5)
4) Kato H et al: Value of positron emission tomography in the diagnosis of recurrent oesophageal carcinoma. Br J Surg 91: 1004-1009, 2004
(Level 3)
5) Carlisle JG et al: Recurrent esophageal carcinoma: CT evaluation after esophagectomy. Radiology 189: 271-275, 1993 (Level 3)
79
The Japanese imaging guideline 2013
5. Gastrointestinal tract
96
Which imaging modalities are appropriate as
preoperative examinations for gastric cancer?
Recommendation
grade
B
C1
B Upper GI tract radiography
B CT
C1 PET
Upper GI tract radiography is recommended for the evaluation of the depth and extent
of involvement. CT is recommended for the staging of gastric cancer. Compared with
CT, PET is less sensitive but more specific, and may be useful for the diagnosis of
lymph node metastasis.
Background/objective
The prevalence of gastric cancer is high world-wide, and the TNM classification is used for its preoperative staging.
Primarily, endoscopy is performed for preoperative examination for gastric cancer, but CT is also employed widely
(Figure). Imaging techniques involving radiologists are evaluated.
Comments
Upper GI tract radiography is widely recognized to be useful as a preoperative examination for gastric cancer, and
there have been many reports from Japan concerning the usefulness of close radiographic examination of the stomach
for the evaluation of the depth and extent of early gastric cancer.
CT (primarily contrast-enhanced CT) is performed as a routine preoperative examination for gastric cancer at many
facilities because it allows the evaluation of the presence or absence of distant metastases to organs including the liver
and lung and peritoneal dissemination as well as lymph node metastasis and comprehensive assessment of the presence
or absence of extraserosal spread (invasion to surrounding organs), which is difficult to diagnose by gastroscopy. Kim
and Chen et al. reported that MPR and 3D images prepared by MDCT improved the accuracy of preoperative T-staging
of gastric cancer.1,2) In a study to evaluate the depth of gastric cancer by CT performed after inflating the stomach with
water or air, Kumano et al. reported that the accuracy of the diagnosis of the depth was high at 91% with both water and
air.3) Other reports also suggested the usefulness of T-staging by CT.4) Recently, the assessment using virtual endoscopy
such as CT gastrography has been reported to be useful for the evaluation of the site and depth of the lesion. 5) The
accuracy of the diagnosis of lymph node metastasis by CT has also been reported at 51-83.8%.6,7) Kim et al. further
reported that MPR improved the accuracy of the diagnosis of lymph node metastasis in early gastric cancer.7) The site
of distant metastasis of gastric cancer is most frequently the liver, and the frequency of hematogenous metastases to
organs such as the lung, adrenal gland, bone, and brain is also high, but many reports suggested the usefulness of CT
for the diagnosis of metastases to all these sites.8) Also, the diagnosis of peritoneal dissemination is important to avoid
unnecessary open surgery.8) On CT, ascites is a vital finding suggesting peritoneal metastasis, and, according to Chang
et al., the probability of peritoneal dissemination is 75% or higher if 50 mL or more ascites is detected by CT.9) Yajima
et al. reported that the sensitivity and specificity of ascites demonstrated by CT were 51 and 97%, respectively, for the
diagnosis of peritoneal dissemination.10)
Many reports supported the usefulness of PET and PET/CT for the preoperative staging of gastric cancer.8,11) For the
diagnosis of lymph node metastasis, however, the sensitivity of PET alone is reportedly low.12) Kim et al. also reported
that PET/CT was superior to contrast-enhanced CT except for the sensitivity and accuracy in the diagnosis of lymph
node metastasis of advanced gastric cancer,13) so the addition of PET is recommended if lymph node metastasis is
suspected on CT.
Index words and secondary materials used as references
A search of PubMed was performed using “gastric cancer”, “preoperative”, and “staging” as key words.
80
The Japanese imaging guideline 2013
CQ
A
B
C
Figure: Preoperative images of advanced gastric cancer (type II)
D
A Endoscopy: A type II lesion primarily occupying the anterior wall from the
lower body to the antrum of the stomach is noted. B Contrast-enhanced CT:
An irregular mass shadow is observed in the anterior wall of the stomach with
obvious invasion to the serosal surface( → ). C Gastrography (compression
method): A mass shadow is observed in the lower body to the antrum of
the stomach. The mass shows ulceration in the center and a circumferential
ridge( → ). D PET/CT: FDG uptake is observed at the tumor.
References
1) Chen CY et al: Gastric cancer: preoperative local staging with 3D multi-detector row CT-correlation with surgical and histopathologic results.
Radiology 242: 472-482, 2007 (Level 2)
2) Kim JW et al: Diagnostic performance of 64-section CT using CT gastrography in preoperative T staging of gastric cancer according to 7th edition of AJCC cancer staging manual. Eur Radiol 22: 654-662, 2012 (Level 3)
3) Kumano S et al: T-staging of gastric cancer of air-filling multidetector-row CT: comparison with hydro-multidetector-row CT. Eur J Radiol 81:
2953-2960, 2012 (Level 2)
4) Kumano S et al: T staging of gastric cancer: role of multi-detector row CT. Radiology 237: 961-966, 2005 (Level 3)
5) Komori M et al: Contrast-enhanced MDCT gastrography for detection of early gastric cancer: initial assessment of “wall-carving image”, a
novel volume rendering technique. Eur J Radiol 81: 1695-1701, 2012 (Level 2)
6) Ba-Ssalamah A et al: Dedicated multidetector CT of the stomach: spectrum of diseases. Radiographics 23: 625-644, 2003 (Level 5)
7) Kim YN et al: Gastric cancer staging at isotropic MDCT including coronal and sagittal MPR images: endoscopically diagnosed early vs.
advanced gastric cancer. Abdom Imaging 34: 26-34, 2009 (Level 3)
8) Lee MH et al: Gastric cancer: imaging and staging with MDCT based on the 7th AJCC guidelines. Abdom Imaging 37: 531-540, 2012 (Level 5)
9) Chang DK et al: Clinical significance of CT-defined minimal ascites in patients with gastric cancer. World J Gastroenterol 11: 6587-6592, 2005
(Level 3)
10) Yajima K et al: Clinical and diagnostic significance of preoperative computed tomography findings of ascites in patients with advanced gastric
cancer. Am J Surg 192: 185-190, 2006 (Level 4)
11) Ozkan E et al: The role of 18F-FDG-PET/CT in the preoperative staging and posttherapy follow up of gastric cancer: comparison with spiral
CT. World J Surg Oncol 9: 75, 2011 (Level 4)
12) Ha TK et al: F18-fluorodeoxyglucose-positron emission tomography and computed tomography is not accurate in preoperative staging of gastric cancer. J Korean Surg Soc 81: 104-110, 2011 (Level 3)
13) Kim EY et al: The value of PET/CT for preoperative staging of advanced gastric cancer: comparison with contrast-enhanced CT. Eur J Radiol
79: 183-188, 2011 (Level 3)
81
The Japanese imaging guideline 2013
5. Gastrointestinal tract
97
Which imaging modalities are appropriate for
postoperative follow-up of advanced gastric cancer?
Recommendation
grade
B
C1
B PET (PET/CT)
C1 CT
PET and CT are useful and are recommended. However, the evidence is insufficient
as to whether patients after gastric cancer surgery should be followed-up periodically.
Background/objective
While the results of surgery for gastric cancer are improving, advanced gastric cancer has a high risk of recurrence and
is often followed-up over a long period of time after surgery. The number of examinations to evaluate for postoperative
recurrence is increasing, but there is no clear consensus about a reasonable follow-up method by imaging examinations.
The usefulness of CT and PET in patients after surgery for gastric cancer was evaluated.
Comments
Postoperative recurrence of gastric cancer is observed as local recurrence at the surgical site, peritoneal dissemination,
or distant metastasis including the liver. Therefore, patients are followed up generally by endoscopy for local evaluation
and CT or contrast-enhanced CT for both local recurrence and distant metastasis (Figure A).1) However, there have been
few reports evaluating the usefulness of CT after surgery for gastric cancer. Also, CT reportedly lacks the specificity for
small and localized foci of lymph node metastasis,1,2) and early peritoneal dissemination is often difficult to detect.
Recently, there have been a large number of reports about the usefulness of PET for the postoperative follow-up
of gastric cancer (Figure B).3-7) According to Shimada et al., while PET has limitations such as that it often shows
false negative results in signet ring cell carcinoma and non-solid-type poorly differentiated carcinoma, it is useful for
the evaluation of distant metastasis and therapeutic responses and contributes to the selection of more appropriate
treatments.8) Also, meta-analysis by Wu et al. (9 studies, a total of 526 patients who underwent PET) suggested the
usefulness of PET/CT with sensitivity and specificity of 0.72 and 0.84 by PET alone, 0.74 and 0.85 by contrastenhanced CT alone, and 0.75 and 0.85, respectively, by PET/CT.9) Therefore, PET or PET/CT will be recommended in
the future for patients suspected to have recurrence.
Concerning the period until recurrence, it has been reported that early gastric cancer recurred within 2 years in 50%
and within 3 years in 88.9% of the patients and that advanced gastric cancer recurred within 2 years in 79.2% and within
3 years in 90.7%.10) On the other hand, the frequency of recurrence 5 years or longer after surgery has been reported
to be 8.6%, and that of recurrence 10 years or more after surgery to be less than 1%, in all cases of recurrence. 11)
From these observations, the follow-up period after surgery for gastric cancer, which is usually 5 years, is considered
appropriate.
Lastly, whether or not periodic follow-up after surgery for gastric cancer is beneficial for patients or socially and
economically reasonable is a very important question. Kim et al. reported that the prognosis was poor in patients who
were symptomatic and had recurrence but that periodic postoperative follow-up did not contribute to the outcome.12)
Also, Eom et al. followed up 1,767 patients after surgery for gastric cancer by periodic examinations (for 3 years
by CT, hematological tests, and endoscopy) and reported that recurrence was observed in 310 patients (17.5%),
that abnormalities were observed on periodic examinations in 75.2% (233) of these patients, but that no significant
difference was noted in the overall survival between these patients and those in whom no abnormality was observed.13)
Further accumulation of cases and evaluation are considered necessary with regards to the usefulness of periodic
examinations and a socially and economically reasonable follow-up schedule. Particularly, for patients with early gastric
cancer and those considered to be at a low risk, the approach of avoiding unnecessary examinations and examining only
symptomatic patients may be worth evaluating.
Index words and secondary materials used as references
A search of PubMed was performed using “gastric cancer”, “recurrent”, and “postoperative” as key words. The
Japanese Gastric Cancer Association ed.: Japanese gastric cancer treatment guidelines 2010, National Comprehensive
Cancer Network 2009, Scottish Intercollegiate Guidelines Network 2006, and Gastric cancer: ESMO Clinical Practice
82
The Japanese imaging guideline 2013
CQ 097
A
B
Figure: Images of postoperative recurrence (peritoneal dissemination) of gastric
cancer
A Contrast-enhanced CT: Ascites is observed around the liver. Irregularity is noted on the
diaphragmatic surface. B PET/CT: Uptake of FDG is noted at the diaphragmatic surface, and
recurrence is evident.
Guidelines for diagnosis, treatment and follow-up 2010 were also used as references.
References
1) Kim KW et al: Postoperative anatomic and pathologic findings at CT following gastrectomy. Radiographics 22: 323-336, 2002 (Level 5)
2) Ha HK et al: Local recurrence after surgery for gastric carcinoma: CT findings. AJR 161: 975-977, 1993 (Level 4)
3) Nakamoto Y et al: Clinical value of whole-body FDG-PET for recurrent gastric cancer: a multicenter study. Jpn J Clin Oncol 39: 297-302, 2009
(Level 4)
4) Kim DW et al: Detecting the recurrence of gastric cancer after curative resection: comparison of FDG-PET/CT and contrast-enhanced abdominal CT. J Korean Med Sci 26: 875-880, 2011 (Level 4)
5) Ozkan E et al: The role of 18F-FDG-PET/CT in the preoperative staging and posttherapy follow up of gastric cancer: comparison with spiral
CT. World J Surg Oncol 9: 75, 2011 (Level 4)
6) Bilici A et al: The role of (1) F-FDG-PET/CT in the assessment of suspected recurrent gastric cancer after initial surgical resection: can the
results of FDG-PET/CT influence patients’ treatment decision making? Eur J Nucl Med Mol Imaging 38: 64-73, 2011 (Level 4)
7) Lee JE et al: The role of 18F-FDG-PET/CT in the evaluation of gastric cancer recurrence after curative gastrectomy. Yonsei Med J 52: 81-88,
2011 (Level 4)
8) Shimada H et al: Japanese Gastric Cancer Association Task Force for Research Promotion: clinical utility of (1) F-fluoro-2-deoxyglucose positron emission tomography in gastric cancer. A systematic review of the literature. Gastric Cancer 14: 13-21, 2011 (Level 1)
9) Wu LM et al: 18F-fluorodeoxyglucose positron emission tomography to evaluate recurrent gastric cancer: a systematic review and metaanalysis. J Gastroenterol Hepatol 27: 472-480, 2011 (Level 1)
10) Nashimoto A et al: Proper Follow-up Schedule after Curative Gastric Surgery. Jpn J Cancer and Chemother. 36: 1402-1407, 2009 (Level 5)
11) Ikeda Y et al: Effective follow-up for recurrence or a second primary cancer in patients with early gastric cancer. Br J Surg 92: 235-239, 2005
(Level 4)
12) Kim JH et al: Benefit of post-operative surveillance for recurrence after curative resection for gastric cancer. J Gastrointest Surg 14: 969-976,
2010 (Level 4)
13) Eom BW et al: Oncologic effectiveness of regular follow-up to detect recurrence after curative resection of gastric cancer. Ann Surg Oncol 18:
358-364, 2011 (Level 4)
83
The Japanese imaging guideline 2013
5. Gastrointestinal tract
98
Which imaging modalities are appropriate for
preoperative examination of colorectal cancers?
Recommendation
grade
B
C1
B CT, MRI (for rectal cancer alone)
C1 PET, barium enema, CT colonography
CT is recommended for the search for metastases. There is no clear evidence to
recommend PET.
MRI (and transrectal ultrasound) is recommended for the evaluation of local invasion
of rectal cancer.
Background/objective
Lower gastrointestinal (GI) endoscopy is generally performed for the diagnosis of colon cancer, but CT and MRI are
also performed (Figure), because the degree of extramural spread and invasion to other organs, lymph node metastasis,
and distant metastasis cannot be evaluated by lower GI endoscopy. The usefulness of imaging modalities (barium
enema, CT, MRI, and PET) for the diagnosis of colon cancer was evaluated.
Comments
For creating a therapeutic strategy and determining the prognosis of colon cancer, it is important to evaluate the
degree of invasion (T stage), lymph node metastasis (N stage), and metastasis (M stage). In many guidelines including
the NCCN Guidelines recommend the examination of the pelvic region, abdominal region including the liver, and
abdominal region by CT. This examination is recently performed frequently using MDCT, which permits imaging of
the whole body as thin slices with a thickness of 5 mm or less and visualization of small lymph nodes and metastatic
foci 5 mm in diameter. However, according to studies in which preoperative abdominal CT was performed as a routine
examination in patients with colorectal cancer the therapeutic strategy was changed in only 19% (13/70).1,2) Also, as lung
metastasis is observed infrequently at the initial examination, some authors are skeptical about the necessity of CT.3)
Regarding local evaluation of rectal cancer, local staging by CT or MRI is suggested except in cases where tumors
are clearly T1/2, N0.4) Particularly for the evaluation of mesorectal invasion, MRI is considered to be superior to CT.5)
According to a meta-analysis evaluating transrectal ultrasound, MRI using a transrectal coil, and CT,6) transrectal
ultrasound and transrectal coil MRI were superior to CT in the evaluation of invasion to the propria muscularis and are
comparable in sensitivity, but ultrasound was more specific than MRI (86 vs. 69%). In the evaluation of invasion to
pararectal tissues, ultrasound has been reported to be superior to CT or MRI (US: 90%, CT: 79%, MRI: 82%). In Japan,
however, transrectal ultrasound or transrectal coil MRI is rarely used for the staging of rectal cancer. Also, intrarectal
MRI has been removed from the NCCN Guidelines, 2012. In Japan, MRI is performed using a phased array coil instead
of a transrectal coil, but both procedures are generally considered to have nearly comparable diagnostic abilities and are
recommended as methods for the evaluation of local invasion. On the other hand, local evaluation by CT is considered
difficult, but the accuracy of the diagnosis of intramural invasion and invasion to other organs by MDCT is expected
to be improved by preparing high-resolution MRP images perpendicular to the plane in which the colon cancer is in
contact with the intestinal wall or other organs.7)
The sensitivity of imaging modalities for the evaluation of lymph node metastasis has been reported to be only 60%,8)
and the above meta-analysis also concluded that transrectal ultrasound, transrectal coil MRI, and CT are similar in
sensitivity for invasion to other organs and lymph node metastasis.6)
PET is considered to be useful for the evaluation of the presence or absence of local recurrence, lymph node metastasis,
and distant metastasis.9) It is more sensitive than CT to detect intraabdominal lymph node metastasis. PET has also
been reported to be superior in the evaluation of liver metastasis.10) (See CQ69 on liver metastasis). Also, contrastenhanced CT+PET has been shown to be more sensitive than PET or CT alone.11,12) However, PET is expensive, and the
accumulation of the evidence of its usefulness for the diagnosis of metastasis is still insufficient.
Barium enema has advantages such as the ease of evaluation of the entire picture of the lesion compared with
endoscopy, but endoscopy was reported to be superior in the diagnosis of colon cancer with submucosal invasion,13) and
opportunities to perform barium enema have decreased. Images resembling those of barium enema can be prepared by
CT colonography, but the clinical evaluation of the modality remains insufficient.
Index words and secondary materials used as references
A search of PubMed was performed using “colon cancer”, “rectal cancer”, “colorectal cancer”, “preoperative”, and
84
The Japanese imaging guideline 2013
CQ 098
A
B
C
Figure: Preoperative images of advanced rectal cancer
A Barium enema: A circumferential type II lesion is observed in the part of the rectum below the peritoneal reflection
( → ). B Endoscopy: Circumferential stenosis is noted, and the passage of the endoscope is difficult.
C MRI: Circumferential wall thickening is observed in the rectum ( → ). While the lesion clearly spreads beyond the
propria muscularis, no invasion to the prostate is observed.
“staging” as key words. The NCCN guidelines Colon Cancer Ver.2. 2012 and Schmiegel W et al: S3 guidelines for
colorectal carcinoma: results of an evidence-based consensus conference on February 6/7, 2004 and June 8/9, 2007 (for
the topics IV, VI and VII). Z Gstroentero 48: 65-136, 2010 were also used as references.
References
1) Barton JB et al: The utility of routine preoperative computed tomography scanning in the management of veterans with colon cancer. Am J
Surg 183: 499-503, 2002 (Level 4)
2) McAndrew MR, Saba AK: Efficacy of routine preoperative computed tomography scans in colon cancer. Am Surg 65: 205-208, 1999 (Level 4)
3) Grossmann I et al: Preoperative staging with chest CT in patients with colorectal carcinoma: not as a routine procedure. Ann Surg Oncol 17:
2045-2050, 2010 (Level 3)
4) Kwok H et al: Preoperative staging of rectal cancer. Int J Colorectal Dis 15: 9-20, 2000 (Level 2)
5) Mathur P et al: Comparison of CT and MRI in the pre-operative staging of rectal adenocarcinoma and prediction of circumferential resection
margin involvement by MRI. Colorectal Dis 5: 396-401, 2003 (Level 2)
6) Bipat S et al: Rectal cancer: local staging and assessment of lymph node involvement with endoluminal US, CT, and MR imaging-a metaanalysis. Radiology 232: 773-783, 2004 (Level 1)
7) Matsuoka H et al: A prospective comparison between multidetector-row computed tomography and magnetic resonance imaging in the preoperative evaluation of rectal carcinoma. Am J Surg 185: 556-559, 2003 (Level 4)
8) Church JM et al: Optimizing the outcome for patients with rectal cancer. Dis Colon Rectum 46: 389-402, 2003 (Level 5)
9) Flamen P et al: Additional value of whole-body positron emission tomography with fluorine-18-2-fluoro-2-deoxy-D-glucose in recurrent colorectal cancer. J Clin Oncol 17: 894-901, 1999 (Level 4)
10) Delbeke D et al: Staging recurrent metastatic colorectal carcinoma with PET. J Nucl Med 38: 1196-1201, 1997 (Level 4)
11) Cantwell CP et al: Liver lesion detection and characterization in patients with colorectal cancer: a comparison of low radiation dose nonenhanced PET/CT, contrast-enhanced PET/CT, and liver MRI. J Comput Assist Tomog 32: 738-744, 2008 (Level 4)
12) Dirisamer A et al: Performance of integrated FDG-PET/contrast-enhanced CT in the staging and restaging of colorectal cancer: comparison
with PET and enhanced CT. Eur J Radiol 73: 324-328, 2010 (Level 3)
13) Matsuda T et al: Can barium enema be omitted for the diagnosis of depth of invasion in early colon cancer? Endosc Dig 13: 81-88, 2001
(Level 5)
85
The Japanese imaging guideline 2013
5. Gastrointestinal tract
99
Which imaging modalities are appropriate for
postoperative follow-up of colorectal cancer?
Recommendation
grade
B
C1
本文中に文献 7 がありませんでしたので,入れて下さい。
B Contrast-enhanced CT
C1 MRI (rectal cancer), PET (PET/CT)
Contrast-enhanced CT is recommended. While the evidence is insufficient, MRI and
PET/CT are also useful in some patients and may be considered.
Background/objective
While the therapeutic results of cancer of the digestive tract are improving, the recurrence rate of advanced cancer
remains high. Local recurrence, lymph node metastasis, and metastasis to other organs may be detected early by
designed, careful postoperative surveillance. Which imaging modalities are useful for postoperative surveillance of
colorectal cancer was evaluated on the basis of the literature.
Comments
Regarding the method for postoperative surveillance of colon cancer, multiple randomized controlled trials (intensive
vs. non-intensive) and their meta-analysis have been carried out internationally, and the early detection of recurrence
was shown to be possible with an improvement in the prognosis in the intensive group.1) In Western countries, guidelines
have been issued successively since 2005, and the Guidelines for the Treatment of Colorectal Cancer prepared for the
standardization of the diagnosis and treatment of colorectal cancer were published in Japan, but the surveillance method
varies among the guidelines (Table).
According to a follow-up study of colorectal cancer patients after curative resection by the Japanese Society for
Cancer of the Colon and Rectum, recurrence occurred within 3 years after surgery in 80% or more, and within 5 years
after surgery in 95%, but more than 5 years after surgery in less than 1%, of all patients. Recurrence was observed
most frequently in the liver, followed by the lung, and locally in the colon. This suggests that surveillance should be
continued over 5 years after surgery at shorter intervals during the first 3 years.
The detection rate for resectable lung metastases on postoperative surveillance of colon cancer patients with plain
chest radiography is low at about 1%, and the modality is not recommended in Western countries for periodic followup. Moreover, as it is possible today to scan from the thoracic to pelvic region in one session by multislice CT, the
importance of plain chest radiography in surveillance has decreased.
According to the ASCO Guidelines, annual thoracoabdominal CT scans are recommended for 3 years after surgery in
groups at high-risk for recurrence. The guidelines also recommend that pelvic CT should be considered, particularly for
previously unirradiated patients after surgery for rectal cancer. There is a report that the discrimination between postsurgical scarring and recurrent lesions is difficult and that baseline pelvic CT images early after surgery are useful for
this purpose.9) Also, if intrapelvic recurrence is suspected, diffusion-weighted MRI, EUS, and PET/CT of the pelvic
region have been reported to be useful.3-6) The ESMO Clinical Practice Guidelines recommend thoracoabdominal CT
examination every 6-12 months over 3 years after surgery for the high-risk group. According to the guidelines, the
usefulness of other imaging modalities has not been demonstrated, and they should be applied only to patients in whom
recurrence is suggested by symptoms.
The usefulness of periodic colonoscopy has not been established due to the low incidence of anastomotic recurrence
after surgery for colon cancer.8) In rectal cancer, however, the local recurrence rate is higher than in colon cancer, and
there has been a report recommending colonoscopy for surveillance.9) Recently, the availability of CT-colonography
(CTC), which can be performed more easily than colonoscopy, is increasing. The sensitivity and specificity of CTC
for the diagnosis of local recurrence of colorectal cancer are reportedly 81.8 and 93.1%, respectively, 2) and contrastenhanced CTC is expected to be useful for future colorectal cancer surveillance.
See CQ69 for liver metastasis of colorectal cancer.
Index words and secondary materials used as references
A search of PubMed was performed using “colorectal cancer”, “surveillance”, “recurrent”, and “postoperative” as
key words. The ASCO Guidelines 2005, ESMO Clinical Practice Guidelines 2010, NCCN Guidelines 2012, and the
86
The Japanese imaging guideline 2013
CQ 099
Table: Postoperative surveillance methods for colorectal cancer recommended by the JSCCR Guidelines for the
Treatment of Colorectal Cancer and international guideline
JSCCR Guidelines
JSCCR Guidelines
(Stage I mp, Stage II)
(Stage III)
Medical interview
Every 3 months for
the first 2.5 years
and every 6 months
thereafter
ASCO
ESMO
Every 3 months for
the first 3 years
and every 6 months
thereafter
Every 3-6 months for
the first 3 years
and every 6 months
thereafter
When appropriate
Tumor marker
Every 3 months for
Every 3 months for
(CEA)
the first 2.5 years
the first 3 years
and every 6 months
and every 6 months
thereafter
thereafter
Every 3 months
(started after the end
of chemotherapy in
patients undergoing
5FU adjuvant
chemotherapy)
When there are
symptoms suggestive
of recurrence
Chest X-ray
Every 6 months for
Every 6 months
Chest X-ray is
the first 3 years and
not recommended
annually thereafter
When there are
symptoms suggestive
of recurrence
Chest CT
When necessary
Annually
Annually
Chest X-ray may
be omitted when
chest CT is performed)
When there are
symptoms suggestive
of recurrence
Abdominal US
After 6, 18, 30, 42,
No mention
and 54 months
Annually for 3 years
after surgery
After 6, 18, and 30
months
Abdominal CT
Annually
Annually
Annually
When there are
symptoms suggestive
of recurrence
Pelvic CT
After 1, 2, 3, and 5
(rectal cancer)
years
Considered for previously unirradiated
patients
Not recommended
to be performed
periodically
3 years after surgery
and every 5 years
thereafter#
Every 5 years
Every 6 months for
the first 2 years and
annually thereafter
Colonoscopy
1 and 3 years after
1, 2, and 3 years after
surgery*
surgery*
* For the evaluation of anastomotic recurrence, when necessary.
# Flexible sigmoidoscopy performed every 6 months in rectal cancer patients non-irradiated for 5 years.
Japanese Society for Cancer of the Colon and Rectum ed: JSCCR Guidelines for the Treatment of Colorectal Cancer 2009
were also used as references.
References
1) Hashiguchi Y et al: Surveillance after curative resection for colorectal cancer. J Jpn Surg Soc 108: 125-130, 2007 (Level 1)
2) Kim HJ et al: CT Colonography for combined colonic and extracolonic surveillance after curative resection of colorectal cancer. Radiology 257:
697-704, 2010 (Level 2)
3) Park MJ et al: Locally advanced rectal cancer: added value of diffusion-weighted MR imaging for predicting tumor clearance of the mesorectal
fascia after neoadjuvant chemotherapy and radiation therapy. Radiology 260: 771-780, 2011 (Level 4)
4) Ramirez JM et al: Endoluminal ultrasonography in the follow-up of patients with rectal cancer. Br J Surg 81: 692-694, 1994 (Level 4)
5) Löhnert MS et al: Effectiveness of endoluminal sonography in the identification of occult local rectal cancer recurrences. Dis Colon Rectum 43:
483-491, 2000 (Level 4)
6) Moore HG et al: A case-controlled study of 18-fluorodeoxyglucose positron emission tomography in the detection of pelvic recurrence in previously irradiated rectal cancer patients. J Am Coll Surg 197: 22-28, 2003 (Level 4)
7) Flanagan FL et al: Utility of FDG-PET for investigating unexplained plasma CEA elevation in patients with colorectal cancer. Ann Surg 227:
319-323, 1998 (Level 4)
8) Anthony T et al: Postoperative colorectal cancer surveillance. J Am Coll Surg 190: 737-749, 2000 (Level 1)
9) Desch CE et al: Recommended colorectal cancer surveillance guidelines by the American Society of Clinical Oncology. J Clin Oncol 17: 1312,
1999 (Level 5)
87
The Japanese imaging guideline 2013
5. Gastrointestinal tract
100
Is diagnostic imaging appropriate for reducing
negative appendectomy?
Recommendation
grade
A
There is a strong evidence that negative appendectomy can be reduced by diagnostic
imaging, particularly by CT, and it is strongly recommended.
Background/objective
Acute appendicitis lacks characteristic symptoms or findings early after the onset and often leads to perforation due to
a delay of diagnosis. Once the appendix is perforated, the frequency of complications such as intraperitoneal abscess,
subcutaneous abscess, and adhesive ileus increases. Therefore, unnecessary appendectomy, also called negative
appendectomy, tends to be performed due to fear of perforation. Its incidence was considered about 20% but has
markedly decreased recently to 5% or less presumably due largely to contribution of imaging techniques (Figure).
Comments
Concerning adults, a study of 3,540 cases of appendectomy (with a preoperative diagnosis of appendicitis) in
Washington State showed that negative appendectomy was seen in 9.8% of the patients without imaging examination
but in 8.1% with ultrasonography and 4.5% with CT.1) The results of other reports were similar.2-4) A healthcare costcutting effect has also been reported. However, on a population basis, the negative appendectomy rate reportedly
showed no change after the introduction of diagnostic imaging or laparoscopy.5)
In children, according to a retrospective study by Rao et al. of 129 cases, the negative appendectomy rate was 10%
in boys and 18% in girls but decreased after the introduction of CT to 5 and 12%, respectively, and the incidence of
appendiceal perforation also decreased from 22 to 14%.6) Garcia Peña et al. reported that the negative appendectomy
rate was 14.7% before the introduction of imaging examination but significantly decreased to 4.1% by a protocol of
performing prospective ultrasonography with CT in suspected cases alone.7) It has been reported from the same facility
that the rate decreased from 11 to 5.5% also when imaging examination was performed by limiting the indications using
a clinical practice guideline.8) However, factors other than imaging examination may have been involved in the results.
From various reports including those cited above, negative appendectomy appears to be clearly decreasing due to
diagnostic imaging. However, the diagnosis is still reported to be difficult even by CT in patients with sparse visceral fat,
those with ileus, and those in whom the appendix cannot be identified as it is complicated by perforation or abscess.9)
Index words and secondary materials used as references
A search of PubMed was performed using “appendicitis”, “CT”, “negative appendectomy”, “diagnosis”, and “effect”
as key words.
References
1) Cuschieri J et al: Negative appendectomy and imaging accuracy in the Washington State Surgical Care and Outcomes Assessment Program.
SCOAP Collaborative. Ann Surg 248: 557-563, 2008 (Level 4)
2) Lee CC et al: Routine versus selective abdominal computed tomography scan in the evaluation of right lower quadrant pain: a randomized
controlled trial. Acad Emerg Med 14: 117-122, 2007 (Level 2)
3) Morse BC et al: Abdominal CT scanning in reproductive-age women with right lower quadrant abdominal pain: does its use reduce negative
appendectomy rates and healthcare costs? Am Surg 73: 580-584, 2007 (Level 4)
4) Rao PM et al: Effect of computed tomography of the appendix on treatment of patients and use of hospital resources. N Engl J Med 338: 141146, 1998 (Level 4)
5) Flum DR et al: Has misdiagnosis of appendicitis decreased over time? A population-based analysis. JAMA 286: 1748-1753, 2001 (Level 4)
6) Rao PM et al: Introduction of appendiceal CT: impact on negative appendectomy and appendiceal perforation rates. Ann Surg 229: 344-349,
1999 (Level 4)
7) Garcia Peña BM et al: Effect of an imaging protocol on clinical outcomes among pediatric patients with appendicitis. Pediatrics 110: 6 10881093, 2002 (Level 3)
8) Smink DS et al: Diagnosis of acute appendicitis in children using a clinical practice guideline. J Pediatr Surg 39: 458-463, 2004 (Level 4)
9) Levine CD et al: Why we miss the diagnosis of appendicitis on abdominal CT: evaluation of imaging features of appendicitis incorrectly diagnosed on CT. AJR 184: 855-859, 2005 (Level 4)
88
The Japanese imaging guideline 2013
CQ 100
A
B
C
D
Figure: Acute appendicitis
A Plain CT B Contrast-enhanced CT C Coronal MPR D Sagittal MPR: An enlarged appendix
accompanied by wall enhancement and thickening ( → ) is observed in the right lower abdominal
region. The density of the surrounding adipose tissue is increased, and free fluid is noted,
suggesting abscess formation. Surgery was performed, and the diagnosis of acute appendicitis
was confirmed. Intraoperatively, pus was collected in the mesoappendix and mesocecum.
89
The Japanese imaging guideline 2013
5. Gastrointestinal tract
101
When is CT appropriate in patients suspected to have
acute appendicitis?
In adults, there are no clear data as to patients requiring diagnostic imaging. In
children, however, a group in which diagnostic imaging is unnecessary can be
selected on the basis of physical and blood test findings.
No relevant
If the possibility of acute appendicitis is moderate or high, CT is effective for the
grade
preoperative diagnosis, and its implementation may be considered.
Recommendation
grade
Background/objective
Appendicitis is first diagnosed from physical findings and laboratory data, but it is often missed or alternatively
unnecessarily treated by surgery due to misdiagnosis. When appendicitis is strongly suspected clinically, diagnostic
imaging is useful for decision making, but performing diagnostic imaging in all such patients is inappropriate from the
viewpoints of exposure and medical economy. What kind of patients should undergo imaging studies?
Comments
There are various diagnostic scoring systems for acute appendicitis due to the difficulty in its initial diagnosis. Among
them, the Alvarado score is the most commonly used,1) and there have been a number of reports that a score of 6 or
above strongly suggests appendicitis in children.
On the other hand, Kharbanda et al. reported an attempt to identify children who are unlikely to have appendicitis
and, thus, require no diagnostic imaging using clinical findings and laboratory results as triage tools.2) As a result, the
sensitivity and negative predictive value for acute appendicitis were 98 and 32%, respectively, if there is at least one of (1)
a neutrophil count of 6,750 or above, (2) nausea, and (3) tenderness most intense in the right lower abdominal region,
and the use of CT could be reduced to 20% by applying this rule. However, the diagnostic power of this method is low
and variable in adults. Presently, no method has been sufficiently shown to be useful for discriminating patients who
require diagnostic imaging.
In the retrospective study by Garcia Peña et al., patients were divided into 3 groups according to the risk level based
on symptoms and laboratory data, a management guideline was presented, and the outcome was evaluated.3) They
reported that, by following this guideline, the negative appendectomy (false positive) and false-negative rates could be
minimized. Nathan et al. reported that information obtained by CT is very limited when an emergency physician judged
the possibility of appendicitis to be low.4) Also, Blackmore et al. reported that false positives may increase if CT is
used when appendicitis is unlikely.5) These results suggest that CT should be used when the possibility of appendicitis
is high or moderate. Kondo et al. considered that CT may be omitted if half a day or longer has passed from the onset
to the initial examination and muscular guarding is observed, because appendicitis is highly likely. However, CT
shoud be performed in other cases.6) On the other hand, Nathan et al. state that CT should be performed in all patients
preoperatively.4)
Index words and secondary materials used as references
A search of PubMed was performed using “appendicitis” and “diagnosis” as key words.
References
1) Alvarado A: A practical score for the early diagnosis of acute appendicitis. Ann Emerg Med 15: 557-564, 1986 (Level 4)
2) Kharbanda AB et al: A clinical decision rule to identify children at low risk for appendicitis. Pediatrics 116: 709-716, 2005 (Level 4)
3) Garcia Peña BM et al: Selective imaging strategies for the diagnosis of appendicitis in children. Pediatrics 113: 24-28, 2004 (Level 4)
4) Nathan RO et al: Therapeutic impact of CT of the appendix in a community hospital emergency department. AJR 191: 1102-1106, 2008 (Level
4)
5) Blackmore CC et al: Optimizing the interpretation of CT for appendicitis: modeling health utilities for clinical practice. J Am Coll Radiol 3: 115121, 2006 (Level 5)
6) Kondo N et al: Selection of Nonessential Intravenous Contrast Enhanced-Computed Tomography for Diagnosing Acute Appendicitis. Jpn J of
Gastroenterol Surg 140: 8-14, 2007 (Level 4)
90
The Japanese imaging guideline 2013
CQ 102
102
Which imaging modality is appropriate for acute
appendicitis in adults?
Recommendation
grade
B
CT is recommended as there is an evidence that CT has higher sensitivity and
specificity than ultrasonography for adult acute appendicitis.
Background/objective
Acute appendicitis is the most frequent of the diseases that require emergency surgery, and about 7% of all people
reportedly suffer from the disease in their lifetime.1) Ultrasonography can be performed readily at the bedside and has
high diagnostic accuracy, but it is dependent on the examiner’s skill and affected by intestinal gas. CT, on the other
hand, has been reported to have a high diagnostic ability and can objectively scan a wide area in a short time, but it is
not performed in all patients due to radiation exposure, cost, and accessibility.
Comments
In treating appendicitis, complications including abscess formation and peritonitis are observed, but the appendix is
often found to be normal on surgery, and the frequency of such events used to be about 20%, because the therapeutic
approach was determined on the basis of physical findings and the WBC. 2) Recently, more exact diagnosis using
imaging modalities such as ultrasonography and CT is necessary.1)
According to meta-analysis by Terasawa et al. of 12 prospective trials using CT, the sensitivity was 94% (95%
confidence interval: 91-95%), and the specificity was 95% (93-96%).2) According to meta-analysis by Doria et
al. of pooled data from 31 prospective and retrospective trials using CT, they were 94 (92-95) and 94 (94-96)%,
respectively.3) However, meta-analysis by Terasawa et al. of 14 prospective trials using ultrasonography reported
sensitivity and specificity of 86 (83-88) and 81 (78-84)%, respectively.2) According to pooled date from 26 studies using
ultrasonography reported by Doria et al., they were 83 (78-87) and 93 (90-96)%, respectively, indicating significant
superiority of CT in sensitivity. In all analyses, considerable variation was observed in the background of patients,
prevalence, and presence or absence of contrast enhancement (intravenous, oral, rectal) among the reports, the criteria
for surgery or follow-up and exact criteria for the diagnosis were unclear, and there is the possibility these studies
overestimate of the sensitivity and specificity. However, CT clearly had high sensitivity and specificity and was superior
to ultrasonography in adults. Since many of these reports were about Western populations, the diagnostic performance
of ultrasonography is estimated to be higher in Japanese with a generally smaller physique, but perforation is difficult
to diagnose by ultrasonography, CT is recommended to be performed as much as possible in adults. Many papers in
Japanese were case reports or case collections, and none with a high evidence level was found.4,5)
Index words and secondary materials used as references
A search of PubMed was performed using “appendicitis”, “CT”, and “US” as key words. Blackmore CC et al: Imaging
in acute abdomen in evidence based imaging, written and edited by Medina LS & Blackmore CC, Springer 2006 was
also used as a reference.
References
1) Birnbaum BA et al: Appendicitis at the millennium. Radiology 215: 337-348, 2000 (Level 5)
2) Terasawa T et al: Systematic review: computed tomography and ultrasonography to detect acute appendicitis in adults and adolescents. Ann
Intern Med 141: 537-546, 2004 (Level 1)
3) Doria AS et al: US or CT for diagnosis of appendicitis in children and adults?: a meta-analysis. Radiology 241: 83-94, 2006 (Level 1)
4) Kondo H et al: The Usefulness of Computed Tomography in the Diagnosis and Evaluation of Surgical Indication of Acute Appendicitis.
Yamaguchi Med J 58: 203-208, 2009 (Level 4)
5) Honda Y et al: The status of appendiceal CT in our hospital. J Hiroshima Med Ass 59: 621-626, 2006 (Level 4)
91
The Japanese imaging guideline 2013
5. Gastrointestinal tract
103
Which modalities are appropriate for diagnostic
imaging of acute appendicitis in children?
Recommendation
grade
B
C1
C2
★本文中に,文献番号 6)の表記が無いので確認してください。
B Ultrasonography
C1 CT
C2 Abdominal plain radiography
In the diagnosis of acute appendicitis in children, CT has higher sensitivity and
similar specificity compared with ultrasonography but has problems such as radiation
exposure and accessibility. Therefore, it is recommended to perform ultrasonography
first and to perform CT when abnormality cannot be detected, or the diagnosis is
difficult, by ultrasonography.
The significance of abdominal plain radiography is unclear, and this modality is not
recommended.
Background/objective
In children, appendicitis is a frequent disease that progresses rapidly and leads to perforation in many patients.
Therefore, prompt diagnosis and treatment are necessary. However, CT involves radiation exposure. Imaging modalities
for acute appendicitis in children were evaluated.
Comments
In children, acute appendicitis is the most frequent form of acute abdomen and is a typical disease that requires
emergency surgery. Symptoms are of their equivocal in children, particularly young children, occasionally making the
diagnosis difficult. In addition, the disease progresses rapidly and often results in perforation, so it must be diagnosed
and treated promptly. The disease occurs more frequently in older children, being rare in those aged 5 years or less and
most frequent in those in their 10s-20s. The male-female ratio of patients is 3:2, and the disease occurs with a slight
predominance in boys. Postoperative complications still occur frequently in those who suffered perforation, and it is of
clinical importance not to overlook perforation and perform effective treatments. Particularly, in the diagnosis, attention
to exposure is necessary in consideration of the characteristic of children.
Doria et al. performed meta-analysis of 26 prospective and retrospective studies performed by ultrasound alone,
CT alone, and their combination.1) According to pooled data from 8 prospective studies using CT, the sensitivity
was 94% (95% confidence interval: 92-97%), and the specificity was 95% (94-97%). In 23 prospective trials using
ultrasonography, they were 88 (86-90) and 94 (92-95)%, respectively. Similarly to adults, CT was superior in sensitivity,
and the two modalities were comparable in specificity. These studies varied in the patients’ background, prevalence, and
presence or absence of contrast enhancement as in studies using adults. Also, while CT tended to be used more often in
the United States, ultrasonography was used more often in reports from Europe and Asia. Moreover, the number patients
aged 5 years or less was limited.
Two prospective studies were carried out using the design of performing ultrasonography first and adding CT only
when the appendix could not be identified, or a definitive diagnosis could not be made, by ultrasonography, and
reported a sensitivity of 77-97% and a specificity of 89-99%.2,3) In a randomized trial using 600 patients examined by a
combination of CT and ultrasonography or ultrasonography alone, the sensitivity and specificity were 99 and 89% by
the combination but 86 and 95%, respectively, by ultrasonography alone.4) It has also been reported that the appendix
could not be visualized by ultrasonography in 25% of underweight children, 33% of normal-weight children, but 79% of
overweight children.5) However, in these meta-analyses, the criteria for surgery or follow-up, which serve as grounds for
the diagnosis, were unclear, similar to reports concerning adults, and the possibility of overestimation of the sensitivity
and specificity has been suggested. Many of the papers in Japanese were case reports or case collections, and none with
a high evidence level was found.
For these reasons, CT is considered to have higher diagnostic ability as in adults (Figure). However, in consideration
of radiation exposure and accessibility, it is recommendable to perform ultrasonography first and to perform CT when
no abnormality can be detected or the diagnosis is difficult by ultrasonography.
Index words and secondary materials used as references
A search of PubMed was performed using “appendicitis”, “CT”, “US”, and “children” as key words.
92
The Japanese imaging guideline 2013
CQ 103
Figure: Acute appendicitis in children
Contrast-enhanced CT (coronal image)
An enlarged appendix showing wall thickening
and enhancement is observed in the right lower
abdominal region. The density of the surrounding
adipose tissue is elevated, indicating acute
appendicitis.
References
1) Doria AS et al: US or CT for diagnosis of appendicitis in children and adults? A meta-analysis. Radiology 241: 83-94, 2006 (Level 1)
2) Teo EL et al: Ultrasonography and computed tomography in a clinical algorithm for the evaluation of suspected acute appendicitis in children.
Singapore Med J 41: 387-392, 2000 (Level 3)
3) Garcia Peña BM et al: Ultrasonography and limited computed tomography in the diagnosis and management of appendicitis in children. JAMA
282: 1041-1046, 1999 (Level 3)
4) Kaiser S et al: Suspected appendicitis in children: US and CT—a prospective randomized study. Radiology 223: 633-638, 2002 (Level 2)
5) Puig S et al: Imaging of appendicitis in children and adolescents: useful or useless? A comparison of imaging techniques and a critical review
of the current literature. Semin Roentgenol 43: 22-28, 2008 (Level 5)
6) Hirakawa H et al: Accuracy of Ultrasonography for the Diagnosis of Suspected Pediatric Appendicitis: A Comparison of Results Obtained by
Different Operators. J Abdom Merg Med 24: 1041-1046, 2004 (Level 4)
93
The Japanese imaging guideline 2013
5. Gastrointestinal tract
★グレード欄の修正が正しいか,確認してください。
104
When appendicitis is suspected, what is the
appropriate CT scan protocol?
Recommendation
grade
For the diagnosis of appendicitis, there is no consensus about whether non-contrast
CT suffices or whether contrast enhancement should be used, there is no consensus
No relevant
for the appropriate scanning area. and slice thickness.
grade
Background/objective
The usefulness of CT for the diagnosis of acute appendicitis has recently become evident, but the scanning protocol
varies. While acute appendicitis is considered to be sufficiently diagnosable by non-contrast CT, methods using
intravenous contrast agents, oral or enteral gastrointestinal contrast agents, or their combinations are also performed.
The scanning area may also be wide, covering the abdominal to pelvic region, or be focused to avoid radiation exposure.
Comments
Many studies using CT with oral or rectal administration of a contrast agent have been reported in Western countries,
but intravenous contrast enhancement is more common in Japan. The sensitivity and specificity have been reported to
be 90 and 97%, respectively, even by non-contrast CT,1-3) and, according to a study in Japan, its diagnostic performance
was comparable to that of contrast-enhanced CT.4) However, there are also reports that the diagnostic performance was
improved by the use of a contrast agent.5) From Boston University, it has been reported that the use of an oral contrast
agent could be omitted by performing 64-row multislice CT using an intravenous contrast agent with MPR.6)
Concerning the slice thickness, the rates of appendix identification and definitive diagnosis were reportedly improved
as the slice thickness was thinner, and image reconstruction at a slice thickness of at least 5 mm or less is necessary.
Reconstruction in the coronal and sagittal planes is also considered useful. Some authors have recommended focused
CT for children to reduce the exposure.7,8) Scanning of the entire abdominal region is not always necessary to examine
whether the condition is appendicitis or not, and the diagnostic precision is not considered to differ even by focused
CT limited to the area below the lower pole of the right kidney.8) According to a report on the diagnosis of appendicitis
using low-dose CT, the diagnostic performance did not differ compared with normal-dose CT.9) The significance of lowdose CT, particularly, in children should be evaluated in the further study.
Index words and secondary materials used as references
A search of PubMed was performed using “appendicitis”, “CT”, “diagnosis”, “unenhanced”, and “enhanced” as key
words.
References
1) Malone AJ Jr et al: Diagnosis of acute appendicitis: value of unenhanced CT. AJR 160: 763-766, 1993 (Level 4)
2) Lane MJ et al: Unenhanced helical CT for suspected acute appendicitis. AJR 168: 405-409, 1997 (Level 4)
3) Lowe LH et al: Unenhanced limited CT of the abdomen in the diagnosis of appendicitis in children: comparison with sonography. AJR 176:
31-35, 2001 (Level 4)
4) Hoshino N et al: Efficacy of intravenous contrast enhancement in the diagnosis of acute appendicitis with multidetector-row CT. J Jpn Surg
Assoc 71: 1951-1958, 2010 (Level 4)
5) Naffaa LN et al: The value of contrast-enhanced helical CT scan with rectal contrast enema in the diagnosis of acute appendicitis. Clin Imaging
29: 255-258, 2005 (Level 4)
6) Anderson SW et al: Abdominal 64-MDCT for suspected appendicitis: the use of oral and IV contrast material versus IV contrast material only.
AJR 193: 1282-1288, 2009 (Level 2)
7) Mullins ME et al: Evaluation of suspected appendicitis in children using limited helical CT and colonic contrast material. AJR 176: 37-41, 2001
(Level 4)
8) Fefferman NR et al: Suspected appendicitis in children: focused CT technique for evaluation. Radiology 220: 691-695, 2001 (Level 4)
9) Seo H et al: Diagnosis of acute appendicitis with sliding slab ray-sum interpretation of low-dose unenhanced CT and standard-dose i.v. contrast-enhanced CT scans. AJR 193: 96-105, 2009 (Level 4)
94
The Japanese imaging guideline 2013
CQ 105
105
Is MRI appropriate when a pregnant woman is
suspected to have appendicitis?
Recommendation
grade
C1
D
C1 Non-contrast MRI
D Contrast-enhanced MRI
In pregnant women, MRI has some diagnostic value and may be considered.
Contrast enhancement should be avoided in MRI of pregnant women.
Background/objective
While the incidence of acute appendicitis during pregnancy is lower than in the non-pregnant period, the disease is the
most frequent acute abdomen during pregnancy. Generally, the appendix, which is considered to be displaced in upper
and lateral directions with enlargement of the uterus, is particularly difficult to identify by ultrasonography, preventing
the diagnosis. Also, the effectiveness of the modality depends largely on the examiner’s skill. The diagnostic power of
ultrasonography in pregnant women vary among reports.1-3) In patients with suspected appendicitis difficult to diagnose
by ultrasonography, CT has been reported to be useful.4,5) However, MRI, which is free of radiation exposure and is less
operator dependent, is expected to be useful in pregnant women.
Comments
Reports of the usefulness of MRI in pregnant women are limited to those of a few retrospective studies.3,6-8) The
sensitivity and specificity of MRI have been reported to be 90-100 and 93-98%, respectively, indicating a relatively high
diagnostic ability, but its diagnostic performance has not been assessed strictly or in comparison with other modalities.
Pedrosa et al. reported that the sensitivity and specificity of ultrasonography were 36 and 99%, but those of MRI were 100
and 93%, respectively.8) MRI also shows a negative predictive value of 100% and is excellent in excluding appendicitis.
Contrast-enhanced imaging should not be performed, because there is no report of its usefulness, and because the
contrast agent is transferred to fetuses.
Index words and secondary materials used as references
A search of PubMed was performed using “appendicitis”, “diagnosis”, and “pregnancy” as key words.
References
1) Lim HK et al: Diagnosis of acute appendicitis in pregnant women: value of sonography. AJR 159: 539-542, 1992 (Level 4)
2) Barloon TJ et al: Sonography of acute appendicitis in pregnancy. Abdom Imaging 20: 149-151, 1995 (Level 4)
3) Cobben LP et al: MRI for clinically suspected appendicitis during pregnancy. AJR 183: 671-675, 2004 (Level 4)
4) Wallace CA et al: Influence of imaging on the negative appendectomy rate in pregnancy. J Gastrointest Surg 12: 46-50, 2008 (Level 4)
5) Lazarus E et al: CT in the evaluation of nontraumatic abdominal pain in pregnant women. Radiology 244: 784-790, 2007 (Level 4)
6) Oto A et al: MR imaging in the triage of pregnant patients with acute abdominal and pelvic pain. Abdom Imaging 34: 243-250, 2009 (Level 4)
7) Pedrosa I et al: MR imaging evaluation of acute appendicitis in pregnancy. Radiology 238: 891-899, 2006 (Level 4)
8) Pedrosa I et al: Pregnant patients suspected of having acute appendicitis: effect of MR imaging on negative laparotomy rate and appendiceal
perforation rate. Radiology 250: 749-757, 2009 (Level 4)
95
The Japanese imaging guideline 2013
5. Gastrointestinal tract
106
Which imaging modalities are appropriate for the
diagnosis of ileus?
Recommendation
grade
B
C1
B CT
C1 Ultrasonography
CT and ultrasonography are more sensitive and specific than plain radiography, and
there modalities are recommended.
Additionally, CT is useful for the diagnosis of intestinal ischemia.
Since CT is more sensitive than ultrasonography, examination by CT is preferable.
Background/objective
In digestive tract obstruction, the early diagnosis of the site and cause of obstruction and the presence or absence of
intestinal ischemia is important. Digestive tract obstruction used to be diagnosed by abdominal plain radiography alone
after physical examination. Recently, however, modalities such as ultrasonography and CT are used frequently. In this
section, the significance of CT and ultrasonography compared with plain radiography was evaluated.
Comments
According to pooled data of 4 papers including some prospective studies (199 patients), the sensitivity and specificity
of plain radiography were 65 and 75%, respectively.1-4) In studies comparing 2 modalities, plain radiography was inferior
in both sensitivity and specificity to ultrasonography1,2) and MRI.3) Compared with CT, plain radiography was also
reported to be either inferior in both sensitivity and specificity2) or inferior in sensitivity but similar in specificity.4) From
these results, if the diagnosis is uncertain by plain radiography in patients with acute abdomen, CT or ultrasonography is
considered necessary.
The sensitivity and specificity of ultrasonography were 92 and 95%, respectively, according to pooled data of
4 studies, 1,2,5,6) and those of CT were 94 (71-100) and 78 (57-100)%, respectively, according to pooled data of
7 studies.2,3,7-11) In a small prospective study of Suri et al. evaluating 32 patients by plain radiography, CT, and
ultrasonography, CT showed high sensitivity (93%) and specificity (100%) for the diagnosis of ileus, was superior to
other modalities, and allowed the evaluation of the cause of ileus in 87% (23% by US and 7% by plain radiography).2)
While reports concerning MRI are limited, it has been reported to be highly sensitive and specific.3,11) Beall et al.
reported that it is superior to CT,11) but the number of cases was very limited.
The presence or absence of intestinal ischemia (strangulation) is important for the selection of treatment for ileus.
Physical findings are important, but they are insufficient in sensitivity or specificity, and imaging evaluation, particularly,
using CT is considered significant (Figure). On CT, findings such as an increase or decrease in contrast enhancement of
the intestinal wall, the target sign, closed loop formation, changes in the intestinal wall, mesenteric free fluid, congestion
of the mesenteric vein, and the beak sign are important. Concerning the diagnostic performance of CT, the sensitivity
was 95 (83-100)%, and the specificity was 90%, based on the pooled data of 399 cases in 5 reports.7-9,12,13) The negative
predictive value in particular was 98%, suggesting that strangulation is unlikely with a negative CT. Reports regarding
the effect of CT findings on the outcome are deficient, but, according to a prospective study of 57 cases by Taourel et al.,
the treatment was changed in 21% of the patients by performing CT.14)
Index words and secondary materials used as references
A search of PubMed was performed using “small bowel obstruction”, “plain radiography”, “CT”, “US”, and “MRI” as
key words. Blackmore CC et al: Imaging in acute abdomen in evidence-based imaging, Medina LS & Blackmore CC
ed, Springer 2006 was also used as a reference.
References
1) Ogata M et al: Prospective evaluation of abdominal sonography for the diagnosis of bowel obstruction. Ann Surg 223: 237-241, 1996 (Level 4)
2) Suri S et al: Comparative evaluation of plain films, ultrasound and CT in the diagnosis of intestinal obstruction. Acta Radiol 40: 422-428, 1999
(Level 4)
3) Matsuoka H et al: Preoperative evaluation by magnetic resonance imaging in patients with bowel obstruction. Am J Surg 183: 614-617, 2002
(Level 4)
4) Frager D et al: CT of small-bowel obstruction: value in establishing the diagnosis and determining the degree and cause. AJR 162: 37-41,
1994 (Level 4)
96
The Japanese imaging guideline 2013
CQ 106
A
B
Figure: Strangulation ileus CT
A Non-contrast B Portal-venous phase: The small intestine forms a closed loop and is hyperdense
on non-contrast CT ( → ). Enhancement of the intestine is poor on contrast-enhanced CT. Surgery
revealed that part of the greater omentum near the transverse colon and the mesentery formed a
cord-like structure, and the small intestine was trapped in it. Since the intestine showed necrosis-like
discoloration over a 20 cm segment, a 60 cm enterectomy was performed.
5) Czechowski J: Conventional radiography and ultrasonography in the diagnosis of small bowel obstruction and strangulation. Acta Radiol 37:
186-189, 1996 (Level 4)
6) Schmutz GR et al: Small bowel obstruction: role and contribution of sonography. Eur Radiol 7: 1054-1058, 1997 (Level 4)
7) Frager D et al: Detection of intestinal ischemia in patients with acute small-bowel obstruction due to adhesions or hernia: efficacy of CT. AJR
166: 67-71, 1996 (Level 3)
8) Balthazar EJ et al: Intestinal ischemia in patients in whom small bowel obstruction is suspected: evaluation of accuracy, limitations, and clinical
implications of CT in diagnosis. Radiology 205: 519-522, 1997 (Level 3)
9) Obuz F et al: The efficacy of helical CT in the diagnosis of small bowel obstruction. Eur J Radiol 48: 299-304, 2003 (Level 4)
10) Peck JJ et al: The role of computed tomography with contrast and small bowel follow-through in management of small bowel obstruction. Am J
Surg 177: 375-378, 1999 (Level 4)
11) Beall DP et al: Imaging bowel obstruction: a comparison between fast magnetic resonance imaging and helical computed tomography. Clin
Radiol 57: 719-724, 2002 (Level 4)
12) Zalcman M et al: Helical CT signs in the diagnosis of intestinal ischemia in small-bowel obstruction. AJR 175: 1601-1607, 2000 (Level 4)
13) Donckier V et al: Contribution of computed tomography to decision making in the management of adhesive small bowel obstruction. Br J Surg
85: 1071-1074, 1998 (Level 4)
14) Taourel PG et al: Value of CT in the diagnosis and management of patients with suspected acute small-bowel obstruction. AJR 165: 11871192, 1995 (Level 4)
97
The Japanese imaging guideline 2013
5. Gastrointestinal tract
107
Which imaging modalities are appropriate for the
diagnosis of colonic diverticulitis?
Recommendation
grade
B
C1
B CT
C1 Ultrasonography
CT and ultrasonography are recommended.
Between CT and ultrasonography, despite the lack of reliable data, there are many
reports that CT has higher sensitivity and specificity.
Background/objective
Diverticulitis of the colon is often treated conservatively, but the differentiation of right-sided diverticulitis from
appendicitis poses a problem. Also, as complications such as abscess formation may be observed, early and accurate
diagnosis is vital. Colonic diverticulitis has long been diagnosed by abdominal plain radiography and barium enema,
but the use of modalities such as CT (Figure) and ultrasonography has recently increased. The diagnostic value of these
modalities was evaluated.
Comments
Concerning the diagnostic performance of CT for colonic diverticulitis, the sensitivity, specificity, positive predictive
value, and negative predictive value were reported to be 89, 99, 99, and 90%, respectively, according to pooled
data of 414 patients in 4 studies,1-4) with high specificity and positive predictive value. As for ultrasonography, the
sensitivity, specificity, positive predictive value, and negative predictive value were reported to be 91, 92, 92, and 91%,
respectively, based on pooled data of 526 patients in 4 studies.5-8)
According to a report by Pradel et al., who prospectively evaluated the diagnostic performance of ultrasonography
and CT, more information could be obtained by CT in 11%, by US in 5%, and similar amount of information could be
obtained by the two modalities in 84%, suggesting that ultrasonography may be the modality of choice.9) However, as
the diagnosis of complications such as peritonitis is difficult by ultrasonography, the addition of CT is recommended
depending on the necessity.
CT has also been reported to be useful for the management of diverticulitis. In a prospective study of 542 patients by
Ambrosetti et al., surgery was often necessary, and the complication rate was higher, in patients with findings of severe
diverticulitis.10)
Thus, while CT and ultrasonography are useful for the diagnosis of colonic diverticulitis, it should be noted that the
differentiation from colorectal cancer is difficult in many patients by imaging findings alone.
Index words and secondary materials used as references
A search of PubMed was performed using “diverticulitis”, “CT”, “US”, and “MRI” as key words. Blackmore CC et al,
Imaging in acute abdomen in evidence based imaging, Medina LS & Blackmore CC ed, Springer 2006 was also used as
a reference.
References
1) Cho KC et al: Sigmoid diverticulitis: diagnostic role of CT-comparison with barium enema studies. Radiology 176: 111-115, 1990 (Level 4)
2) Stefánsson T et al: Diverticulitis of the sigmoid colon. A comparison of CT, colonic enema and laparoscopy. Acta Radiol 38: 313-319, 1997
(Level 4)
3) Rao PM, Rhea JT: Colonic diverticulitis: evaluation of the arrowhead sign and the inflamed diverticulum for CT diagnosis. Radiology 209: 775779, 1998 (Level 3)
4) Werner A et al: Multi-slice CT in routine diagnosis of suspected acute left-sided colonic diverticulitis. A prospective study of 120 patients. Eur
Radiol 13: 2596-2603, 2003 (Level 2)
5) Verbanck J et al: Can sonography diagnose acute colonic diverticulitis in patients with acute intestinal inflammation? A prospective study. J
Clin Ultrasound 17: 661-666, 1989 (Level 4)
6) Hollerweger A et al: Sigmoid diverticulitis: value of transrectal sonography in addition to transabdominal sonography. AJR 175: 1155-1160,
2000 (Level 3)
7) Zielke A et al: Prospective evaluation of ultrasonography in acute colonic diverticulitis. Br J Surg 84: 385-388, 1997 (Level 3)
98
The Japanese imaging guideline 2013
CQ 107
A
B
Figure: Colonic diverticulitis Contrast-enhanced CT MPR images
A diverticulum is observed in the proximal ascending colon. The density of the surrounding adipose tissue
is increased, indicating diverticulitis ( → ).
8) Schwerk WB et al: Sonography in acute colonic diverticulitis. a prospective study. Dis Colon Rectum 35: 1077-1084, 1992 (Level 3)
9) Pradel JA et al: Acute colonic diverticulitis: prospective comparative evaluation with US and CT. Radiology 205: 503-512, 1997 (Level 3)
10) Ambrosetti P et al: Colonic diverticulitis: impact of imaging on surgical management-a prospective study of 542 patients. Eur Radiol 5: 11451149, 2002 (Level 4)
99
The Japanese imaging guideline 2013
06
Gynecology
1
The Japanese imaging guideline 2013
6. Gynecology
108
In what situations is MRI appropriate for the
diagnosis and follow-up of endometriosis?
Recommendation
grade
C1
Transvaginal ultrasonography is recommended as the initial examination. MRI is
recommended for the diagnosis of ovarian and pelvic endometrioses, when the
presence of solid components suggestive of malignant tumor is suspected by
direct observation and transvaginal ultrasonography, when the differentiation from
other tumors is difficult, when the lesion itself is difficult to visualize by transvaginal
ultrasonography, and for the preoperative evaluation of the severity of adhesions.
Background/objective
Endometriosis is a disease that may cause dysmenorrhea and sterility and is a common disease observed in 6-10% of
women of reproductive age.1) Ovarian endometriosis may underlie diseases including endometrioid adenocarcinoma
and clear cell carcinoma and has been known to be related to borderline malignant tumors.1-3) Pelvic endometriosis also
causes adhesions, may induce pain or infertility, and is an indication for medication and lysis of adhesions.
Situations in which MRI is useful for the diagnosis and follow-up of ovarian and pelvic endometriosis were evaluated.
Comments
When endometriosis is suspected, transvaginal ultrasonography is the first choice screening modality. If an ovarian
tumor is suggested by transvaginal ultrasonography, and the differentiation between endometrioma and other tumors
is difficult, MRI is selected as the next step. The accuracy of differential diagnosis between endometriomas and other
adnexal masses by MRI is very high at 96%.4) Signal intensity of cyst contents are characteristic, being hyperintense on
both T1- and T2-weighted imaging or hyperintense on T1-weighted imaging but partially hypointense, a pattern called
“shading”, on T2-weighted imaging (Figure). Cysts may be irregular in shape and show sharp angles due to adhesions
to surrounding structures, and cysts of various sizes containing hemorrhage of various ages may be aggregated
(multiplicity). According to the General Rules for Clinical Management of Endometriosis of Japan, these findings are a
reliable basis for the determination of a therapeutic strategy.5)
Pelvic endometriosis is classified into peritoneal endometriosis present on the peritoneal surface and deep
endometriosis invading 5 mm or more into neighboring organs. The disease usually involves the uterine ligament,
rectovaginal septum, pouch of Douglas, and peritoneum but may also affect various sites including the intestinal
tract, ureter, and inguinal region. On MRI, lesions are hypointense on T2-weighted imaging, reflecting fibrosis, but
hyperintense on T1-weighted imaging and may or may not be accompanied by smaller lesions. The gold standard for
the final diagnosis of pelvic endometriosis is laparoscopy, which allows histological evaluation,1) but there have been
a number of reports on the preoperative diagnosis by transvaginal ultrasonography and MRI. It has been reported that
transvaginal ultrasonography shows slightly higher sensitivity, specificity, and accuracy for deep endometriosis but
should be performed complementarily with MRI,6) that MRI is relatively well correlated with surgery in deep pelvic
endometriosis,7,8) that its sensitivity and specificity for deep endometriosis are comparable to those of transvaginal
ultrasonography,9) but that MRI is more reliable than other preoperative examinations,10) and that the accuracy of MRI
for endometriosis spreading to parauterine tissues was 96.4%.11) Despite variation in diagnostic performance in pelvic
endometriosis with the site and examiner’s experience in image reading, 12) MRI is considered to contribute to the
preoperative diagnosis and mapping of pelvic endometriosis.
Similarly, transvaginal ultrasonography is recommended for periodic follow-up. Since ovarian endometriosis may
be origin of borderline malignant or malignant tumors, periodic follow-up is important. Cancers arising from ovarian
endometriosis preferentially occurs after menopause, and surgery is recommended for masses with a maximum diameter
of 9 cm or greater.3) An increase in the tumor size, a high CA125 level or its rapid increase,1,13,14) transvaginal ultrasound
findings suggesting a solid structure, and changes in the echo level of the contents to that of water due to exudate
production associated with cancerization14) have been reported as signs of malignant change. If such signs are observed,
further evaluation by MRI is necessary (See CQ112 for the discrimination from ovarian cancer).
Index words and secondary materials used as references
A search of PubMed was performed using “endometriosis”, “endometrioma”, “endometriotic cyst”, “MRI”, “diagnosis”,
“sensitivity”, and “specificity” as key words. The Japan Society of Obstetrics and Gynecology, the General Rules for
Clinical Management of Endometriosis (The 2nd Edition), 2010 was also used as a reference.
2
The Japanese imaging guideline 2013
CQ 108
A
B
Figure: Chocolate cyst of the left ovary MRI
A Transverse T2-weighted image B T1-weighted image Multilocular cystic tumor of
the left ovary, presenting with homogeneous hyperintensity onT1-weighted imaging and
heterogeneous hypointensity (shading) on T2-weighted imaging. Diagnosed as endometrioma
of the left ovary.
References
1) Giudice LC et al: Endometriosis. Lancet 364: 1789-1799, 2004 (Level 5)
2) Kobayashi H et al: Ovarian endometrioma: risks factors of ovarian cancer development. Eur J Obstet Gynecol Reprod Biol 138: 187-193, 2008
(Level 5)
3) Rutgers JL et al: Ovarian Mullerian mucinous papillary cystadenomas of borderline malignancy. A clinicopathologic analysis. Cancer 61: 340348, 1988 (Level 4)
4) Togashi K et al: Endometrial cysts: diagnosis with MR imaging. Radiology 180: 73-78, 1991 (Level 3)
5) Japan Society of Obstetrics and Gynecology. The General Rules for Clinical Management of Endometriosis (The 2nd Edition) 2010 . (Level 5)
6) Abrao MS et al: Comparison between clinical examination, transvaginal sonography and magnetic resonance imaging for the diagnosis of
deep endometriosis. Hum Reprod 22: 3092-3097, 2007 (Level 3)
7) Chamié L et al: Accuracy of magnetic resonance imaging for diagnosis and preoperative assessment of deeply infiltrating endometriosis. Int J
Gynecol Obstet 106: 198-201, 2009 (Level 3)
8) Bazot M et al: Deep pelvic endometriosis: MR imaging for diagnosis and prediction of extension of disease. Radiology 232: 379-389, 2004
(Level 3)
9) Saba L et al: MRI and “Tenderness Guided” transvaginal ultrasonography in the diagnosis of recto-sigmoid endometriosis. J Magn Reson
Imaging 35: 352-360, 2012 (Level 2)
10) Bazot M et al: Diagnostic accuracy of physical examination, transvaginal sonography, rectal endoscopic sonography, and magnetic resonance
imaging to diagnose deep infiltrating endometriosis. Fertil Steril 92: 1825-1833, 2009 (Level 2)
11) Bazot M et al: The value of MRI in assessing parametrial involvement in endometriosis. Hum Reprod 27: 2352-2358, 2012 (Level 3)
12) Saba L et al: Learning curve in the detection of ovarian and deep endometriosis by using magnetic resonance: comparison with surgical
results. Eur J Radiol 79: 237-244, 2011 (Level 2)
13) Valenzuela P et al: Endometrioid adenocarcinoma of the ovary and endometriosis. Eur J Obstet Gynecol Reprod Biol 134: 83-86, 2007 (Level 4)
14) Kobayashi H: Selection of treatment for chocolate cyst: in particular relation to malignant change. Obstet and Gynecol Pract 58: 1159-1167,
2009 (Level 5)
3
The Japanese imaging guideline 2013
6. Gynecology
109
Is MRI appopriate for the diagnosis of uterine
fibroids?
Recommendation
grade
C1
In patients who cannot be diagnosed by bimanual palpation or ultrasonography, MRI
is recommended as it contributes to the qualitative diagnosis.
In patients undergoing uterus-preserving invasive treatments (myomectomy, UAE,
FUS, etc.), MRI is useful for the accurate determination of the location, site, and
number of fibroids and is recommended.
Background/objective
For the diagnosis of uterine fibroids, bimanual palpation and ultrasonography by a gynecologist are the first choice,
but MRI may be ordered if the diagnosis is uncertain. Also, in patients scheduled to undergo invasive treatments
(myomectomy, UAE, FUS, etc.) assuming uterine preservation, MRI is recommended for the accurate determination of
the location, site, and number of fibroids. The usefulness of MRI for the diagnosis of uterine fibroids was evaluated.
Comments
Uterine fibroid is diagnosed mostly by bimanual palpation and ultrasonography (TVUS) by a gynecologist, and it
is uncommon to perform MRI for screening.1,2) MRI is ordered primarily for (1) further evaluation of patients not
diagnosable by ultrasonography and (2) preoperative evaluation of patients undergoing uterus-preserving invasive
treatments (myomectomy, UAE, FUS, etc.). According to a report of comparison with surgical specimens of
submucosal fibroids, the diagnostic performance of MRI (sensitivity: 100%, specificity: 91%) was superior to those of
TVUS (sensitivity: 83%, specificity: 90%) or hysteroscopy (sensitivity: 82%, specificity: 87%).3) In another study of
comparison with surgical specimens, the sensitivity of MRI (80%) was 2-fold higher than that of TVUS (40%), and MRI
was more reproducible (k=0.97) than TVUS (k=0.74).4) Evaluation of MRI and TVUS findings in fibroids before UAE
showed that they were closely correlated concerning the lesion size, but that the correlation was low with regards to the
location or number (R=0.17), and that MRI could detect more lesions and was useful for more exact determination of
location (submucosal, intramyometrial, subserosal).5) Another study on fibroids before UAE by MRI, the diagnosis was
changed in 18%, and the therapeutic strategy was changed in 22%, of the patients after MRI.6) From these evaluations,
MRI is recommended for the accurate determination of the location, site, and number of fibroids in patients undergoing
invasive treatments (Figures 1, 2).
A typical manifestation of fibroids on T2-weighted MRI is a hypointense mass with a clear border, but it may
be visualized as a hyperintensity in T2-weihted images depending on degenerations and histological subtypes,
posing difficulty in the discrimination from malignant tumors.7-9) While some lesions such as red degeneration and
lipoleiomyoma can be diagnosed due to characteristic imaging features,10,11) edema, necrotic degeneration, and cellular
leiomyoma are often difficult to diagnose by routine MRI, and the diagnostic performance is not improved even by
the addition of usual contrast-enhanced T1-weighted imaging.7,10,11) The discrimination of histological subtypes and
benign and malignant diseases has been attempted using contrast-enhanced dynamic studies and diffusion-weighted
imaging, and future evaluations are awaited.12-14) Also, both subserosal fibroid and ovarian fibrous tumor often present
low intensity signals on T2-weighted imaging, posing problems with the differentiation. On MRI, there have been
reports that delineation of flow voids of feeding vessels continuous from the uterine body was useful for the diagnosis
of myoma15) and that the evaluation of the enhancement pattern on contrast-enhanced dynamic studies was useful for the
differential diagnosis.16)
Index words and secondary materials used as references
A search of PubMed was performed using “leiomyoma”, “myoma”, “fibroid”, “uterus”, “uterine”, “MRI”, and “magnetic
resonance” as key words.
References
1) Parker WH: The utility of MRI for the surgical treatment of women with uterine fibroid tumors. Am J Obstet Gynecol 206: 31-36, 2012 (Level 3)
2) Cantuaria G et al: Comparison of bimanual examination with ultrasound examination before hysterectomy for uterine leiomyoma. Obstet
Gynecol 92: 109-112, 1998 (Level 3)
3) Dueholm M et al: Evaluation of the uterine cavity with magnetic resonance imaging, transvaginal sonography, hysterosonographic examination, and diagnostic hysteroscopy. Fertil Steril 76: 350-357, 2001 (Level 2)
4) Levens ED et al: Magnetic resonance imaging and transvaginal ultrasound for determining fibroid burden: implications for research and clinical
care. Am J Obstet Gynecol 200: 537, e1-7, 2009 (Level 3)
4
The Japanese imaging guideline 2013
CQ 109
Figure 1: Multiple uterine fibroids
T2-weighted image in the short axis
view of the uterine body obtained for the
evaluation before myomectomy. The sites
and number of fibroids and their distances
from the endometrium are clearly
delineated.
Figure 2: Subserosal leiomyoma
accompanied by edema
A hyperintense mass primarily seated
in the uterine cavity is shown by
T2-weighted imaging. This case poses
a problem with the discrimination from
endometrial tumor.
5) Spielmann AL et al: Comparison of MRI and sonography in the preliminary evaluation for fibroid embolization. AJR 187: 1499-1504, 2006
(Level 3)
6) Omary RA et al: The effect of pelvic MR imaging on the diagnosis and treatment of women with presumed symptomatic uterine fibroids. J Vasc
Interv Radiol 13: 1149-1153, 2002 (Level 3)
7) Hricak H et al: Uterine leiomyomas: correlation of MR, histopathologic findings, and symptoms. Radiology 158: 385-391, 1986 (Level 3)
8) Ha HK et al: MR imaging analysis of heterogeneous leiomyomas of the uterus. Front Biosci 2: 4-12, 1997 (Level 3)
9) Yamashita Y et al: Hyperintense uterine leiomyoma at T2-weighted MR imaging: differentiation with dynamic enhanced MR imaging and clinical implications. Radiology 189: 721-725, 1993 (Level 3)
10) Ueda H et al: Unusual appearances of uterine leiomyomas: MR imaging findings and their histopathologic backgrounds. Radiographics 19:
S131-S145, 1999 (Level 5)
11) Murase E et al: Uterine leiomyomas: histopathologic features, MR imaging findings, differential diagnosis, and treatment. Radiographics 19:
1179-1197, 1999 (Level 5)
12) Goto A et al: Usefulness of Gd-DTPA contrast-enhanced dynamic MRI and serum determination of LDH and its isozymes in the differential
diagnosis of leiomyosarcoma from degenerated leiomyoma of the uterus. Int J Gynecol Cancer 12: 354-361, 2002 (Level 2)
13) Tamai K et al: The utility of diffusion-weighted MR imaging for differentiating uterine sarcomas from benign leiomyomas. Eur Radiol 18: 723730, 2008 (Level 3)
14) Takeuchi M et al: Hyperintense uterine myometrial masses on T2-weighted magnetic resonance imaging: differentiation with diffusion-weighted magnetic resonance imaging. J Comput Assist Tomogr 33: 834-837, 2009 (Level 3)
15) Torashima M et al: The value of detection of flow voids between the uterus and the leiomyoma with MRI. J Magn Reson Imaging 8: 427-431,
1998 (Level 3)
16) Thomassin-Naggara I et al: Value of dynamic enhanced magnetic resonance imaging for distinguishing between ovarian fibroma and subserous uterine leiomyoma. J Comput Assist Tomogr 31: 236-242, 2007 (Level 3)
5
The Japanese imaging guideline 2013
6. Gynecology
110
Is MRI appropriate for the diagnosis of uterine
adenomyosis?
Recommendation
grade
C1
If abnormalities suggestive of adenomyosis are noted in the myometrium by
transvaginal ultrasonography, MRI is recommended to confirm the diagnosis and
evaluate complicating lesions.
Background/objective
Since symptoms of uterine adenomyosis vary widely and are non-specific, it is difficult to definitively diagnose by
clinical criteria alone. Transvaginal ultrasonography is often performed first in routine gynecological examination. The
usefulness of MRI for the diagnosis of uterine adenomyosis was evaluated using transvaginal ultrasonography as a
reference.
Comments
The sensitivity and specificity of MRI for the diagnosis of uterine adenomyosis are 70-89 and 86-93%, and those of
transvaginal ultrasonography are 65-89 and 65-98%, respectively, indicating no significant difference in diagnostic
performance.1-3) However, for the diagnosis of adenomyosis, which complicates uterine myoma in about 50% of the
patients, MRI with a sensitivity of 67% and a specificity of 87% is more accurate than transvaginal ultrasonography
with a sensitivity of 33% and specificity of 98%.1) Concerning uterine enlargement, also, MRI has been reported to show
high accuracy in the discrimination between leiomyoma and uterine adenomyosis as its cause.4)
Diffuse or localized thickening of the junctional zone (JZ) observed on T2-weighted imaging has been reported by
many authors as an MRI finding that serves as the basis of a diagnosis of uterine adenomyosis. This finding reflects
smooth muscle hyperplasia associated with ectopic endometrium.5) The thickness of the JZ is reported to be normally
8 mm or less,6) and 12 mm or thicker is generally accepted as a criterion for the diagnosis of adenomyosis. With
this criterion, the sensitivity and specificity have been reported to be 63-93 and 91-96%, respectively. 1,3) Punctate
hyperintensities observed in the myometrium on T2-weighted imaging have also been reported by many to be of
diagnostic use. This finding reflects cystic dilatation of gland ducts in ectopic endometrium in the lesion 5) and is a
specific finding (99%) while it is observed in about half the patients (Figures 1, 2).1)
When uterine adenomyosis is complicated by endometrial cancer, it must be noted that the border between cancer and
adenomyosis is unclear on T2- or contrast-enhanced T1-weighted imaging and that the presence diagnosis of uterine
body cancer and evaluation of the degree of myometrial involvement are difficult. In such circumstances, there is a
report that the border between lesions of uterine body cancer and adenomyosis could be clearly visualized by diffusionweighted imaging.7) Expectations for the modality are high, but further evaluation is necessary before its usefulness is
established.
Index words and secondary materials used as references
A search of PubMed was performed using “MRI” and “adenomyosis” as key words.
References
1) Bazot M et al: Ultrasonography compared with magnetic resonance imaging for the diagnosis of adenomyosis: correlation with histopathology.
Hum Reprod 16: 2427-2433, 2001 (Level 3)
2) Dueholm M et al: Magnetic resonance imaging and transvaginal ultrasonography for the diagnosis of adenomyosis. Fertil Steril 76: 588-594,
2001 (Level 2)
3) Reinhold C et al: Diffuse adenomyosis: comparison of endovaginal US and MR imaging with histopathologic correlation. Radiology 199: 151158, 1996 (Level 2)
4) Togashi K et al: Enlarged Uterus: differentiation between adenomyosis and leiomyoma with MR imaging. Radiology 171: 531-534, 1989 (Level
3)
5) Togashi K et al: Adenomyosis: diagnosis with MR Imaging. Radiology 166: 111-114, 1988 (Level 3)
6) Kang S et al: Adenomyosis: specificity of 5mm as the maximum normal uterine junctional zone thickness in MR images. AJR 166: 1145-1150,
1996 (Level 4)
7) Takeuchi M et al: Diffusion-weighted magnetic resonance imaging of endometrial cancer: differentiation from benign endometrial lesions and
preoperative assessment of myometrial invasion. Acta Radiol 50: 947-953, 2009 (Level 4)
6
The Japanese imaging guideline 2013
C Q 11 0
M
Figure 1: Uterine adenomyosis Sagittal
T2-weighted image
The junctional zone, showing low signal intensity,
is thickened in the posterior wall of the uterine
body ( → ), with many punctate hyperintensities
observed in the interior. A typical image of
uterine adenomyosis.
Figure 2: Uterine adenomyosis
complicated by fibroids Sagittal
T2-weighted image
Uterine adenomyosis complicated by
myoma. A lesion of adenomyosis primarily
affecting the posterior wall of the body of
uterus is delineated as a hypointense area
with an unclear border containing punctate
hyperintensities ( → ). In the anterior wall, a
fibroid is visualized as a hypointense mass
with a clear border (M).
7
The Japanese imaging guideline 2013
6. Gynecology
111
Is diagnostic imaging appropriate for staging ovarian
cancer?
Recommendation
grade
B
C1
B CT
C1 MRI, PET (PET/CT)
CT is recommended. MRI may be performed for the evaluation of invasion to
intrapelvic organs of the tumor. PET/CT may be performed for detecting small
peritoneal disseminations and metastases to areas outside the abdominal/pelvic
region such as supraclavicular lymph node metastasis.
Background/objective
In diagnostic imaging for the staging of ovarian cancer, invasion to surrounding pelvic organs, peritoneal
dissemination, and lymph node metastasis are major concerns. Since accurate information about these conditions is an
important basis for complete resection and optimal debulking (maximum diameter of residual tumor<1 cm), which are
important for the treatment of ovarian cancer, its diagnostic value is high. The usefulness of US, CT, MRI, and PET/CT
for the staging of ovarian cancer was evaluated.
Comments
A multicenter joint study evaluating the performance of US, CT, and MRI in staging ovarian cancer reported that all
these modalities accurately evaluated the extent of tumor involvement in the extraovarian pelvic region, abdominal
region, and outside the abdominal/pelvic region with no significant difference among the modalities.1) According to an
evaluation of peritoneal dissemination and lymph node metastasis on the basis of the above study,2) the area under the
ROC curve concerning the detection of peritoneal dissemination was significantly larger by MRI (0.96) than by US (0.86),
and MRI was particularly useful in the infradiaphragmatic space, but the ability to detect small lesions 2 cm or less in
diameter was low in both modalities. Therefore, it was concluded that CT and MRI are useful for the staging of ovarian
cancer and that US can be used complementarily.2)
Thus, CT and MRI are useful for the staging of ovarian cancer, but CT is a more practical choice today, when MDCT
is widely available and allows imaging in a short period. When sagittal and coronal views are evaluated together by
MDCT, peritoneal dissemination has been reported to be diagnosed with a specificity of 94-100% (Figure).3)
MRI is defined as the second imaging modality in the ACR and ESUR guidelines and is recommended when contrastenhanced CT cannot be performed due to contraindications to contrast agents or pregnancy or when a definitive
diagnosis is impossible by CT. However, in the diagnosis of intrapelvic invasion such as invasion to the uterus, sigmoid
colon, bladder, and pelvic wall, MRI with higher spatial resolution is reportedly superior to CT,4) and it should be
considered for the evaluation of intraperitoneal tumor invasion. Also, diffusion-weighted imaging is useful for the
detection of peritoneal dissemination5) and should be considered for its close evaluation.
A recommended area of CT examination is from the bottom of the lung to the inguinal region. The inclusion of the
bottom of the lung allows the evaluation of the presence or absence of supradiaphragmatic lymph node enlargement
and pleural effusion. Chest CT is considered when chest plain radiography showed thoracic abnormalities such pleural
effusion, or when supraclavicular lymph nodes are suspected to be enlarged.
Concerning PET/CT, there have been reports that PET/CT showed significantly higher sensitivity (69 vs. 38%) and
accuracy (94 vs. 90%) than CT alone for the detection of lesions,6) and that it showed more favorable results than CT
alone despite the absence of significant difference.7) Since the detectability of small peritoneal disseminations and
metastases outside the abdominal/pelvic region such as supraclavicular lymph node metastasis is improved in PET/CT,
the modality should be considered when the objective of examination is the detection of such lesions.
Index words and secondary materials used as references
A search of PubMed was performed using “CT”, “MRI”, “PET (PET/CT)”, “US”, “ovarian cancer or ovarian
carcinoma”, and “staging” as key words. The ACR Appropriateness Criteria® (Staging and follow-up of ovarian cancer)
and ESUR guidelines: ovarian cancer staging and follow-up were also used as references.
8
The Japanese imaging guideline 2013
C Q 111
A
B
C
D
Figure: Left ovarian serous carcinoma
A-C Contrast-enhanced CT D Contrast-enhanced CT (coronal MPR image) Left ovarian
cancer (C) is observed with multiple peritoneal disseminations in areas including the perihepatic
space, Morrison’s pouch, mesentery, greater omentum, paracolic sulcus, and pelvis (A-D). On the
coronal view, dissemination is clear in the right infradiaphragmatic space and Morrison’s pouch.
References
1) Kurtz AB et al: Diagnosis and staging of ovarian cancer: comparative values of Doppler and conventional US, CT, and MR imaging correlated
with surgery and histopathologic analysis--report of the Radiology Diagnostic Oncology Group. Radiology 212: 19-27, 1999 (Level 3)
2) Tempany CM et al: Staging of advanced ovarian cancer: comparison of imaging modalities-report from the radiological diagnostic oncology
group. Radiology 215: 761-767, 2000 (Level 3)
3) Pannu HK et al: Thin section dual-phase multidetector-row computed tomography detection of peritoneal metastases in gynecologic cancers. J
Comput Assist Tomogr 27: 333-340, 2003 (Level 3)
4) Forstner R et al: Ovarian cancer: staging with CT and MR imaging. Radiology 197: 619-626, 1995 (Level 2)
5) Low RN et al: Diffusion-weighted MRI of peritoneal tumors: comparison with conventional MRI and surgical and histopathologic findings-a feasibility study. AJR 193: 461-470, 2009 (Level 2)
6) Kitajima K et al: Diagnostic accuracy of integrated FDG-PET/contrast-enhanced CT in staging ovarian cancer: comparison with enhanced CT.
Eur J Nucl Med Mol Imaging 35: 1912-1920, 2008 (Level 3)
7) Nam EJ et al: Diagnosis and staging of primary ovarian cancer: correlation between PET/CT, Doppler US, and CT or MRI. Gynecol Oncol 116:
389-394, 2010 (Level 2)
9
The Japanese imaging guideline 2013
6. Gynecology
112
Is MRI appropriate for the qualitative diagnosis of
ovarian mass?
Recommendation
grade
B
For patients not diagnosable by ultrasonography, which is the first choice, MRI
contributes to the qualitative diagnosis of ovarian masses and is recommended.
Contrast-enhanced MRI improves the accuracy of the differentiation of benign and
malignant ovarian masses and is recommended.
Background/objective
While ultrasonography by a gynecologist is the first choice for the diagnosis of ovarian mass, MRI is frequently
ordered for undiagnosable patients. Also, incidental detection of ovarian masses during screening by ultrasonography
or examination for other diseases by modalities such as CT is increasing. The usefulness of MRI for the differentiation
between benign and malignant ovarian masses was evaluated.
Comments
Most of ovarian tumors are benign cystic masses and are diagnosable by ultrasonography. The accuracy of
ultrasonography (TVUS) for the differentiation between benign and malignant ovarian tumors is 80-83%, and while
it improves by the addition of color Doppler imaging, the diagnosis of lesions in which solid and cystic parts are
mixed is often reported to be difficult.1,2) There have been multiple reports that MRI was useful, with accuracies of 8393%, for the diagnosis of patients undiagnosable by ultrasonography.3-8) Findings suggestive of malignancy in ovarian
tumors include a large tumor diameter (≥4 cm), bilateral involvement, tumor consisting primarily of solid components,
tumor showing necrosis in the solid part, cystic tumor with a cyst wall or septal thickness of 3 mm or greater, and
cystic mass accompanied by papillary intramural nodules (Figure), and, as secondary findings, ascites, intraperitoneal
dissemination, and lymph node enlargement.5,9) Necrosis of the solid part and intramural nodules accompanying a cystic
mass are considered to contribute most to the diagnosis of malignancy. Also, as the diagnostic accuracy is improved
by contrast enhancement,5) the procedure is recommended in patients without contraindications. On the other hand,
the detection of fat, which suggests teratoma, a hemorrhagic cyst accompanied by shading on T2-weighted imaging,
which suggests an endometrioma, and strong hypointensity on T2-weighted imaging, which suggests fibrous tumor, are
considered to be findings associated with a high possibility of benignancy.1,10,11) Recently, there have been reports that
diffusion-weighed imaging and dynamic MRI are useful for the differentiation of benign and malignant lesions, 12-14)
and hyperintense solid parts with lower apparent diffusion coefficient and hypervascularity of the solid part on dynamic
MRI were shown to be correlated with malignancy, but further validation is necessary about the possibility of their
contribution to improvements in the accuracy.
Various benign and malignant tumors and tumor-like lesions occur in the ovary. Characteristic MRI findings reflecting
histological features frequently lead to specific diagnoses as well as the differentiation of benign and malignant diseases.
CT is inferior to MRI in contrast resolution, and while the detection of calcification may contribute to the qualitative
diagnosis of ovarian masses, its indications should be carefully evaluated in young females because of problems
including gonadal exposure.
Index words and secondary materials used as references
A search of PubMed was performed using “ovary”, “ovarian”, “adnexa”, “adnexal”, and “MRI” as key words, and
relevant references cited in the selected literature were also adopted. The ESUR guidelines (Spencer JA et al: ESUR
guidelines for MR imaging of the sonographically indeterminate adnexal mass: an algorithmic approach. Eur Radial 20:
25-35, 2010) was also used as a reference.
References
1) Kinkel K et al: US characterization of ovarian masses: a meta-analysis. Radiology 217: 803-811, 2000 (Level 1)
2) Bazot M et al: Value of magnetic resonance imaging for the diagnosis of ovarian tumors: a review. J Comput Assist Tomogr 32: 712-723, 2008
(Level 3)
3) Yamashita Y et al: Adnexal masses: accuracy of characterization with transvaginal US and precontrast and postcontrast MR imaging.
Radiology 194: 557-565, 1995 (Level 2)
4) Hamm B et al: MR imaging and CT of the female pelvis: radiologic-pathologic correlation. Eur Radiol 9: 3-15, 1999 (Level 3)
5) Hricak H et al: Complex adnexal masses: detection and characterization with MR imaging--multivariate analysis. Radiology 214: 39-46, 2000
(Level 2)
10
The Japanese imaging guideline 2013
C Q 11 2
A
B
Figure: Clear cell carcinoma of the ovary MRI
A Fat-suppressed contrast-enhanced T1-weighted image: A unilocular cystic mass is observed in
the ovary, accompanied by multiple enhancing intramural nodules. B Diffusion-weighted image: The
intramural nodules are markedly hyperintense.
6) Rieber A et al: Preoperative diagnosis of ovarian tumors with MR imaging: comparison with transvaginal sonography, positron emission tomography, and histologic findings. AJR 177: 123-129, 2001 (Level 3)
7) Sohaib SA et al: Characterization of adnexal mass lesions on MR imaging. AJR 180: 1297-1304, 2003 (Level 2)
8) Bazot M et al: MR imaging compared with intraoperative frozen-section examination for the diagnosis of adnexal tumors: correlation with final
histology. Eur Radiol 16: 2687-2699, 2006 (Level 2)
9) Stevens SK et al: Ovarian lesions: detection and characterization with gadolinium-enhanced MR imaging at 1.5T. Radiology 181: 481-488,
1991 (Level 3)
10) Jung SE et al: CT and MR imaging of ovarian tumors with emphasis on differential diagnosis. Radiographics 22: 1305-1325, 2002 (Level 5)
11) Siegelman ES et al: Tissue characterization in the female pelvis by means of MR imaging. Radiology 212: 5-18, 1999 (Level 5)
12) Thomassin-Naggara I et al: Epithelial ovarian tumors: value of dynamic contrast-enhanced MR imaging and correlation with tumor angiogenesis. Radiology 248: 148-159, 2008 (Level 3)
13) Thomassin-Naggara I et al: Contribution of diffusion-weighted MR imaging for predicting benignity of complex adnexal masses. Eur Radiol 19:
1544-1552, 2009 (Level 2)
14) Takeuchi M et al: Diffusion-weighted magnetic resonance imaging of ovarian tumors: differentiation of benign and malignant solid components
of ovarian masses. J Comput Assist Tomogr 34: 173-176, 2010 (Level 3)
11
The Japanese imaging guideline 2013
6. Gynecology
113
Is diagnostic imaging appropriate for the staging of
uterine cervical cancer?
Recommendation
grade
B
C1
B MRI, CT
C1 PET (PET/CT)
MRI is recommended for the measurement of the tumor diameter and evaluation of
the depth of local invasion, invasion to surrounding organs, and intrapelvic lymph
node metastasis. While CT is inferior to MRI in the ability to determine the depth of
invasion, it is recommended when MRI cannot be performed and for the diagnosis of
metastasis.
PET or PET/CT can be performed as it is useful for the evaluation of lymph node and
distant metastases, but it does not affect the staging.
Background/objective
Treatment for cervical cancer has two pillars, i.e., surgery and radiation therapy, and the treatment is selected according
to the General Rules for Clinical and Pathological Study of Uterine Cervical Cancer (3rd edition: Japan Society of
Obstetrics and Gynecology). This edition clearly states, “Imaging modalities such as CT and MRI can be used for the
evaluation of the spread and size of tumor,” and diagnostic imaging plays an important role in the clinical staging of
cervical cancer. In this section, the usefulness of imaging modalities for staging cervical cancer was evaluated.
Comments
Used for the staging according to the General Rules for Clinical and Pathological Study of Uterine Cervical Cancer
vary in effectiveness among examiners and have limitations in the evaluation of intrapelvic lymph nodes. In Japan, CT
or MRI is performed before treatment in most patients with cervical cancer, and PET/CT is also used at some facilities.
Ultrasonography is often performed at gynecological outpatient clinics simultaneously with pelvic examination and
is useful due to its simplicity and low cost. While the results of transvaginal or transrectal ultrasonography concerning
the local spread have been reported to be similar or relatively good compared with CT or MRI,1,2) it is inferior to these
modalities in the evaluation of lymph node metastasis and objectivity.
CT and MRI have been suggested since early times to be useful for the staging, and a multicenter meta-analysis
reported that MRI is more sensitive than CT for parametrial invasion (55% by CT, 74% by MRI) (Figure) and that
they are nearly equal in diagnosing lymph node metastasis.3)According to a joint multicenter research conducted by the
American College of Radiology Imaging Network (ACRIN) and Gynecologic Oncology Group (GOG), the sensitivities
of MRI and CT for stage IIb or more advanced cancer were relatively low (42% by CT, 53% by MRI), but their
specificities were high (82% by CT, 85% by MRI).4) Regarding invasion to other organs such as the bladder and rectum,
MRI was more sensitive than CT and is useful for the selection of treatment.5) Cystoscopy, rectoscopy, and excretory
urography are considered to be substitutable with MRI or CT.6) Also, the evaluation of the tumor volume is important for
the prognosis and evaluation of the therapeutic effect, and the tumor volume and its shrinkage due to radiation therapy
can be evaluated objectively by MRI.7)
Concerning gadolinium contrast enhancement, no sufficient universal consensus has been reached. Staging is made
basically by T2-weighted imaging, and while the contrast between the tumor and normal myometrium is reportedly
improved in contrast enhanced MRI with a consequent improvement in the diagnostic ability, 8) its indications are
limited, and the modality does not necessarily contribute to improvements in diagnostic performance.
Diffusion-weighted imaging has also begun to be used more extensively in the abdomen and pelvis due to
improvements in MRI equipment. Cervical cancer is hyperintense on diffusion-weighted imaging and shows a low
apparent diffusion coefficient (ADC).9) Concerning the usefulness of the modality, greater attention is directed to the
prediction of the therapeutic effect10) and delineation ability of lymph node metastasis11) than to the diagnosis of local
invasion.
CT or PET/CT is used for close evaluation of distant metastasis and paraaortic lymph node metastasis. According to
analysis by the ACRIN/GOG, both CT and MRI show a low sensitivity (37% by CT, 31% by MRI) but a high specificity
(94% by CT, 56% by MRI) when a short diameter of the node of ≥1 cm was used as the criterion of lymph node
metastasis.12) A meta-analysis reported that PET and PET/CT were more sensitive than CT or MRI (82% by PET and
PET/CT, 50% by CT, 56% by MRI), but lymph node metastasis is not taken into consideration in staging and, presently,
is not an essential item.13)
12
The Japanese imaging guideline 2013
C Q 11 3
A
B
Figure: Uterine cervical cancer IIb MRI
A Sagittal T2-weighted imaging: A tumor slightly hyperintense compared
with the normal myometrium is observed in the anterior lip of the uterine
cervix ( → ). The laminar structure of the normal cervix is lost. B
Transverse T2-weighted imaging: The tumor extends beyond the cervical
region and is in contact with the surrounding adipose tissue ( → ). No
extensive invasion involving the bladder or lateral vessels is observed.
Index words and secondary materials used as references
A search of PubMed was performed using “uterine cervical cancer”, “uterine cervical adenocarcinoma”, “uterine
cervical carcinoma”, “US”, “CT”, “MRI”, and “PET” as key words. The Japan Society of Obstetrics and Gynecology
et al eds: General Rules for Clinical and Pathological Management of Uterine Cervical Cancer 2011, the Japan Society
of Gynecologic Oncology: Treatment Guidelines for Cervical Cancer 2011, Balleyguier C et al: ESUR guidelines for
staging of uterine cervical cancer with MRI 2011, and ACR guidelines for staging of invasive cancer of the cervix, 2008
were also used as references.
References
1) Fischerova D et al: Transrectal ultrasound and magnetic resonance imaging in staging of early cervical cancer. Int J Gynecol Cancer 18: 766772, 2008 (Level 3)
2) Testa AC et al: Transvaginal ultrasonography and magnetic resonance imaging for assessment of presence, size and extent of invasive cervical cancer. Ultrasound Obstet Gynecol 34: 335-344, 2009 (Level 3)
3) Bipat S et al: Computed tomography and magnetic resonance imaging in staging of uterine cervical carcinoma: a systematic review. Gynecol
Oncol 91: 59-66, 2003 (Level 2)
4) Hricak H et al: Role of imaging in pretreatment evaluation of early invasive cervical cancer: results of the intergroup study American College of
Radiology Imaging Network 6651-Gynecologic Oncology Group 183. J Clin Oncol 23: 9329-9337, 2005 (Level 2)
5) Kim WY et al: Reliability of magnetic resonance imaging for bladder or rectum invasion in cervical cancer. J Reprod Med 56: 485-490, 2011
(Level 3)
6) Amendola MA et al: Utilization of diagnostic studies in the pretreatment evaluation of invasive cervical cancer in the United States: results of
intergroup protocol ACRIN 6651/GOG 183. J Clin Oncol 23: 7454-7459, 2005 (Level 2)
7) Wang JZ et al: Sequential magnetic resonance imaging of cervical cancer: the predictive value of absolute tumor volume and regression ratio
measured before, during, and after radiation therapy. Cancer 116: 5093-5101, 2010 (Level 3)
8) Akita A et al: Comparison of T2-weighted and contrast-enhanced T1-weighted MR imaging at 1.5T for assessing the local extent of cervical
carcinoma. Eur Radiol 21: 1850-1857, 2011 (Level 3)
9) Naganawa S et al: Apparent diffusion coefficient in cervical cancer of the uterus: comparison with the normal uterine cervix. Eur Radiol 15:
71-78, 2005 (Level 3)
10) Liu Y et al: Diffusion-weighted imaging in predicting and monitoring the response of uterine cervical cancer to combined chemoradiation. Clin
Radiol 64: 1067-1074, 2009 (Level 3)
11) Chen YB et al: Discrimination of metastatic from hyperplastic pelvic lymph nodes in patients with cervical cancer by diffusion-weighted magnetic resonance imaging. Abdom Imaging 36: 102-109, 2011 (Level 3)
12) Mitchell DG et al: Early invasive cervical cancer: MRI and CT predictors of lymphatic metastases in the ACRIN 6651/GOG 183 intergroup
study. Gynecol Oncol 112: 95-103, 2009 (Level 2)
13) Choi HJ et al: Diagnostic performance of computer tomography, magnetic resonance imaging, and positron emission tomography or positron
emission tomography/computer tomography for detection of metastatic lymph nodes in patients with cervical cancer: meta-analysis. Cancer
Sci 101: 1471-1479, 2010 (Level 2)
13
The Japanese imaging guideline 2013
6. Gynecology
114
Is diagnostic imaging appropriate for the staging of
endometrial cancer?
Recommendation
grade
B
C1
B MRI, CT
C1 PET (PET/CT)
It is recommended to preoperatively perform pelvic MRI and evaluate the local
spread and intrapelvic lymph node metastasis. Contrast-enhanced MRI is preferred.
It is recommended to perform abdominopelvic contrast-enhanced CT and evaluate
distant and lymph node metastasis. If MRI cannot be performed, the local spread is
alternatively evaluated by contrast-enhanced CT.
If the tumor shows local invasion, a histological type with a poor prognosis, or a high
degree of malignancy, chest CT or PET (PET/CT) may be performed to evaluate
distant and lymph node metastasis.
Background/objective
The prognosis of endometrial cancer depends on the histological type, degree of malignancy, and stage of the tumor.
In advanced stages, diagnostic imaging contributes greatly to the evaluation of myometrial and cervical invasion,
adnexal spread, and lymph node and distant metastasis. More accurate preoperative diagnosis concerning these features
helps with the selection of the surgical procedure and determination of the therapeutic strategy. Myometrial invasion,
in particular, is strongly correlated with lymph node metastasis, and its accurate preoperative diagnosis is highly
significant. The usefulness of TVUS, CT, MRI, and PET/CT for the diagnosis of preoperative staging of endometrial
cancer was evaluated.
Comments
Evidence-based guidelines for treatment of uterine body neoplasm in Japan recommend preoperative assessment
of myometrial and cervical invasion by MRI and lymph node and distant metastasis by various imaging modalities
(recommendation grade: C1).
Concerning the preoperative staging of endometrial cancer, Kinkel et al. reported a meta-analysis in 1999 that there
was no significant difference among TVUS, CT, and MRI.1) In the same report, however, contrast-enhanced MRI was
shown to be significantly more useful than non-contrast MRI, TVUS, or CT for the evaluation of myometrial invasion
(Figures 1, 2).
Regarding myometrial invasion, many reports showed that the sensitivity and specificity of TVUS were high and did
not significantly differ compared with those of MRI,2,3) but reports indicating MRI is highly sensitive and specific and
more useful are increasing. Particularly, there have been many reports indicating the usefulness of contrast-enhanced
MRI,4,5) and the accuracy of the diagnosis of myometrial invasion was 92% by contrast-enhanced MRI compared with
78% by T2-weighted imaging.4) The ACR Appropriateness Criteria also recommend MRI, particularly contrast-enhanced
MRI, unless there are contraindications. Dynamic contrast-enhanced MRI is preferred if possible. Internationally, it
appears common to perform MRI only when the evaluation is difficult by TVUS because of the cost, but as there are
problems such as the risk of dissemination by the scanning procedure and dependence of the precision on the examiner’s
skill, MRI, which is more objective, is very useful.
However, there is a report that the sensitivity of MRI was 87% for shallow myometrial invasion but 56% for deep
myometrial invasion, suggesting a decline in the diagnostic ability for the latter.6) High magnetic field MRI (3T) has
been reported to be superior to conventional MRI in evaluating deep myometrial invasion, but no significant difference
has been demonstrated by overall evaluation including cervical invasion and lymph node metastasis.
MRI is also useful for the evaluation of cervical invasion. However, while its sensitivity (67%), specificity (95%), and
accuracy (91%) have been reported to be higher than those of TVUS,7) the sensitivity (19%) and accuracy (84%) have
also been reported to be low, suggesting limitations in the evaluation, and the results have not been consistent.6)
The diagnostic performance of imaging modalities for lymph node metastasis is low with a sensitivity of about 50%
due to the presence of micrometastases by imaging modalities using the lymph node size (short diameter ≥1 cm) as a
diagnostic criterion.5) PET/CT has been reported to be relatively superior to other imaging modalities in the evaluation
of lymph node metastasis, but it shows only slightly higher sensitivity, and its sensitivity to unenlarged lymph nodes
with a diameter of 10 mm or less is low similarly to other modalities.8-10)
Also, while PET/CT is reportedly useful for the detection of distant metastasis, its value has not been sufficiently
established.9,10) According to a report comparing PET/CT and CT/MRI, the sensitivity of PET/CT for distant metastasis
14
The Japanese imaging guideline 2013
C Q 11 4
A
B
Figure 1: Uterine body cancer Ia
A T2-weighted image B Postcontrast image Preoperative MRI of uterine body cancer. Both
on T2-weighted imaging (A) and in the equilibrium phase of dynamic contrast-enhanced MRI
(B), the border between the endometrial lesion and myometrium remains clear and smooth,
allowing a diagnosis of no myometrial invasion ( → ).
A
B
Figure 2: Uterine body cancer Ib
A T2-weighted image B Postcontrast image The border between the endometrial lesion and
myometrium is unclear and irregular from the anterior wall to the fundus, and the endometrial
lesion appears to penetrate into the myometrium ( → ) on the T2-weighted image (A). On the
postcontrast image (B), the lesion is shown to extend deep into the myometrium ( → ).
was 83.3% and was higher than 66.7% for CT/MRI, but there was no difference in specificity.9)
Since many uterine body cancers are detected in an early stage without metastasis, some authors consider that
examination to the thoracic region using CT for distant metastasis is unnecessary except in histological types with a
poor prognosis such as serous adenocarcinoma and clear cell adenocarcinoma, highly malignant tumors at a high risk of
metastasis, and tumors showing local invasion.
Diffusion-weighted MRI has recently begun to be employed widely for the examination of the abdomen and pelvis.
Despite high frequency of overlapping findings, uterine body cancer is hyperintense and shows a lower apparent
diffusion coefficient (ADC) compared with benign endometrial lesions on diffusion-weighted imaging. There is also a
report that diffusion-weighted imaging is superior to contrast-enhanced MRI in the evaluation of myometrial invasion
and staging.11)
Among modalities, CT shows lower contrast resolution and is less effective for delineating lesions in the uterine body
than MRI. Therefore, it is not very useful for the assessment of local spread12) and is suited for the search for lymph
node and distant metastasis. However, if MRI is not available, local spread can be evaluated by contrast-enhanced CT.
In the ACR Appropriateness Criteria, CT is recommended for the diagnosis of abdominal lymph node metastasis,
15
The Japanese imaging guideline 2013
6. Gynecology
but abdominal MRI is also recommended in consideration of radiation exposure. However, as it is necessary to scan a
relatively wide area to search for metastases, CT is considered preferable to MRI if performed for this purpose.
Index words and secondary materials used as references
A search of PubMed was performed using “uterine body cancer”, “uterine endometrial cancer”, “uterine endometrial
carcinoma”, “staging”, “computed tomography”, “computerized tomography”, “CT”, “magnetic resonance imaging”,
“MRI”, “positron emission tomography”, “PET”, “PET/CT”, “FDG-PET”, “ultrasound”, “ultrasonography”, and “US”
as key words. The Japan Society of Gynecologic Oncology ed: Treatment Guidelines for Uterine Body Cancer, 2009
and ACR Appropriateness Criteria®: Pretreatment Evaluation and Follow-up of Endometrial Cancer of the Uterus, 2010
were also used as references.
References
1) Kinkel K et al: Radiologic staging in patients with endometrial cancer: a meta-analysis. Radiology 212: 711-718, 1999 (Level 3)
2) Chang SJ et al: Value of sonohysterography in preoperative assessment of myometrial invasion for patients with endometrial cancer. J
Ultrasound Med 29: 923-929, 2010 (Level 3)
3) Sawicki W et al: The value of ultrasonography in preoperative assessment of selected prognostic factors in endometrial cancer. Eur J
Gynaecol Oncol 24: 293-298, 2003 (Level 3)
4) Sala E et al: Added value of dynamic contrast-enhanced magnetic resonance imaging in predicting advanced stage disease in patients with
endometrial carcinoma. Int J Gynecol Cancer 19: 141-146, 2009 (Level 2)
5) Manfredi R et al: Local-regional staging of endometrial carcinoma: role of MR imaging in surgical planning. Radiology 231: 372-378, 2004
(Level 2)
6) Ortashi O et al: Evaluation of the sensitivity, specificity, positive and negative predictive values of preoperative magnetic resonance imaging
for staging endometrial cancer. A prospective study of 100 cases at the Dorset Cancer Centre. Eur J Ostet Gynecol Reprod Biol 137: 232-235,
2008 (Level 3)
7) Cicinelli E et al: Reliability of diagnostic fluid hysteroscopy in the assessment of cervical invasion by endometrial carcinoma: comparative study
with transvaginal sonography and MRI. Gynaecol Oncol 111: 55-61, 2008 (Level 2)
8) Kitajima K et al: Accuracy of 18F-FDG PET/CT in detecting pelvic and paraaortic lymph node metastasis in patients with endometrial cancer.
AJR 190: 1652-1658, 2008 (Level 2)
9) Suzuki R et al: Validity of positron emission tomography using fluoro-2-deoxyglucose for the preoperative evaluation of endometrial cancer. Int
J Gynaecol Cancer 17: 890-896, 2007 (Level 3)
10) Park JY et al: Comparison of the validity of magnetic resonance imaging and positron emission tomography/computed tomography in the preoperative evaluation of patients with uterine corpus cancer. Gynecol Oncol 108: 486-492, 2008 (Level 3)
11) Beddy P et al: Evaluation of depth of myometrial invasion and overall staging in endometrial cancer: comparison of diffusion-weighted and
dynamic contrast-enhanced MR imaging. Radiology 262: 530-537, 2012 (Level 2)
12) Hardesty LA et al: The ability of helical CT to preoperatively stage endometrial carcinoma. AJR 176: 603-606, 2001 (Level 2) but abdominal
MRI is also recommended in consideration of radiation exposure. However, as it is necessary to scan a relatively wide area to search for
metastases, CT is considered preferable to MRI if performed for this purpose.
16
The Japanese imaging guideline 2013
C Q 11 5
115
Is diagnostic imaging useful for the diagnosis of
uterine sarcoma?
Recommendation
grade
B
C1
B Staging: MRI and CT
C1 Qualitative diagnosis: MRI
MRI is recommended for the qualitative diagnosis of uterine sarcoma, although the
evidence level is not high. Dynamic contrast-enhanced MRI may also be performed,
as it may contribute to the diagnosis. For staging uterine sarcoma, the evaluation by
MRI or CT is recommended.
Background/objective
Uterine sarcoma is often difficult to diagnose by cytological examination or biopsy, and it is often problematic to
distinguish benign dengenerated uterine leiomyomas and uterne sarcomas. Carcinosarcoma is recently considered to
be metaplasia of endometrial cancer, however it is included as uterine sarcoma in many retrospective studies and also
included in this evaluation. The usefulness of diagnostic imaging for the preoperative diagnosis and staging of uterine
sarcoma is evaluated.
Comments
Ultrasonography, which is the first imaging modality of choice in the gynecologic disorders, was suggested to be
useful for the differentiating between uterine leiomyoma and sarcoma in early reports,1) but this could not be confirmed
in subsequent studies.2) MRI has high soft tissue contrast and is useful for the differential diagnosis of uterine masses.
Sarcoma was reported to be a large mass with heterogeneous signal intensity due to hemorrhage and necrosis. 3)
However, Cornfeld et al. reported that there is no objective criteria in the differentiation between benign and malignant
uterine mesenchymal tumors by MRI.4) Diffusion-weighted imaging is a recent developed technique in which malignant
lesions tend to show high intensity because of high cellularity and allows quantitative evaluation by the measurement
of the apparent diffusion coefficient (ADC). The diagnostic performance for uterine sarcoma was improved by the
measurement of the ADC,5-8) and further accumulation of cases is awaited.
The clinical course and treatment of uterine sarcoma vary with the histological type. Reported MRI features of each
histological type helps the diagnosis, although no reports with high evidence level exists due to rarity and lack of largescale studies of uterine sarcomas. The presence of hemorrhage and necrosis which can be evaluated by MRI signals
give clues to the diagnosis of uterine leiomyosarcoma (Figure).9) Contrast-enhanced MRI is useful for the evaluation of
necrosis, and the accuracy has been reported to be improved by dynamic contrast-enhanced MRI with the measurement
of LDH isozymes.10) Endometrial stromal sarcoma exhibits various invasion patterns, and MRI findings such as bands of
low signal intensity on T2-weighted imaging and continuous tumor extent along the blood vessels and the ligaments are
informative.11) Carcinosarcoma is difficult to differentiate from uterine body cancer, however on MRI it is a large mass
that dilates the uterine cavity and shows characteristic MRI features such as heterogeneous hyperintensity on T2-weighted
imaging, early and persistent ehhancement and/or gradual and delayed strong enhancement.12,13)
Although the clinical staging of uterine sarcoma used to be made similarly to uterine body cancer, a new staging
system was established by the FIGO in 2009. The diagnosis of uterine sarcoma may be difficult, however, MRI and CT
are recommended for the assessment of local and distant metastasis.
Index words and secondary materials used as references
A search of PubMed was performed using “uterine sarcomas”, “endometrial stromal sarcomas”, “uterine
leiomyosarcomas”, “uterine carcinosarcomas”, and “diagnostic imaging” as key words.
17
The Japanese imaging guideline 2013
6. Gynecology
A
B
Figure: Uterine leiomyosarcoma
A T2-weighted image: A heterogeneously hyperintense mass is observed in the myometrium of
the uterine body ( → ). B T1-weighted image: Irregular T1 hyperintensities are presented in the
mass ( → ), suggesting hemorrhage due to necrosis, and leiomyosarcoma is likely based on the
images.
References
1) Hata K et al: Uterine sarcoma: can it be differentiated from uterine leiomyoma with Doppler ultrasonography? A preliminary report. Ultrasound
Obstet Gynecol 9: 101-104, 1997 (Level 3)
2) Aviram R et al: Uterine sarcomas versus leiomyomas: gray-scale and Doppler sonographic findings. J Clin Ultrasound 33: 10-13, 2005 (Level
3)
3) Sahdev A et al: MR imaging of uterine sarcomas. AJR 177: 1307-1311, 2001 (Level 4)
4) Cornfeld D et al: MRI appearance of mesenchymal tumors of the uterus. Eur J Radiol 74: 241-249, 2010 (Level 3)
5) Tamai K et al: The utility of diffusion-weighted MR imaging for differentiating uterine sarcomas from benign leiomyomas. Eur Radiol 18: 723730, 2008 (Level 2)
6) Takeuchi M et al: Hyperintense uterine myometrial masses on T2-weighted magnetic resonance imaging: differentiation with diffusion-weighted magnetic resonance imaging. J Comput Assist Tomogr 33: 834-837, 2009 (Level 2)
7) Fujii S et al: Diagnostic accuracy of the apparent diffusion coefficient in differentiating benign from malignant uterine endometrial cavity lesions:
initial results. Eur Radiol 18: 384-389, 2008 (Level 3)
8) Namimoto T: Combined use of T2-weighted and diffusion-weighted 3-T MR imaging for differentiating uterine sarcomas from benign leiomyomas. Eur Radiol 19: 2756-2764, 2009 (Level 2)
9) Tanaka YO et al: Smooth muscle tumors of uncertain malignant potential and leiomyosarcomas of the uterus: MR findings. J Magn Reson
Imaging 20: 998-1007, 2004 (Level 4)
10) Goto A et al: Usefulness of Gd-DTPA contrast-enhanced dynamic MRI and serum determination of LDH and its isozymes in the differential
diagnosis of leiomyosarcoma from degenerated leiomyoma of the uterus. Int J Gynecol Cancer 12: 354-356, 2002 (Level 2)
11) Koyama T et al: MR imaging of endometrial stromal sarcoma: correlation with pathologic findings. AJR 173: 767-772, 1999 (Level 4)
12) Teo SY et al: Primary malignant mixed Mullerian tumor of the uterus: findings on sonography, CT, and gadolinium enhanced MRI. AJR 191:
278-283, 2008 (Level 4)
13) Ohguri T et al: MRI findings including gadolinium-enhanced dynamic studies of malignant mesodermal tumors of the uterus: differentiaton from
endometrial carcinomas. Eur Radiol 12: 2737-2742, 2002 (Level 3)
18
The Japanese imaging guideline 2013
C Q 11 6
116
Is PET appropriate for the diagnosis and follow-up of
gynecological tumors?
Recommendation
grade
B
C1
B Restaging for uterine and ovarian cancers
C1 Restaging for gynecological cancers other than uterine and ovarian cancers
PET is useful and recommended for the diagnosis of recurrence of uterine and ovarian
cancers. It has been reported to be useful in recurrent gynecological malignancy
other than uterine and ovarian cancers, although there is still limited evidence. For
this reason, its clinical application may be considered.
Background/objective
Positron emission tomography (PET) using fluorodeoxyglucose (FDG) is one of the relatively new imaging modalities
clinically applied to various malignant neoplasms. The usefulness of PET (PET/CT) in gynecological tumors was
evaluated.
Comments
Since gynecological malignancies can be classified into uterine, ovarian, and fallopian tube cancers and other
malignant neoplasms including sarcoma, the usefulness of PET is discussed in relation to the goal of its use, i.e., the
diagnosis, differential diagnosis, staging, diagnosis of recurrence, and assessment of therapeutic effects. PET has no role
in the diagnosis or differential diagnosis of primary uterine cervical and endometrial cancers because the uterine cavity
can be observed directly with ease, cells and tissues can be sampled, and the endometrium shows physiologic uptake in
some periods of the menstrual cycle.
In the staging, the sensitivity and specificity of PET (PET/CT) for intrapelvic lymph node metastasis of uterine
cervical cancer have been reported to be 79 and 99%, and those for para-aortic lymph node metastasis to be 84 and 95%,
respectively,1) suggesting that it is a modality that can complement CT or MRI. However, its sensitivity to Stage Ib1-IIa
lesions with a primary focus 4 cm or less in diameter is low at 32%, and the modality exerts little effect on therapeutic
strategy.2) In uterine body cancer, also, PET shows sensitivity and specificity of 73 and 95% for intrapelvic lymph node
metastasis and 85 and 95%, respectively, for para-aortic lymph node metastasis, similarly to uterine cervical cancer.3)
However, histological examination and follow-up are necessary for the definitive diagnosis, and lymph node dissection
must not be omitted on the basis of negative PET findings. PET has sensitivity and specificity of 92-96 and 81-100%
for the recurrent of uterine cervical cancer1,4-6) and 96-100 and 78-88%, for the recurrence of uterine body cancer,
respectively, and shows satisfactory precision for both disorders.7-9) A case of recurrence of uterine cervical cancer is
presented in the figure.
The ovary shows physiologic FDG uptake as does the endometrium, and benign tumors may also show uptake. The
sensitivity and specificity of PET for the detection of ovarian cancer have been reported to be 52-58 and 76-78%,
respectively,10,11) so the modality is not recommended for the initial diagnosis or differential diagnosis. 12) Reports on
the preoperative staging are limited, but the sensitivity and specificity of PET (PET/CT) for lymph node or peritoneal
metastasis have been reported to be 62 and 97% in intrapelvic lesions and 75 and 98%, in extrapelvic lesions,13)
respectively being superior to those of CT alone. According to a multicenter study,the sensitivity and specificity of PET
for the diagnosis of recurrent ovarian cancer were 90-96 and 80-88%,1,14) respectively, when it was clinically suspected
from elevation of tumor marker levels and findings on other imaging modalities, similarly to recurrent uterine cancer,
and PET affected the determination of the therapeutic approach in 60% of the patients.15)
On the basis of the above observations, the NCCN Guidelines 2008 concerning uterine and ovarian neoplasms
described PET as a modality that should be considered when metastatic foci cannot be detected by conventional
diagnostic imaging despite suspicion of recurrence due to clinical signs such as elevated tumor marker levels after the
initial treatment or when a definitive diagnosis of recurrence is difficult.
Since metabolic changes of tumoral lesions after chemotherapy or radiation therapy precede morphological changes,
i.e., changes in size, PET, which provides information about not only morphology but also metabolism, is expected to
contribute to the evaluation of the therapeutic effect. However, various changes that lesions undergo after treatment,
such as inflammatory change, or the appropriate timing of examination after treatment have not been adequately
assessed. PET is still in the stage of clinical research, and the evidence that the modality should be performed clinically
on a routine basis is deficient. As of spring, 2012, PET for the assessment of the therapeutic effect on gynecological
tumors is not covered by the national medical insurance system.
19
The Japanese imaging guideline 2013
6. Gynecology
A
B
C
D
Figure: Postoperative recurrence of uterine cervical cancer
Transverse T2-weighted MRI (A) and transverse PET/CT images (B, C, D). Chemotherapy was performed for
recurrence at the surgical site (A → ). On MRI, no change was observed in size, but PET/CT showed marked uptake
at the site of recurrence (B → ), and the lesion was still considered viable. A new focus of recurrence (C → ) and
multiple liver metastases (D ▲ ) were also identified, and the disease activity was comprehensively evaluated to have
worsened.
Reports on the diagnosis of gynecological tumors other than uterine and ovarian cancers by PET are limited to those of
the case series study level, but its diagnostic precision for lymph node metastasis before treatment and recurrence after
treatment has been reported to be comparable to that in uterine and ovarian cancer.16-18) Therefore, the modality may also
have similar usefulness in other gynecological tumors.
Index words and secondary materials used as references
A search of PubMed was performed using “FDG”, “gynecology”, “cervical cancer”, “endometrial cancer”, and “ovarian
cancer” as key words. Cervical Cancer Ver. 1, 2012 and Uterine Neoplasms Ver. 2, 2012, Ovarian Cancer Ver.2, 2012 of
the National Comprehensive Cancer Network Guidelines were also used as references.
References
1) Havrilesky LJ et al: FDG-PET for management of cervical and ovarian cancer. Gynecol Oncol 97: 183-191, 2005 (Level 2)
2) Signorelli M et al: Preoperative staging of cervical cancer: is 18-FDG-PET/CT really effective in patients with early stage disease? Gynecol
Oncol 123: 236-240, 2011 (Level 4)
3) Chao A et al: 18F-FDG PET in the management of endometrial cancer. Eur J Nucl Med Mol Imaging 33: 36-44, 2006 (Level 3)
4) Sironi S et al: Post-therapy surveillance of patients with uterine cancers: value of integrated FDG PET/CT in the detection of recurrence. Eur J
Nucl Med Mol Imaging 34: 472-479, 2007 (Level 4)
5) van der Veldt AA et al: Clarifying the diagnosis of clinically suspected recurrence of cervical cancer: impact of 18F-FDG PET. J Nucl Med 49:
1936-1943, 2008 (Level 4)
6) Brooks RA et al: Surveillance FDG-PET detection of asymptomatic recurrences in patients with cervical cancer. Gynecol Oncol 112: 104-109,
2009 (Level 4)
7) Nakamoto Y et al: Positron emission tomography application for gynecologic tumors. Int J Gynecol Cancer 15: 701-709, 2005 (Level 3)
20
The Japanese imaging guideline 2013
C Q 11 6
8) Belhocine T et al: Usefulness of (18) F-FDG PET in the post-therapy surveillance of endometrial carcinoma. Eur J Nucl Med Mol Imaging 29:
1132-1139, 2002 (Level 4)
9) Saga T et al: Clinical value of FDG-PET in the follow up of post-operative patients with endometrial cancer. Ann Nucl Med 17: 197-203, 2003
(Level 4)
10) Rieber A et al: Preoperative diagnosis of ovarian tumors with MR imaging: comparison with transvaginal sonography, positron emission
tomography, and histologic findings. AJR 177: 123-129, 2001 (Level 3)
11) Fenchel S et al: Asymptomatic adnexal masses: correlation of FDG PET and histopathologic findings. Radiology 223: 780-788, 2002 (Level 3)
12) Iyer VR et al: MRI, CT, and PET/CT for ovarian cancer detection and adnexal lesion characterization. AJR 194: 311-321, 2010 (Level 3)
13) Kitajima K et al: Diagnostic accuracy of integrated FDG-PET/contrast-enhanced CT in staging ovarian cancer: comparison with enhanced CT.
Eur J Nucl Med Mol Imaging 35: 1912-1920, 2008 (Level 4)
14) Gu P et al: CA 125, PET alone, PET-CT, CT and MRI in diagnosing recurrent ovarian carcinoma: a systematic review and meta-analysis. Eur
J Radiol 71: 164-174, 2009 (Level 1)
15) Fulham MJ et al: The impact of PET-CT in suspected recurrent ovarian cancer: a prospective multi-centre study as part of the Australian PET
Data Collection Project. Gynecol Oncol 112: 462-468, 2009 (Level 1)
16) Cohn DE et al: Prospective evaluation of positron emission tomography for the detection of groin node metastases from vulvar cancer.
Gynecol Oncol 85: 179-184, 2002 (Level 2)
17) Lamoreaux WT et al: FDG-PET evaluation of vaginal carcinoma. Int J Radiat Oncol Biol Phys 62: 733-737, 2005 (Level 4)
18) Jadvar H et al: 18F-fluorodeoxyglucose positron emission tomography and positron emission tomography: computed tomography in recurrent
and metastatic cholangiocarcinoma. J Comput Assist Tomogr 31: 223-228, 2007 (Level 4)7) Nakamoto Y et al: Positron emission tomography
application for gynecologic tumors. Int J Gynecol Cancer 15: 701-709, 2005 (Level 3)
21
The Japanese imaging guideline 2013
6. Gynecology
117
Is periodic imaging need for the follow-up of
gynecological malignancies?
Recommendation
grade
C1
There are still unsolved problems related to imaging indications and frequency
of examination, versatility, cost-performance, and radiation exposure. While the
usefulness of PET/CT for the diagnosis of recurrent gynecological malignancies has
been established,Abdominopelvic contrast-enhanced CT may be considered as an
alternative.
Background/objective
Concerning the post-treatment follow-up of gynecological malignancies, the interval and examination protocols are
addressed in the guidelines of the Japan Society of Gynecologic Oncology. It is recommended to perform CT every 6-12
months for ovarian cancer (grade C1), 1-2 times/year for uterine body cancer (grade C1), and plain chest radiography
and other imaging examinations when appropriate for uterine cervical cancer (grade C1). However, guidelines
concerning uterine cervical cancer also present the opinion that all diagnostic imaging should be performed when
recurrence is suspected and is inappropriate as a routine examination. In consideration of these circumstances and the
recent widespread use of PET equipment, imaging modalities appropriate for post-treatment follow-up were evaluated.
Comments
For the post-treatment follow-up of gynecological malignancies, various imaging modalities, particularly contrastenhanced CT, are performed in addition to pelvic examination, measurement of tumor markers, and vaginal cytology.
For the early detection of recurrence of ovarian cancer, the ability of PET/CT has recently come close to that of
tumor marker (CA125) examination.1,2) As for imaging modalities, MRI has been reported to be more useful3) or
equally useful4,5) compared with contrast-enhanced CT for the diagnosis of local recurrence, but the results of PET/CT
surpasses those of contrast-enhanced CT or MRI in detecting recurrence in general (Figure).1,2,6-8) In comparison with
tumor markers, Rettenmaier et al. observed that routine imaging (abdominopelvic CT and plain chest radiography) is
more sensitive than CA125 but that CA125 is superior in cost-performance.9) According to the ACR Appropriateness
Criteria, which show the exposure dose as a reference for conducting imaging examinations, abdominopelvic contrastenhanced CT is recommend but while routine chest CT is not. In Japan, the incidence of serous adenocarcinoma,
which often shows an elevation in CA125, is lower than in Western countries, and PET/CT can only be performed in
limited facilities. Under these circumstances, it is reasonable to perform PET/CT, if necessary and possible, by taking
the histological type of the primary lesion and postoperative stage, tumor marker level, cost-performance, and risk of
exposure into consideration and to select abdominopelvic contrast-enhanced CT as second line.
In uterine body cancer, also, the superiority of PET/CT has been laregly established.10) According to the ACR
Appropriateness Criteria, MRI rather than CT is recommended when PET is not available, probably from the viewpoint
of reducing radiation exposure, but the evaluation of the diagnostic ability and cost-performance appears insufficient. In
Japan, contrast-enhanced CT is considered a practical choice.
In uterine cervical cancer, the tumor marker SCC is useful for the follow-up in addition to the above-mentioned pelvic
examination and vaginal cytology, but there is a report that the addition of conventional contrast-enhanced CT or plain
chest radiography to these modalities does not contribute to the early detection of recurrence and that its significance
is questionable.11) Here again, PET/CT has recently been reported to be useful for the early detection of asymptomatic
recurrence and distant metastasis.12,13) Therefore, there seems to be some significance in carrying out PET/CT although
its probable usefulness is lower than in ovarian or endometrial cancer. Also, while MRI is in wide routine clinical use
for the follow-up of patients after uterus-preserving surgery, but its utility has not been sufficiently validated.
Index words and secondary materials used as references
A search of PubMed was performed using “CT”, “MRI”, “PET”, “uterine cervical carcinoma”, “endometrial
carcinoma”, “ovarian carcinoma”, “recurrence”, “follow up”, and “after treatment” as key words. Guidelines of the
Japan Society of Gynecologic Oncology (Treatment Guidelines for Cervical Cancer 2011, Treatment Guidelines for
Uterine Body Cancer 2009, and Treatment Guidelines for Ovarian Cancer 2010), ACR Appropriateness Criteria® (Staging
and follow-up of ovarian cancer, pretreatment evaluation and follow-up of endometrial cancer of the uterus), and ESUR
guidelines: ovarian cancer staging and follow up were also used as references.
22
The Japanese imaging guideline 2013
C Q 11 7
B
Figure: Ovarian cancer (poorly differentiated
serous carcinoma) 8 years after radical surgery
A
A diagnosis of para-aortic lymph node metastasis was
made by PET/CT performed for periodic follow-up
because of the lack of an effective tumor marker (A:
PET coronal view, B: PET/CT, → ). After chemotherapy,
lymphadenectomy was performed and the lesion confirmed
to be metastasis of ovarian cancer.
References
1) Gu P et al: CA 125, PET alone, PET-CT, CT and MRI in diagnosing recurrent ovarian carcinoma: a systematic review and meta-analysis. Eur J
Radiol 71: 164-174, 2009 (Level 1)
2) Garcia-Velloso MJ et al: Diagnostic accuracy of FDG PET in the follow-up of platinum-sensitive epithelial ovarian carcinoma. Eur J Nucl Med
Mol Imaging 34: 1396-1405, 2007 (Level 3)
3) Kim CK et al: Detection of recurrent ovarian cancer at MRI: comparison with integrated PET/CT. J Comput Assist Tomogr 31: 868-875, 2007
(Level 2)
4) Sala E et al: Recurrent ovarian cancer: use of contrast-enhanced CT and PET/CT to accurately localize tumor recurrence and to predict
patients’ survival. Radiology 257: 125-134, 2010 (Level 2)
5) Nasu K et al: Impact of positron emission tomography/computed tomography in the management of patients with epithelial ovarian carcinoma
after treatment. Arch Gynecol Obstet 283: 1121-1126, 2011 (Level 4)
6) Fulham MJ et al: The impact of PET-CT in suspected recurrent ovarian cancer: a prospective multi-centre study as part of the Australian PET
Data Collection Project. Gynecol Oncol 112: 462-468, 2009 (Level 1)
7) Sebastian S et al: PET-CT vs. CT alone in ovarian cancer recurrence. Abdom Imaging 33: 112-118, 2008 (Level 2)
8) Soussan M et al: Impact of FDG PET-CT imaging on the decision making in the biologic suspicion of ovarian carcinoma recurrence. Gynecol
Oncol 108: 160-165, 2008 (Level 4)
9) Rettenmaier NB et al: The utility and cost of routine follow-up procedures in the surveillance of ovarian and primary peritoneal carcinoma: a
16-year institutional review. Br J Cancer 103: 1657-1662, 2010 (Level 2)
10) Ozcan Kara P et al: The value of FDG-PET/CT in the post-treatment evaluation of endometrial carcinoma: a comparison of PET/CT findings
with conventional imaging and CA 125 as a tumour marker. Rev Esp Med Nucl Imagen Mol 31: 257-260, 2012 (Level 2)
11) Elit L et al: Follow-up for women after treatment for cervical cancer: a systematic review. Gynecol Oncol 114: 528-535, 2009 (Level 1)
12) Pallardy A et al: Clinical and survival impact of FDG PET in patients with suspicion of recurrent cervical carcinoma. Eur J Nucl Med Mol
Imaging 37: 1270-1278, 2010 (Level 2)
13) Cetina L et al: F18-FDG-PET/CT in the evaluation of patients with suspected recurrent or persistent locally advanced cervical carcinoma. Rev
Invest Clin 63: 227-235, 2011 (Level 4)
23
The Japanese imaging guideline 2013
6. Gynecology
118
Which imaging modality is appropriate for imaging of
acute abdomen in pregnant women?
Recommendation
grade
B
C1
B Ultrasonography
C1 Non-contrast MRI, CT
For evaluation acute abdomen in pregnant women, ultrasonography should be
performed first.
If the diagnosis is difficult by ultrasonography, non-contrast MRI is recommended.
If the diagnosis is difficult even by non-contrast MRI, or if MRI cannot be performed,
CT may be considered.
Contrast-enhanced imaging is acceptable, if necessary.
Background/objective
Appendicitis is the most frequent cause of acute abdomen during pregnancy, and the diagnosis often depends on
imaging. In pregnant women, early diagnosis and treatment are necessary, because abortion or premature delivery and
maternal sepsis increase with the occurrence of appendiceal perforation or panperitonitis.1)
Without a doubt, ultrasonography is the first choice imaging modality for acute abdomen in pregnant women. However,
if a definitive diagnosis cannot be made, there is no consensus as to which of MRI and CT should be selected as the next
modality. In Japan, this judgment is often left to the clinical staff.
Comments
Regarding the diagnostic performance of ultrasonography for appendicitis, which is the most frequent acute abdomen
in pregnant women, the diagnosis was impossible in 88 (29/33), 96 (44/46), and 92% (11/12) of the patients, because
the appendix could not be identified.2) Also, as a result of a prospective cohort study, Butala et al. reported that
the sensitivity/specificity of ultrasonography in the 1st, 2nd, and 3rd trimesters were 40/100, 33/100, and 0/100%,
respectively.3) Therefore, the diagnosis of acute abdomen other than appendicitis is also expected to be often difficult in
pregnant women, and this tendency is more notable in late pregnancy, in which the uterus is enlarged.
The safety of MRI in early pregnancy has not been established, but there is presently no evidence that suggests it
is unsafet,4) and its use in consideration of the period of pregnancy is recommended. The Guidelines for Diagnostic
Imaging, 20035) of the Japan College of Radiology state that the long-term safety of MRI has not been sufficiently
established and that careful evaluation of indications and avoidance of its application in the organogenic period (within
15 weeks) are necessary. According to the American College of Radiology (ACR), MRI can be performed in all periods
including the 1st trimester.6) Therefore, there seems to be little controversy over the safety of the use of MRI for the
diagnosis of acute abdomen in the 2nd trimester and thereafter, if diagnosis by ultrasonography is not possible.
MRI has been reported to be useful for the determination of the cause of acute abdomen in pregnant women in many
diseases, allowing the diagnosis of gastrointestinal (inflammatory bowel diseases, diverticulitis, ileus), hepatobiliary
(gallstones, choledocholithiasis, acute cholecystitis, pancreatitis, HELLP syndrome, and acute fatty liver), urinary
(physiologic hydronephrosis, urolithiasis), vascular (venous thrombosis), and gynecological (uterine myoma, ovarian
mass and torsion) diseases as well as acute appendicitis.7) While reports on the diagnosis of appendicitis by MRI are
limited, it shows a high diagnostic ability with sensitivity and specificity of 90.5 and 98.6%, respectively, according to
the meta-analysis by Blumenfeld et al.8)
In Japan, however, CT is considered acceptable due to the limited availability of MRI in emergency situations.
According to a questionnaire survey of radiology departments of general hospitals in the United States (85 respondents),
63 (74%) facilities had clear statements about principles of imaging diagnosis in pregnant women, and the percentage
of preferential use of MRI/CT for the diagnosis of appendicitis was reported to be 39/32, 38/48, and 29/58% in the 1st,
2nd, and 3rd trimesters, respectively.9) A tendency to choose MRI in early pregnancy and CT in late pregnancy is observed.
As mentioned in the Guidelines for obstetrical practice in Japan (Obstetrics edition 2011),10) radiation exposure at less
than 50 mGy from 11 days after insemination to the 10th week of pregnancy does not increase the incidence of fetal
anomalies. Exposure from the 10th-27th week of pregnancy may theoretically cause impairment of the central nervous
system, but no effect has actually been documented at less than 100 mGy. In the diagnosis of acute abdomen, the
radiation exposure does not exceed 50 mGy on a single series of abdominal CT with technical modifications including
avoidance of multiple scans. Therefore, CT is an alternative if the benefit is judged to be greater than the risk after
careful evaluation of the period of pregnancy and radiation dose (Figure).
There has been no report evaluating the appropriateness of the use of a contrast agent in the diagnosis of acute
abdomen during pregnancy. According to the United States Food and Drug Administration, intravenous iodine-based
24
The Japanese imaging guideline 2013
C Q 11 8
A
B
Figure: Strangulated ileus in a pregnant woman (seventeenth week of
pregnancy) Contrast-enhanced CT (coronal MPR images)
The small bowel forms a closed loop ( → ), and the wall of this segment is
thickened and enhanced faintly compared with the surrounding intestine.
Surgery was performed with a diagnosis of strangulated ileus, and partial
resection was performed.
contrast agents are classified in pregnancy as category B (a risk has not been demonstrated by animal reproduction
studies or in pregnant women) and are more preferable to use in pregnant women than gadolinium-based contrast agents
for MRI (category C: The use in pregnant women may be warranted despite potential risks).9) There has been a report
that a single dose of a iodine-based contrast agent to a pregnant woman is unlikely to exert a significant effect on the
fetal thyroid function,11) but thyroid function screening of neonates 1 week after birth is recommended. Therefore, CT
may be considered if the diagnosis is difficult by ultrasonography or non-contrast MRI, or if MRI cannot be performed,
and, for this purpose, CT may be performed with contrast enhancement, if necessary. If contrast-enhanced CT is clearly
considered to have a higher diagnostic ability, it is recommended to perform contrast-enhanced CT alone by omitting
non-contrast CT to reduce the exposure dose. Further reductions in exposure may be possible in the future through the
development and application of novel CT technology such as low-dose CT using iterative processing and virtual noncontrast CT based on dual energy CT.
Index words and secondary materials used as references
A search of PubMed was performed using “acute abdominal pain”, “US”, “MRI”, “CT”, and “pregnancy” as key
words.
References
1) Essential Knowledge for Gynecological Training 2011. Japan Society of Obstetrics and Gynecology, p273 (Level 5)
2) Long SS et al: Imaging strategies for right lower quadrant pain in pregnancy. AJR 196: 4-12, 2011 (Level 3)
3) Butala P et al: Surgical management of acute right lower-quadrant pain in pregnancy: a prospective cohort study. J Am Coll Surg 211: 490494, 2010 (Level 4)
4) Greenhalgh R et al: Is MRI routinely indicated in pregnant patients with suspected appendicitis after equivocal ultrasound examination? Abdom
Imaging 33: 21-25, 2008 (Level 1)
5) Japan College of Radiology: Guidelines for Diagnostic Imaging 2003, p197 (Level 5)
6) Kanal E et al: ACR guidance document for safe MR practices: 2007. AJR 188: 1447-1474, 2007 (Level 5)
7) Spalluto LB et al: MR imaging evaluation of abdominal pain during pregnancy: appendicitis and other nonobstetric causes. Radiographics 32:
317-334, 2012 (Level 5)
8) Blumenfeld YJ et al: MR imaging in cases of antenatal suspected appendicitis: a meta-analysis. J Matern Fetal Neonatal Med 24: 485-488,
2011 (Level 1)
9) Jaffe TA et al: Practice patterns in imaging of the pregnant patient with abdominal pain: a survey of academic centers. AJR 189: 1128-1134,
2007 (Level 4)
10) Guidelines for obstetrical practice in Japan 2011 edition. Japan Society of Obstetrics and Gynecology/Japan Association of Obstetricians and
Gynecologists, p44 (Level 5)
11) Bourjeily G et al: Neonatal thyroid function: effect of a single exposure to iodinated contrast medium in utero. Radiology 256: 744-750, 2010
(Level 4)
25
The Japanese imaging guideline 2013
07
Urinary system
1
The Japanese imaging guideline 2013
7. Urinary system
119
Is CT appropriate for immediate examination in adults
suspected to have acute pyelonephritis?
Recommendation
grade
C2
It is not recommended to immediately perform non-contrast or contrast-enhanced CT
in adults with uncomplicated acute pyelonephritis.
Background/objective
Adult urinary tract infection is often restricted to the lower urinary tract and can be diagnosed on the basis of clinical
symptoms and laboratory data. If inflammation has, or is suspected to have, spread to the kidneys (acute pyelonephritis),
non-contrast or contrast-enhanced CT is indicated for the diagnosis and determination of the therapeutic strategy.
However, performing CT in all patients is not reasonable from the viewpoints of radiation exposure and medical
economy. Which patients, then, should undergo CT?
Comments
It is often easy to clinically diagnose acute pyelonephritis in patients without complicating factors such as diabetes,
and appropriate antibiotic treatment usually leads to satisfactory resolution (complicated pyelonephritis is discussed
in CQ120). Lim et al. evaluated the correlation between CT findings and clinical and laboratory data by dividing 130
adults with acute pyelonephritis or renal abscess who underwent contrast-enhanced CT into 3 groups: Mild acute
pyelonephritis, severe acute pyelonephritis, and renal abscess.1) In the patients placed into the mild acute pyelonephritis
group on the basis of CT findings, the mean duration of fever was reportedly 2.2 days, which was shorter than in
the severe acute pyelonephritis (3.4 days) or renal abscess (5.4 days) group. Huang et al. divided patients with acute
pyelonephritis into 3 groups (I-III) according to contrast-enhanced CT findings and compared clinical characteristics
and outcome. Group I with mild CT findings promptly responded to antibiotic therapy and showed a mean duration of
fever of 2.9 days, which was significantly shorter than in Groups II or III.2) Ha et al. and June et al. also reported that the
mean duration of fever was 1.7-3.1 days in patients with no findings on contrast-enhanced CT and those with mild acute
pyelonephritis.3,4) All these were retrospective studies, but the duration of fever was about 3 days in many patients with
pyelonephritis showing mild CT findings (Figure).
According to the American College of Radiology (ACR) guidelines, CT is unnecessary in patients with uncomplicated
acute pyelonephritis if they respond satisfactorily to antibiotic therapy, and non-contrast and contrast-enhanced CT are
indicated when a satisfactory response is not observed within 72 hours.
Figure: Acute pyelonephritis
In this abdominal contrast-enhanced CT image, wedge-shaped and cord-like
areas of poor contrast enhancement ( → ) are observed in the left and right
kidneys, respectively.
2
The Japanese imaging guideline 2013
C Q 11 9
The European Association of Urology (EAU) guidelines also recommend to perform non-contrast CT to exclude
conditions such as renal and perinephric abscesses if patients with uncomplicated acute pyelonephritis exhibit fever
persisting for 72 hours or longer after the initiation of treatment.
Adults showing poor response to treatment and those who have complications and are suspected to have acute
pyelonephritis are discussed in CQ120.
Index words and secondary materials used as references
A search of PubMed was performed using “acute pyelonephritis” and “CT” as key words. The ACR guidelines 2008
and EAU guidelines 2009 were also used as references.
References
1) Lim SK et al: Acute pyelonephritis and renal abscesses in adults-correlating clinical parameters with radiological (computer tomography) severity. Ann Acad Med Singap 40: 407-413, 2011 (Level 2)
2) Huang JJ et al: Acute bacterial nephritis: a clinicoradiologic correlation based on computed tomography. Am J Med 93: 289-298, 1992 (Level
4)
3) Ha SK et al: Acute pyelonephritis focusing on perfusion defects on contrast enhanced computerized tomography (CT) scans and its clinical
outcome. Korean J Intern Med 12: 122-127, 1997 (Level 4)
4) June CH et al: Ultrasonography and computed tomography in severe urinary tract infection. Arch Intern Med 145: 841-845, 1985 (Level 2)
3
The Japanese imaging guideline 2013
7. Urinary system
120
Is CT appropriate when patients suspected to
have acute pyelonephritis show poor response to
treatment?
Recommendation
grade
C1
Contrast-enhanced CT may be considered in patients without renal dysfunction.
Background/objective
Uncomplicated acute pyelonephritis often responds promptly to antibiotic therapy. However, if the initiation of
treatment is delayed, or if the patient is compromised or immunosuppressed such as diabetes, the disease may develop
into renal or perinephric abscess. Drainage or surgery may be necessary for the management of renal or perinephric
abscess, and non-contrast or contrast-enhanced CT is indicated for the diagnosis and determination of the therapeutic
strategy. How should indications of CT be evaluated from the disease history, clinical symptoms, and laboratory data?
Comments
There have been a few studies attempting to predict renal abscess and severe pyelonephritis from clinical and
laboratory data. Lim et al. divided 130 adult patients with acute pyelonephritis or renal abscess who underwent contrastenhanced CT into 3 groups according to CT findings, i.e., mild acute pyelonephritis, severe acute pyelonephritis, and
renal abscess, and evaluated their correlations with clinical and laboratory data.1) As a result, they reported that CT
findings were correlated with clinical and laboratory data and that multivariate analysis identified diabetes, hypotension,
acute renal failure or a leukocytosis of 20,000 or higher as significant risk factors of renal abscess. Most (97.9%) of the
patients who showed severe pyelonephritis or renal abscess on CT had diabetes, hypotension, acute renal failure, or
a leukocytosis 20,000 or higher. They also reported that since the remaining patients exhibited fever persisting for 72
hours or longer after the initiation of treatment, all patients with severe pyelonephritis or renal abscess can be identified
by CT according to the European Association of Urology (EAU) guidelines.
The EAU guidelines recommend consideration of non-contrast CT to exclude renal and perinephric abscesses in
patients with uncomplicated acute pyelonephritis showing fever persisting for 72 hours after the initiation of treatment.
Huang et al. reported that close correlations were observed between 3 subgroups of acute pyelonephritis based on
contrast-enhanced CT findings and the clinical severity.2) Significant differences were observed in the duration of fever,
lateral abdominal pain, leukocytosis, and duration of pyuria, and, in the group with CT findings indicating severe
pyelonephritis, septic shock, diabetic ketoacidosis, and acute renal failure were observed more frequently. While
these studies were all retrospective, they showed association of renal abscess or severe pyelonephritis with diabetes,
hypotension, and acute renal failure. Also, non-contrast CT is useful for the evaluation of gas, stones, and hemorrhage
in the urinary tract, kidney enlargement, inflammatory masses, hydronephrosis, and stranding of perirenal fat tissue.3)
However, these findings are often absent, and, in many instances, image findings suggestive of acute pyelonephritis are
obtained by contrast-enhanced CT alone.3) The addition of contrast-enhanced CT is desirable if the patients have no
Figure: Perinephric abscess
Abdominal contrast-enhanced CT shows a mass with hypodense
interior and a contrast enhanced margin ( → ) from the lower pole of
the right kidney to the perinephric region.
4
The Japanese imaging guideline 2013
CQ 120
contraindication of contrast medium such as renal dysfunction (Figure).
The American College of Radiology (ACR) guidelines recommend the evaluation using non-contrast and contrastenhanced CT within 24 hours if diabetic or other immunocompromised patients respond poorly to treatment. The
guidelines also consider CT to be worth performing in patients with a history of urological diseases such as urolithiasis,
history of surgery for urological diseases, and episodes of recurrent pyelonephritis.
Index words and secondary materials used as references
A search of PubMed was performed using “acute pyelonephritis” and “CT” as key words. The ACR guidelines 2008
and EAU guidelines 2009 were also used as references.
References
1) Lim SK et al: Acute pyelonephritis and renal abscesses in adults-correlating clinical parameters with radiological (computer tomography) severity. Ann Acad Med Singap 40: 407-413, 2011 (Level 2)
2) Huang JJ et al: Acute bacterial nephritis: a clinicoradiologic correlation based on computed tomography. Am J Med 93: 289-298, 1992 (Level
3)
3) Craig WD et al: Pyelonephritis: Radiologic-Pathologic Review. Radiographics 28: 255-276, 2008 (Level 5)
5
The Japanese imaging guideline 2013
7. Urinary system
121
Is CT appropriate for abdominal pain due to
urolithiasis?
Recommendation
grade
A
Abdominal non-contrast CT is strongly recommended as there is evidence that it
is useful for the diagnosis of not only lithiasis but also abdominal pain due to other
causes.
Background/objective
While abdominal pain (colic) is frequently observed in urolithiasis, causes of abdominal pain vary widely from
urological to internal, surgical, and gynecological disorders, and prompt and accurate imaging diagnosis is required.
Whether or not CT is useful when abdominal pain is suspected to be caused by urolithiasis was evaluated.
Comments
According to the Japanese Clinical Practice Guidelines for Urolithiasis revised edition (2005), plain radiography of
the kidney-ureter-bladder region (KUB) and ultrasonography (US) are recommended as the initial examination for
urolithiasis. Concerning the diagnostic performance for urolithiasis in patients with colic, the sensitivity and specificity
by KUB alone are 54-64 and 67%,1,2) and those by US alone are 24-29.6 and 90-100%, respectively,3,4) but they
improved to 79-96 and 91-100%, respectively, when they are combined,2) possibly with shortening of the time required
for US and an improvement in diagnostic performance.5) There is also a report that urinary tract obstruction by kidney
stones could be diagnosed with a sensitivity of 80% in pregnant patients by Doppler ultrasonography using the resistive
index (RI) of the renal artery and that obstruction could be diagnosed even without hydronephrosis.6)
Also, the sensitivity and specificity of excretory urography (intravenous pyelography or urography; IVP, IVU), which
has been one of the important examinations of the upper urinary tract, have been reported to be 59.1-72.5 and 90-100%,
respectively, for urolithiasis,1,7,8) but the frequency of its application is decreasing due to the recent propagation of CT
and CT urography (CTU). As for comparison between non-contrast CT and IVP, the sensitivity and specificity of noncontrast CT are extremely high at 91-100 and 91-100%, respectively,1-3,7,8) and non-contrast CT has been reported to
be useful by many authors. In patients with asymptomatic hematuria, it has been reported that there was no significant
difference between CTU and IVU for detecting stones and other significant abnormalities of the urinary tract such as
tumor, CTU was slightly superior to IVU.9) There is also a report that CT is more time- and cost-effective, including
indirect cost on examination time and adverse effects than IVP,10) because it is useful for the diagnosis of abdominal
disorders other than urolithiasis7,10) While CT has been reported to be very useful by many authors, a randomized
controlled trial comparing non-contrast CT and IVP showed that CT is superior in the initial diagnosis of urolithiasis
but that there was no difference in the outcome, duration of hospitalization, or frequency of urological intervention.11)
Recently, as the radiation exposure during CT examination has attracted attention, it is necessary to consider the fact
that the exposure dose is 2-3 times higher by non-contrast CT than by IVP.10)
MRI is an examination with minimum risk of radiation exposure. For the evaluation of urolithiasis in patients with
colic, MRI urography (MRU) with heavily T2-weighted imaging shows a sensitivity of 53.8-57.2% and a specificity
of 100%, but the sensitivity and specificity of contrast-enhanced MRU using 3D FLASH are 96.2-100 and 100%,
respectively, so the addition also of contrast-enhanced MRU has been recommended.12) It has also been reported that
the diagnostic accuracy of a combination of non-contrast-enhanced MRU and KUB (94%) is comparable to that of noncontrast CT.13)
In order to reduce the radiation exposure on CT, high-pitch helical CT imaging14) and low-dose CT imaging. The
sensitivity and specificity are both 90% or higher even by low-tube current CT imaging at 30-76 mAs,15-18) but the
sensitivity tends to decrease (50-79%) for small stones 2 mm or less in diameter and in overweight patients with a BMI
exceeding 30.15,17) The sensitivity and specificity have been reported to be 97 and 95%, respectively, even by ultra-lowdose CT (20 mA) with a radiation exposure similar to that by plain radiography.19)
To summarize, when urolithiasis is suspected in patients with colic, it is recommended to perform abdominal noncontrast CT, which can be executed promptly and has a high diagnostic ability for not only urolithiasis but also other
disorders. However, the importance of urinalysis and non-invasive examinations such as KUB and US as the initial
examinations remains unchanged. While reports that CT is superior to these examinations are increasing, there have
also been reports that diagnostic performance comparable to that of non-contrast CT can be obtained by a combination
of US and KUB2,5) It is recommended to perform these less-invasive examinations for pregnant women and at facilities
unequipped with CT, and an easy choice of CT should be avoided. However, US is highly dependent on the examiner’s
skill, and the measurement of the RI is not very reproducible, restricting the ability of the modality. While MRI is free
of radiation exposure, the image quality shows wide variation among facilities, and the examination time tends to be
6
The Japanese imaging guideline 2013
CQ 121
longer than CT.
Low-dose CT to reduce the radiation exposure is expected to be a standard imaging technique in near future. The
compromised image quality, which limits the diagnostic ability, due to reduced radiation exposure compared with
standard-dose CT is being compensated for by the recent advances of image reconstruction techniques such as iterative
reconstruction.
Index words and secondary materials used as references
A search of PubMed was performed using “plain radiography”, “intravenous urography (IVU)”, “US”, “CT”, “MRI”,
“renal or ureteral colic”, “renal or ureteral stone”, and “hematuria” as key words. The ACR appropriateness criteria20)
were also used as a reference.
References
1) Niall O et al: A comparison of noncontrast computerized tomography with excretory urography in the assessment of acute flank pain. J Urol
161: 534-537, 1999 (Level 3)
2) Ripolles T et al: Suspected ureteral colic: plain film and sonography vs unenhanced helical CT. A prospective study in 66 patients. Eur Radiol
14: 129-136, 2004 (Level 3)
3) Rengifo AD et al: Diagnostic validity of helical CT compared to ultrasonography in renal-ureteral colic. Arch Esp Urol 63: 139-144, 2010 (Level
4)
4) Fowler KA et al: US for detecting renal calculi with nonenhanced CT as a reference standard. Radiology 222: 109-113, 2002 (Level 4)
5) Mitterberger M et al: Plain abdominal radiography with transabdominal native tissue harmonic imaging ultrasonography vs unenhanced computed tomography in renal colic. BJU Int 100: 887-890, 2007 (Level 4)
6) Elgamasy A et al: Use of Doppler ultrasonography and rigid ureteroscopy for managing symptomatic ureteric stones during pregnancy. BJU Int
106: 262-266, 2010 (Level 2)
7) Gray Sears CL et al: Prospective comparison of computerized tomography and excretory urography in the initial evaluation of asymptomatic
microhematuria. J Urol 168: 2457-2460, 2002 (Level 3)
8) Wang JH et al: Prospective comparison of unenhanced spiral computed tomography and intravenous urography in the evaluation of acute
renal colic. J Chin Med Assoc 71: 30-36, 2008 (Level 3)
9) O’Malley ME et al: Comparison of excretory phase, helical computed tomography with intravenous urography in patients with painless haematuria. Clin Radiol 58: 294-300, 2003 (Level 3)
10) Pfister SA et al: Unenhanced helical computed tomography vs intravenous urography in patients with acute flank pain: accuracy and economic
impact in a randomized prospective trial. Eur Radiol 13: 2513-2520, 2003 (Level 3)
11) Mendelson RM et al: Renal colic: a prospective evaluation of non-enhanced spiral CT versus intravenous pyelography. Australas Radiol 47:
22-28, 2003 (Level 3)
12) Sudah M et al: MR urography in evaluation of acute flank pain: T2-weighted sequences and gadolinium-enhanced three-dimensional FLASH
compared with urography. Fast low-angle shot. AJR 176: 105-112, 2001 (Level 3)
13) Regan F et al: Acute ureteric calculus obstruction: unenhanced spiral CT versus HASTE MR urography and abdominal radiograph. Br J Radiol
78: 506-511, 2005 (Level 4)
14) Liu W et al: Low-dose nonenhanced helical CT of renal colic: assessment of ureteric stone detection and measurement of effective dose
equivalent. Radiology 215: 51-54, 2000 (Level 3)
15) Kim BS et al: Low-dose and standard-dose unenhanced helical computed tomography for the assessment of acute renal colic: prospective
comparative study. Acta Radiol 46: 756-763, 2005 (Level 3)
16) Heneghan JP et al: Helical CT for nephrolithiasis and ureterolithiasis: comparison of conventional and reduced radiation-dose techniques.
Radiology 229: 575-580, 2003 (Level 3)
17) Poletti PA et al: Low-dose versus standard-dose CT protocol in patients with clinically suspected renal colic. AJR 188: 927-933, 2007 (Level 3)
18) Twahirwa N et al: Evaluation of suspected renal colic patients with unenhanced low-dose multi-detector computed tomography. East Afr Med J
86: 190-195, 2009 (Level 4)
19) Kluner C et al: Does ultra-low-dose CT with a radiation dose equivalent to that of KUB suffice to detect renal and ureteral calculi? J Comput
Assist Tomogr 30: 44-50, 2006 (Level 3)
20) Courtney AC et al: American college of radiology ACR appropriateness criteria-clinical condition: acute onset flank pain - suspicion of stone.
available at: disease. http://www.acr.org/SecondaryMainMenuCategories/quality_safety/app_criteria/pdf/ExpertPanelonUrologicImaging/
AcuteOnsetFlankpainSuspicionofStoneDiseaseDoc1.aspx Accessed 1 December 2011 (Level 2)
7
The Japanese imaging guideline 2013
7. Urinary system
122
Grade
A
Is contrast-enhanced CT appropriate for the
differentiation of benign and malignant cystic renal
masses?
The evaluation of the nephrographic phase using thin slices (≤5 mm) by a bolus
injection of a contrast agent is useful for the differentiation of benign and malignant
lesions and is strongly recommended.
Background/objective
Cystic renal masses are observed frequently in routine imaging examinations, and most of them are simple cysts. While
additional examination is unnecessary for patients in whom the definitive diagnosis is possible by ultrasonography,
non-contrast CT, or usual contrast-enhanced CT, cystic masses showing wall thickening or septa may include renal
cell carcinoma. The Bosniak classification is widely used as criteria prepared in consideration of the diagnosis of, and
determination of the therapeutic strategy for cystic masses. Its usefulness is evaluated.
Comments
In 1986, Bosniak reported a classification system for cystic renal masses based on CT findings.1) In consideration of
the therapeutic approach, Bosniak initially proposed 4 categories from I to IV. Categories I and II are benign cysts that
need no treatment, category III is cysts difficult to differentiate between benign and malignant by imaging examination
and is an indication for surgery, and category IV is malignant and should be treated surgically. Thus, categories I and
II can be left untreated, but categories III and IV require surgery, so the discrimination between categories II and III is
important. Various retrospective studies have been conducted, and Aronson et al. concluded that categories I and II were
non-malignant and that the Bosniak classification was useful, but Cloix et al. and Wilson et al. observed that malignant
lesions are often included in categories I and II and expressed negative views on the Bosniak classification.2-4) However,
these studies were carried out in a small number of patients (32 patients at most), and contrast enhancement could not
be evaluated in some patients because non-contrast CT was not performed. In addition, the slice thickness was large
at 10 mm in most patients. In subsequent reports such as those by Siegel et al. and Curry et al., the number of subjects
was 70 or higher and the slice thickness was 5 mm or 7 mm or less in many patients. According to their reports, the
percentage of malignant lesions in categories I and II combined was 3% (13% in category II, 0% in category I) and 0%,
respectively, and that in categories III and IV combined was 78 and 70%, respectively, results that sufficiently supported
the Bosniak classification.5,6) To accurately apply the Bosniak classification, it is essential to use a thin slice thickness (≤5
mm), to inject the contrast agent in bolus at 2-3 ml/s, and to evaluate the nephrographic phase.6) It is also necessary to
perform non-contrast CT to evaluate the presence or absence of contrast enhancement.
According to the conventional classification, categories I and IV could be diagnosed relatively easily, but the
discrimination between categories II and III, which is the most important, was difficult and the interobserver agreement
rate was low. Indeed, 16% of the patients judged to be category I or II were reportedly classified as category III or IV by
another observer.5) Therefore, Bosniak added category II F (F stands for follow-up) as an intermediate category between
II and III, and this 5-category classification is widely used at present (Table 1).7,8) Categories I and II should be left
untreated, category II F needs follow-up by imaging studies, and surgery is recommended for categories III and IV. In a
retrospective study using MDCT, the percentage of malignant lesions was 4% in category I or II, 25% in category II F,
81% in category III, and 87% in category IV,9) suggesting the usefulness of the new classification system. However, in
subsequent reports, the percentage of malignant lesions was 25% in category II F and 54% in category III,10) and there
was a discrepancy between the two reports in the percentage of malignant lesions in category III (Figure, Tables 1,2).
The follow-up of II F lesions showed increased complexity such as an increase in the septal thickness in 5%, and they
were reported to be malignant (mean follow-up period: 5.8 years).8) Moreover, there is a report that 13% of category II
F lesions advanced to category III (median period: 6 months) and that about half these lesions were malignant.10) From
these observations, the follow-up of category II F lesions is considered to be reasonable. Concerning the intervals of
follow-up examinations, it is recommended to perform the first follow-up after half a year and, if there is no change, to
continue the examination annually at least for 5 years.8)
Index words and secondary materials used as references
A search of PubMed was performed using “renal”, “cystic”, “tumor”, “CT”, and “Bosniak” as key words. In addition,
2 papers were cited to understand the contents.1,7) The American College of Radiology guidelines (Israel GM et al:
American College of Radiology ACR Appropriateness Criteria® Clinical Condition: Indeterminate Renal Masses.
8
The Japanese imaging guideline 2013
CQ 122
Figure: Bosniak categories III and II F
Contrast-enhanced CT Sagittal reconstructed image
(nephrographic phase)
The multilocular cystic mass at the lower pole has
thick and irregular septa ( ▲ ) and is category III.
However, the multilocular cystic mass in the upper
pole has slightly enhanced and somewhat thickened
septa ( → ) and is classified as category II F.
Table 1: Bosniak classification (cited with modifications from Reference #8)
Category I
A benign simple cyst with a hairline-thin wall that does not contain septa,
calcifications, or solid components. It measures water density and does not enhance with contrast material.
Category II
A benign cyst that may contain a few hairline-thin septa. Fine calcification or
a short segment of slightly thickened calcification may be present in the wall or septa. Uniformly high-attenuation lesions (< 3 cm) that are sharply
Category II F
marginated and do not enhance are included in this group.
These cysts may contain an increased number of hairline-thin septa. Minimal
enhancement of a hairline-thin smooth septum or wall can be seen, and there
may be minimal thickening of the septa or wall. The cyst may contain
calcification that may be thick and nodular, but no contrast enhancement is
present. There are no enhancing soft-tissue components. Totally intrarenal nonenhancing high-attenuation renal lesions that are 3 cm or larger are also
included in this category. These lesions are generally well marginated.
Category III
Category IV
These lesions are indeterminate cystic masses that have thickened irregular
walls or septa in which enhancement can be seen.
These lesions are clearly malignant cystic masses that not only have all the
characteristics of category III lesions, but also contain enhancing soft-tissue
components adjacent to but independent of the wall or septa.
9
The Japanese imaging guideline 2013
7. Urinary system
Table 2 Frequency of malignant lesions among cysts of various Bosniak categories
Four-category classification
I
Aronson et al
2)
II
III
IV
No. of patients
0/0
0/4
5/9 (56%)
7/7 (100%)
20
1/2 (50%)
1/7 (14%)
4/13 (31%)
8/10 (80% )
32
Wilson et al4)
0/7
4/5 (80%)
4/4 (100%)
6/6 (100%)
22
Siegel et al
0/22
1/8 (13%)
5/11 (45%)
26/29 (90%)
70
0/4
0/11
29/49 (59%)
18/18 (100%)
82
Cloix et al
3)
Curry et al
5)
6)
Five-category classification
Kim et al
9)
Smith et al
10)
I
II
IIF
III
0/30
2/25 (8%)
2/12 (17%)
22/27(81%)
-
-
4/16 (25%)
58/107 (54%)
IV
No. of patients
27/31(87%)
125
-
123
Note) In,10) category II F (69) and III (144) patients were selected and evaluated retrospectively.
Available at: http:/www.acr.org//media/ACR/Documents/AppCriteria/Diagnostic/IndeterminateRenalMasses.pdf) was
also used as a reference.
References
1) Bosniak MA: The current radiological approach to renal cysts. Radiology 158: 1-10, 1986 (Level 5)
2) Aronson S et al: Cystic renal masses: usefulness of the Bosniak classification. Urol Radiol 13: 83-90, 1991 (Level 3)
3) Cloix P et al: Surgical management of complex renal cysts: a series of 32 cases. J Urol 156: 28-30, 1996 (Level 3)
4) Wilson TE et al: Cystic renal masses: a reevaluation of the usefulness of the Bosniak classification system. Acad Radiol 3: 564-570, 1996
(Level 3)
5) Siegel CL et al: CT of cystic renal masses: analysis of diagnostic performance and interobserver variation. AJR 169: 813-818, 1997 (Level 2)
6) Curry NS et al: Cystic renal masses: accurate Bosniak classification requires adequate renal CT. AJR 175: 339-342, 2000 (Level 4)
7) Bosniak MA: Problems in the radiologic diagnosis of renal parenchymal tumors. Urol Clin North Am 20: 217-230, 1993 (Level 5)
8) Israel GM et al: Follow-up CT of moderately complex cystic lesion of the kidney (Bosniak category II F). AJR 181: 627-633, 2003 (Level 3)
9) Kim DY et al: Malignant renal cysts: diagnostic performance and strong predictors at MDCT. Acta Radiol 51: 590-598, 2010 (Level 3)
10) Smith AD et al: Bosniak category II F and III cystic renal lesions: outcomes and associations. Radiology 262: 152-160, 2012 (Level 4)
10
The Japanese imaging guideline 2013
CQ 123
123
Is contrast-enhanced CT appropriate for the
evaluation of solid renal masses?
Recommendation
grade
A
B
A Contrast-enhanced CT (judgment of whether or not a renal mass is solid)
B Dynamic CT (qualitative differentiation of solid renal masses)
Contrast-enhanced CT is strongly recommended for the judgment of whether or not a
renal mass is solid.
Dynamic CT is recommended, because clear cell renal cell carcinoma, which
accounts for 70-80% of renal cell carcinomas, can be identified and because a
homogeneous appearance suggests a benign entity not requiring surgery.
Background/objective
For the diagnosis of solid renal tumor, the lesion must first be confirmed a solid mass. Next, the discrimination of
whether the lesion is benign or malignant is made. Angiomyolipoma (AML) and renal cell carcinoma (RCC) are the
most important differential diagnoses in consideration of their frequency. If the lesion is malignant, it is also desirable to
provide information concerning the histological type. Recently, from the viewpoint of molecular targeted treatment, the
differentiation between clear cell RCC and other histological types is important. The usefulness of contrast-enhanced CT
for the definitive diagnosis of solid renal mass and differentiation between benign and malignant diseases is evaluated
below.
Comments
For the qualitative diagnosis of whether a renal mass is solid or cystic, it is important to perform contrast-enhanced as
well as non-contrast CT to examine enhancement characteristics. Formerly, the lesion was judged to be solid when the
CT value increased by 10 HU or more between before and after contrast enhancement,1) but, after the advent of helical
CT, contrast enhancement is considered definitive with an increase in the CT value of 20 HU or more in consideration of
the effect of pseudoenhancement.2) Also, while the qualitative diagnosis of masses 10 mm or less in diameter is difficult
at a slice thickness of 5 mm, the ability to qualitatively diagnose masses 5-10 mm in diameter is markedly improved
by the use of thin slices of about 3 mm.3) If a cyst is strongly suspected after non-contrast CT, usual contrast-enhanced
CT (nephrographic phase) suffices. However, if a solid mass is suspected, dynamic CT is recommended to discriminate
benign and malignant lesions.
For the discrimination of benign and malignant lesions, AML and RCC are the most important differential diagnoses.
AML can usually be diagnosed by the detection of fat density at non-contrast CT, which is more accurate than contrastenhanced CT for this purpose.4) The reported threshold of fat density at non-contrast CT has varied widely from -10 to
-40 HU, but the diagnostic ability for AML has recently been reported to be maximum at a threshold of -10 HU.4) On
the other hand, contrast-enhanced CT is useful for the diagnosis of solid tumors except for classic AML that contains fat
density. Particularly, the homogeneity and pattern of contrast enhancement at dynamic CT are useful.
First, lesions that show heterogeneous marked enhancement in the corticomedullary phase of dynamic CT can be
nearly identified as clear cell RCC, which confirms the malignancy (Figure 1).5-12) Generally, malignant lesions present
with heterogeneous contrast enhancement due to hemorrhage or necrosis. In contrast, lesions that are homogeneous
at dynamic CT are often benign. For example, AML with minimal fat (Fat poor AML, hyperattenuating type) shows
a homogeneous appearance after contrast as it consists mostly of muscle components (Figure 2).13,14) This type of
AML accounts for about 5% of all AML and is characterized by hyperdensity (more than 45 HU) compared with the
renal parenchyma at non-contrast CT and hypointensity at T2-weighted MRI.13) Benign tumors such as leiomyoma,
metanephric adenoma, and small oncocytoma are also homogeneous on contrast enhanced imaging. Particularly, those
that are hyperdense at non-contrast CT and show homogeneous contrast enhancement (hyperattenuating homogeneously
enhancing masses) are likely to be benign.14) However, as malignant tumors such as papillary renal cell carcinoma may
also exhibit similar appearances, confirmation by biopsy is recommended.14)
There have been a number of reports that histological classification of RCC is also possible by dynamic CT. RCC has
3 major histological types: Clear cell type, chromophobe type, and papillary type. Although reports have varied in the
dose or infusion rate of the contrast agent, scanning timing, and number of scans, clear cell RCC shows heterogeneous
marked enhancement in the corticomedullary phase (about 30 seconds after the beginning of the contrast agent
administration) and show fading in the nephrographic (after about 80-100 seconds) and early excretory (after about
180-300 seconds) phases.5-12) In chromophobe RCC, homogeneous moderate contrast enhancement is observed in the
corticomedullary phase, but it diminishes thereafter.5,6,9,12) Papillary RCC shows only slight contrast enhancement in
the corticomedullary phase and is usually gradually enhanced homogeneously to the early excretory phase. 5,7,9,11,12,15)
11
The Japanese imaging guideline 2013
7. Urinary system
Figure 1: Clear cell RCC Contrastenhanced CT (corticomedullary phase)
A mass that shows heterogeneous marked
enhancement is observed in the left kidney
( → ). The image is consistent with clear cell
RCC.
Figure 2: AML with minimal fat Contrastenhanced CT (nephrographic phase)
A homogeneous solid mass ( → ) is observed
in the left kidney. It was AML with minimal fat.
These differences in the enhancement pattern reflect angiogenesis of the tumor.5,16) Thus, these 3 major histological
types are distinguishable from one another. However, it is important to note that the imaging appearance of oncocytoma
resembles those of clear cell and chromophobe RCCs5,9-11,17,18) and that that of metanephric adenoma also resembles that
of papillary RCC.5)
Index words and secondary materials used as references
A search of PubMed was performed using “renal”, “tumor”, “CT”, “assessment”, “characteristics”, “differentiation”,
“pathologic correlation”, “renal cell carcinoma”, and “angiomyolipoma” as key words. The American College of
Radiology guidelines (Israel GM et al: American College of Radiology ACR Appropriateness Criteria® Clinical
Condition: Indeterminate Renal Masses. Available at: http://www.acr.org//media/ACR/Documents/AppCriteria/
Diagnostic/IndeterminateRenalMasses.pdf) was also used as a reference.
References
1) Bosniak MA: The small (less than or equal to 3.0 cm) renal parenchymal tumor: detection, diagnosis, and controversies. Radiology 179: 307317, 1991 (Level 5)
2) Curry NS: Small renal masses (lesions smaller than 3 cm): imaging evaluation and management. AJR 164: 355-362, 1995 (Level 5)
3) Jinzaki M et al: Evaluation of small (</=3 cm) renal masses with MDCT: benefits of thin overlapping reconstructions. AJR 183: 223-228, 2004
(Level 3)
4) Davenport MS et al: Diagnosis of renal angiomyolipoma with Hounsfield unit thresholds: effect of size of region of interest and nephrographic
phase imaging. Radiology 260: 158-165, 2011 (Level 3)
5) Jinzaki M et al: Double-phase helical CT of small renal parenchymal neoplasms: correlation with pathologic findings and tumor angiogenesis. J
Comput Assist Tomogr 24: 835-842, 2000 (Level 3)
6) Kim JK et al: Differentiation of subtypes of renal cell carcinoma on helical CT scans. AJR 178: 1499-1506, 2002 (Level 3)
7) Ruppert-Kohlmayr AJ et al: Differentiation of renal clear cell carcinoma and renal papillary carcinoma using quantitative CT enhancement
parameters. AJR 183: 1387-1391, 2004 (Level 4)
8) Sheir KZ et al: Differentiation of renal cell carcinoma subtypes by multislice computerized tomography. J Urol 174: 451-455, 2005 (Level 3)
9) Zhang J et al: Solid renal cortical tumors: differentiation with CT. Radiology 144: 494-504, 2007 (Level 2)
10) El-Esawy SS et al: Characterization of solid renal masses using 64-slice Multidetector CT scanner. Scientific World Journal 12: 441-448, 2009
(Level 3)
11) Alshumrani G et al: Small (<or=4 cm) cortical renal tumors: characterization with multidetector CT. Abdom Imaging 35: 488-493, 2010 (Level
4)
12) Shebel HM et al: Quantitative enhancement washout analysis of solid cortical renal masses using multidetector computed tomography. J
Comput Assist Tomogr 35: 337-342, 2011 (Level 3)
13) Jinzaki M et al: Angiomyolipoma: imaging findings in lesions with minimal fat. Radiology 205: 497-502, 1997 (Level 4)
12
The Japanese imaging guideline 2013
CQ 123
14) Silverman SG et al: Hyperattenuating renal masses: etiologies, pathogenesis, and imaging evaluation. Radiographics 27: 1131-1143, 2007
(Level 5)
15) Herts BR et al: Enhancement characteristics of papillary renal neoplasms revealed on triphasic helical CT of the kidneys. AJR 178: 367-372,
2002 (Level 2)
16) Wang JH et al: Dynamic CT evaluation of tumor vascularity in renal cell carcinoma. AJR 186: 1423-1430, 2006 (Level 3)
17) Choudhary S et al: Renal oncocytoma: CT features cannot reliably distinguish oncocytoma from other renal neoplasms. Clin Radiol 64: 517522, 2009 (Level 3)
18) Kondo T et al: Spoke-wheel-like enhancement as an important imaging finding of chromophobe cell renal carcinoma: a retrospective analysis
on computed tomography and magnetic resonance imaging studies. Int J Urol 11: 817-824, 2004 (Level 3)
13
The Japanese imaging guideline 2013
7. Urinary system
124
Which imaging modalities are appropriate for the
staging of renal cell carcinoma?
Recommendation
grade
A
C1
C2
A CT
C1 MRI, PET
C2 Bone scintigraphy
CT is strongly recommended. However, complete evaluation of invasion to perirenal
fat or lymph node metastasis is impossible. MRI may be considered when contrastenhanced CT cannot be performed or when the evaluation of perirenal fat invasion is
necessary. Bone scintigraphy is not recommended as a routine examination. It may
be considered if there is strong clinical suspicion of bone metastasis.
PET may play a complementary role in the evaluation of lesions suspected to be
metastasis by other examinations and may be considered.
Background/objective
The preoperative staging of renal cell carcinoma is indispensable for planning the treatment. As mentioned by
the General Rule for Clinical and Pathological Study of Renal Cell Carcinoma, CT plays the primary role in the
preoperative staging. The usefulness of CT along with MRI, bone scintigraphy, and PET is evaluated. The present 4th
edition of the General Rule for Clinical and Pathological Study of Renal Cell Carcinoma (2011) are based on the TNM
classification version 7 (2009) by the Union for International Cancer Control, and some revisions have been made from
the previous staging system. Since the old classification was applied to the papers that we cited as references, caution is
necessary.
Comments
1) CT
In a prospective study on imaging techniques, a combination of 3 phases, i.e., non-contrast, corticomedullary, and
nephrographic phases, showed a significantly higher staging ability (accuracy: 91%) than a combination of 2 phases,
i.e., non-contrast and corticomedullary or nephrographic phase (accuracy: 82 and 86%, respectively).1) Dynamic CT is
considered useful for not only the qualitative diagnosis but also staging of masses.
It has been suggested that the greatest cause of a decrease in the accuracy of T factor staging of renal cell carcinoma
is the low diagnostic ability for invasion to perirenal fat (distinction between T1/T2 and T3a). 1-5) This is due to the
difficulty in the discrimination of tumor invasion to fat tissue and benign changes such as those associated with
inflammation. In fact, the accuracy of the diagnosis of perirenal fat invasion by 16-detector-row MDCT has been
reported to be 64%.5) While there is one report that the accuracy was 95% by 4-detector-row MDCT with a slice
thickness of 1.25 mm,6) other studies using 4-detector-row MDCT reported that the diagnosis of perirenal fat invasion
was difficult,2,4) and it is reasonable to consider the diagnosis to be still difficult today. However, except for part of
T1a lesions, which are indications for partial nephrectomy, T1, T2, and T3a are all indications for total nephrectomy.
Therefore, at least, their exact preoperative diagnosis is not of great clinical importance. There is also a report that pT3a
renal cell carcinomas underestimated as T1 by preoperative CT showed a recurrence-free survival rate similar to that of
pT1 renal cell carcinoma.3)
The diagnostic ability of CT for tumor thrombosis has been improved by the use of multiplanar reconstruction with the
advent of MDCT (Figure). There have been reports that its sensitivity and specificity were 93 and 80%, respectively,7)
and that the level of tumor thrombus could be accurately determined in 84% of the patients except for the segmental
vein, contributing to the planning of surgery.8)
Widely used diagnostic criteria for lymph node metastasis are a short diameter of 1 cm or greater and loss of the
horseshoe shape, but they have long been considered insufficient. While reports on the diagnostic ability of MDCT for
lymph node metastasis are few, there is a report that the accuracy, false positive rate, and false negative rate were 74, 19,
and 7%, respectively, using 16-detector-row MDCT.5)
The necessity of chest CT is considered high, because the lung is the most frequent site of distant metastasis of renal
cell carcinoma. However, a retrospective study in 120 patients with renal cell carcinoma concluded that plain chest
radiography was sufficient for T1-stage tumors and that chest CT is indicated when solitary masses have been detected
by plain chest radiography, when there are respiratory symptoms, and for advanced tumors.9)
There are also 2 reports that discussed the necessity of pelvic CT in preoperative staging. 10,11) In both reports, the
probability of the presence of significant lesions in the pelvis was very low at 2-3%, and the necessity of the inclusion of
14
The Japanese imaging guideline 2013
CQ 124
Figure: Renal cell carcinoma T3b Contrastenhanced CT reconstructed coronal image
(nephrographic phase)
Right renal cell carcinoma invades the inferior
vena cava via the renal vein ( ▲ ). The end of
the tumor embolus is shown to be below the
confluence of the right hepatic vein ( → ).
the pelvis was excluded. However, very rarely, the renal artery divides from the common iliac artery, so the scan range
covering the pelvis may be reasonable in the corticomedullary phase to preoperatively clarify the arterial anatomy by
CT angiography.
2) MRI
The diagnostic ability of MRI for the T stage and tumor embolism has been reported to be nearly equal to that of
4-detector row MDCT.2,7) However, the role of MRI in the staging is limited as a wider area can be scanned in a shorter
period, and as the diagnosis of distant metastases is possible, by MDCT.
MRI is considered useful for the judgment of whether or not nephron-sparing surgery is possible (discrimination
between T1a and T3a lesions). Specifically, a high diagnostic ability (accuracy: 91%) can be obtained concerning
perirenal fat invasion by a combination of pseudocapsule rupture and changes in the surrounding fat tissue on T2weighted imaging.12)
Also, contraindication of contrast-enhanced CT are good indications for MRI. Recently, it has been reported that
diagnostic performance similar to that of dynamic MRI was achieved for tumor thrombosis by implementing a steadystate free precession technique (such as TrueFISP, FIESTA, balanced FFE, and TrueSSFP).13)
3) Bone scintigraphy
According to the reports to date, bone scintigraphy may be performed in conditions strongly suggestive of bone
metastasis such as bone pain, but its value as a routine examination for the staging is limited.14-18) In a retrospective
study in 205 pathologically proved renal cell carcinoma patients, 34 (17%) had bone metastasis, and the sensitivity and
specificity of bone scintigraphy were 94 and 86%, respectively, but the positive predictive value was low at 57%. Also,
the bone metastasis rate in patients with T1-3aN0M0 renal cell carcinoma without bone pain was 5% or less, and it is
concluded that bone scintigraphy is not recommended in such patients.14)
4) PET
Presently, PET or PET/CT is covered by health care insurance for evaluating all malignant tumors except for early
gastric cancer when the staging and diagnosis of metastasis or recurrence cannot be determined by other examinations
or imaging modalities. While the sensitivity and negative predictive value of PET for primary lesions, lymph node, and
distant metastases are low, its specificity and positive predictive value are relatively high. It is reportedly not useful
for the differentiation of benign and malignant renal masses but is considered likely to play a complementary role for
lesions suspected to be metastases by other examinations.19-23) However, scientific evidence is lacking partly because of
the small number of subjects, and further evaluation is necessary for the future.
Index words and secondary materials used as references
A search of PubMed was performed using “renal cell carcinoma”, “preoperative staging”, “CT”, “MRI”, “bone
scintigraphy”, “positron emission tomography”, and “chest CT” as key words. The Japanese Urological Association,
The Japanese Society of Pathology, and Japan Radiological Society, ed: General Rule for Clinical and Pathological
Studies on Renal Cell Carcinoma (The 4th Edition), 2011 and American College of Radiology guidelines (Vikram R et
15
The Japanese imaging guideline 2013
7. Urinary system
al: American College of Radiology ACR Appropriateness Criteria® Clinical Condition: Renal Cell Carcinoma Staging.
Available at: http://www.acr.org/~/media/ACR/Documents/AppCriteria/Diagnostic/RenalCellCarcinomaStaging.pdf)
were also used as references.
References
1) Kopka L et al: Dual-phase helical CT of the kidney: value of the corticomedullary and nephrographic phase for evaluation of renal lesions and
preoperative staging of renal cell carcinoma. AJR 169: 1573-1578, 1997 (Level 4)
2) Hallscheidt PJ et al: Diagnostic accuracy of staging renal cell carcinomas using multidetector-row computed tomography and magnetic resonance imaging: a prospective study with histopathologic correlation. J Comput Assist Tomogr 28: 333-339, 2004 (Level 2)
3) Roberts WW et al: Pathological stage does not alter the prognosis for renal lesions determined to be stage T1 by computerized tomography. J
Urol 173: 713-715, 2005 (Level 3)
4) Hallscheidt PJ et al: Multislice computed tomography in planning nephron-sparing surgery in a prospective study with 76 patients: comparison
of radiological and histopathological findings in the infiltration of renal structures. J Comput Assist Tomogr 30: 869-874, 2006 (Level 2)
5) Türkvatan A et al: Preoperative staging of renal cell carcinoma with multidetector CT. Diagn Interv Radiol 15: 22-30, 2009 (Level 2)
6) Catalano C et al: High-resolution multidetector CT in the preoperative evaluation of patients with renal cell carcinoma. AJR 180: 1271-1277,
2003 (Level 3)
7) Hallscheidt PJ et al: Preoperative staging of renal cell carcinoma with inferior vena cava thrombus using multidetector CT and MRI: prospective study with histopathological correlation. J Comput Assist Tomogr 29: 64-68, 2005 (Level 2)
8) Guzzo TJ et al: The accuracy of multidetector computerized tomography for evaluating tumor thrombus in patients with renal cell carcinoma. J
Urol 181: 486-460, 2009 (Level 2)
9) Lim DJ et al: Computerized tomography in the preoperative staging for pulmonary metastases in patients with renal cell carcinoma. J Urol 150:
1112-1114, 1993 (Level 4)
10) Fielding JR et al: Staging of 119 patients with renal cell carcinoma: the yield and cost-effectiveness of pelvic CT. AJR 172: 23-25, 1999 (Level
4)
11) Khaitan A et al: Is there a need for pelvic CT scan in cases of renal cell carcinoma? Int Urol Nephrol 33: 13-15, 2002 (Level 4)
12) Roy C Sr et al: Significance of the pseudocapsule on MRI of renal neoplasms and its potential application for local staging: a retrospective
study. AJR 184: 113-120, 2005 (Level 3)
13) Lee CU et al: Vascular staging of renal and adrenal malignancies with a noncontrast enhanced steady state free precession technique. J Magn
Reson Imaging 33: 1406-1413, 2011 (Level 3)
14) Koga S et al: The diagnostic value of bone scan in patients with renal cell carcinoma. J Urol 166: 2126-2128, 2001 (Level 4)
15) Rosen PR et al: Bone scintigraphy in the initial staging of patients with renal-cell carcinoma: concise communication. J Nucl Med 25: 289-291,
1984 (Level 3)
16) Campbell RJ et al: Staging of renal cell carcinoma: cost-effectiveness of routine preoperative bone scans. Urology 25: 326-329, 1985 (Level 4)
17) Blacher E et al: Value of routine radionuclide bone scans in renal cell carcinoma. Urology 26: 432-434, 1985 (Level 3)
18) Staudenherz A et al: Is there a diagnostic role for bone scanning of patients with a high pretest probability for metastatic renal cell carcinoma?
Cancer 85: 153-155, 1999 (Level 3)
19) Safaei A et al: The usefulness of 18F deoxyglucose whole-body positron emission tomography (PET) for re-staging of renal cell cancer. Clin
Nephrol 57: 56-62, 2002 (Level 4)
20) Jadvar H et al: Diagnostic role of [18F]-FDG positron emission tomography in restaging renal cell carcinoma. Clin Nephrol 60: 395-400, 2003
(Level 4)
21) Kang DE et al: Clinical use of fluorodeoxyglucose F-18 positron emission tomography for detection of renal cell carcinoma. J Urol 171: 18061809, 2004 (Level 3)
22) Dilhuydy MS et al: PET scans for decision-making in metastatic renal cell carcinoma: a single-institution evaluation. Oncology 70: 339-344,
2006 (Level 3)
23) Ozülker T et al: A prospective diagnostic accuracy study of 18F fluorodeoxyglucose-positron emission tomography/computed tomography in the
evaluation of indeterminate renal masses. Nucl Med Commun 32: 265-272, 2011 (Level 2)
16
The Japanese imaging guideline 2013
CQ 125
125
Is CT appropriate for patients suspected to have
upper tract urothelial tumor?
Recommendation
grade
B
Since CT urography, which refers to excretory phase imaging of contrast-enhanced
CT, is useful for the detection of upper tract urothelial tumors, it is recommended
for high-risk groups including patients known to have, and those with a history of,
urothelial tumor, and middle-aged to aged patients with macroscopic hematuria.
Background/objective
Because urothelial carcinoma is characterized by simultaneous occurrence of multiple lesions and a high recurrence
rate, it is required to thoroughly exam the entire urinary tract including the renal pelvis, ureter, and bladder. While
bladder cancer can be diagnosed by cystoscopy, the diagnosis of upper tract urothelial carcinoma is difficult. Recently,
primarily in Western countries, CT urography has begun to be used widely for further examination of upper tract
urothelial tumor. Its usefulness and problems are evaluated.
Comments
Intravenous urography (IVU) has long been used as the first choice imaging examination that permits easy screening
of the entire urinary tract, but, with the advent of multi-detector CT, CT urography (CTU), or the excretory phase
imaging after the contrast administration, has been reported as useful. By partial MIP (or volume rendering), images of
the pelvis and ureter resembling urograms can be prepared readily, and, using usual high-resolution transverse images,
lesions in and outside of the urinary tract can be evaluated in detail. In Western countries, CTU has spread rapidly, and
IVU has been nearly abandoned. Early papers reported that the detection sensitivity of CTU for upper tract urothelial
carcinoma was very high at 91-97%.1,2,3) According to papers that compared the diagnostic performances of upper tract
urothelial carcinoma in hematuria patients between CTU and IVU, also, the sensitivity, specificity, and accuracy were
75-80, 81-86, and 81-85% for IVU, but 94-96, 95-100, and 94-99%, with for CTU, indicating superiority of CTU
compared with intravenous urography.4,5)
The 2008 American College of Radiology (ACR) guidelines rated IVU at 6 (out of a full score of 9) but CTU at 9 (top
rank) as an examination for hematuria patients. The 2011 European Association of Urology (EAU) guidelines regarded
CTU as a gold standard and mentioned that it had completely replaced IVU.
However, there is the problem that CTU radiation doses are 2-3 times higher than that of IVU 15-30 mSv by CTU and
5-10 mSv by IVU. The 2008 European Society of Urogenital Radiology (ESUR) guidelines restricted the indications
of CTU to patients with macroscopic hematuria aged 40 years and above, who are at a higher risk of urothelial cancer,
and recommended IVU for patients with microscopic hematuria aged 40 years and above and patients with hematuria
(microscopic and macroscopic) aged less than 40 years. For CTU to become prevalent in Japan, standardization of the
imaging procedure and further reduction of the radiation exposure must be accomplished.
Index words and secondary materials used as references
A search of PubMed was performed using “CT” and “urothelial tumor” as key words. The following documents were
also used as references.
Van Der Molen AJ et al: CT urography: definition, indications techniques, A guideline for clinical practice (Eur Radiol 18:
4-17) 2008
Ramchandani P et al: American College of Radiology. ACR appropriateness criteria: hematuria. Reston VA: American
College of Radiology, 2008
Roupret M et al: European guidelines for the diagnosis and management of upper urinary tract urothelial cell
carcinomas: 2011 update (Eur Urol 59: 584-594) 2011
References
1) Cowan NC et al: Multidetector computed tomography urography for diagnosing upper urinary tract urothelial tumour. BJU International 99:
1363-1370, 2007 (Level 3)
2) Dillman JR et al: Detection of upper tract urothelial neoplasms: sensitivity of axial, coronal reformatted, and curved-planar reformatted imagetypes utilizing 16-row multi-detector CT urography. Abdom Imaging 33: 707-716, 2008 (Level 4)
3) Wang LJ et al: Diagnostic accuracy of transitional cell carcinoma on multidetector computerized tomography urography in patients with gross
hematuria. J Urol 524-531, 2009 (Level 3)
17
The Japanese imaging guideline 2013
7. Urinary system
Figure: CT urography of a patient with urothelial cancer
CT urography was performed in a patient with asymptomatic macroscopic
hematuria. In transverse (upper left) and coronal reconstructed images of the
excretory phase, a lesion with soft tissue density showing a defect is noted in
the right renal pelvis ( → ). In both the MIP (lower left) and volume rendered
(lower right) images, defects are noted in the renal pelvis ( ▲ ). The lesion was
pT1 renal pelvic cancer. These images of the excretory phase reconstructed
for detailed evaluation of the urinary tract are all called CT urograms.
4) Wang LJ et al: Multidetector computerized tomography urography is more accurate than excretory urography for diagnosing transitional cell
carcinoma of the upper urinary tract in adults with hematuria. J Urol 183: 48-55, 2010 (Level 3)
5) Jinzaki M et al: Comparison of CT urography and excretory urography in the detection and localization of urothelial carcinoma of the upper urinary tract. AJR 196: 1102-1109, 2011 (Level 3)
18
The Japanese imaging guideline 2013
CQ 126
Is CT appropriate for the evaluation of T-stage of
bladder cancer?
126
Recommendation
grade
C1
While CT is inferior to MRI in the diagnostic performance concerning muscle layer
invasion, it is comparable to MRI in the diagnostic performance in perivesical fat
tissue invasion, and its implementation may be considered.
Background/objective
Since the therapeutic approach to and prognosis of bladder cancer vary with its depth, accurate preoperative evaluation
of the depth is important. Today, when MDCT is widely available, it is necessary to reevaluate the diagnostic ability of
CT for the depth of bladder cancer.
Comments
According to studies comparing CT and MRI in the diagnosis of the presence or absence of muscle layer invasion of
bladder cancer, the accuracy was 50-55% by CT and 77-85% by MRI, with CT showing inferior results (Table 1).1,2)
Concerning the presence or absence of perivesical fat tissue invasion, the accuracy was 45-89% by CT and 65-85% by
MRI, with CT being comparable or slightly inferior to MRI (Table 2).1-7) Regarding the evaluations using CT alone,
also, the accuracy of CT before the advent of MDCT was similar at 55-87% (Table 3).8,9)
A drawback of CT, in which the axial plane is the default imaging plane, is that the evaluation of small lesions in the
apex and neck of the bladder is difficult due to the partial volume effect. These defects of CT are being resolved by
examining thin sections prepared by MPR.10) Regarding the diagnostic precision of MDCT for perivesical fat tissue
invasion, the accuracy, sensitivity, and specificity have been reported to be 93, 89, and 95%, respectively (Table 3).11)
Concerning the diagnostic precision of MRI for perivesical fat tissue invasion after 2000, the accuracy, sensitivity, and
specificity were reported to be 85, 86, and 84% by Tekes et al12) and to be 94, 80, and 97%, respectively, by Takeuchi et
al.,13) indicating that MDCT had diagnostic precision comparable to that of MRI in the same period. It is necessary to
perform CT before transuretheral resection of bladder tumor (TUR-BT), but if it is impossible, it is desirable to perform
CT at an interval of 1 week or longer after TUR-BT.11) Also, the upper urinary tract can be examined by the addition of
the postcontrast excretory phase (CT urography).14)
Index words and secondary materials used as references
A search of PubMed was performed using “bladder”, “cancer”, “staging”, and “CT” as key words. Papers with
generalized themes, case reports, papers in which the wall depth was not the main theme, and those in which the
diagnostic accuracy of extramuscular invasion could not be calculated were excluded.
Table 1 Diagnostic performance of CT and MRI (stage T1/T2) (%)
Accuracy
Sensitivity
Specificity
Positive predictive value
Negative predictive value
CT1-2)
50-55
58-66
43-48
43-47
50-70
MRI1-2)
77-85
83-94
71-83
67-76
83-98
Table 2 Diagnostic performance of CT and MRI (stage T2/T3) (%) (values in parentheses are medians)
Accuracy
Sensitivity
Specificity
Positive predictive value
Negative predictive value
CT1-7)
45-89 (70)
50-100 (80)
42-83 (60)
27-89 (67)
43-94 (75)
MRI1-7)
65-85 (81)
71-100 (86)
55-83 (60)
63-90 (75)
50-100 (93)
19
The Japanese imaging guideline 2013
7. Urinary system
Table 3: Diagnostic performance of CT (stage T2/T3) (%)
CT
8)9)
MDCT
10)
Accuracy
Sensitivity
Specificity
Positive predictive value
Negative predictive value
55-87
66-88
62-85
78-85
46-89
93
89
95
83
96
References
1) Nishimura K et al: The validity of magnetic resonance imaging (MRI) in the staging of bladder cancer: comparison with computed tomography
(CT) and transurethral ultrasonography (US). Jpn J Clin Oncol 18: 217-226, 1988 (Level 3)
2) Tanimoto A et al: Bladder tumor staging: comparison of conventional and Gd-enhanced dynamic MR imaging and CT. Radiology 185: 741747, 1992 (Level 2)
3) Amendola MA et al: Staging of bladder carcinoma: MRI-CT-surgical correlation. AJR 46: 1179-1183, 1986 (Level 3)
4) Bryan PJ et al: CT and MR imaging in staging bladder neoplasms. JCAT 11: 96-101, 1987 (Level 4)
5) Husband JES et al: Bladder cancer: staging with CT and MR imaging. Radiology 173: 435-440, 1989 (Level 3)
6) Tachibana M et al: Efficacy of gadolinium-diethylenetriaminepentaacetic acid-enhanced magnetic resonance imaging for differentiation
between superficial and muscle-invasive tumor of the bladder: a comparative study with computerized tomography and transurethral ultrasonography. J Urol 145: 1169-1173, 1991 (Level 3)
7) Kim B et al: Bladder tumor staging: comparison of contrast-enhanced CT, T1- and T2-weighted MR imaging, dynamic gadolinium-enhanced
imaging, and late gadolinium-enhanced imaging. Radiology 193: 239-245, 1994 (Level 3)
8) Sager EM et al: Contrast-enhanced computed tomography to show perivesical extension in bladder carcinoma. Acta Radiol 28: 307-311, 1987
(Level 3)
9) Yaman O et al: Staging with computed tomography, transrectal ultrasonography and transurethral resection of bladder tumour: comparison
with final pathological stage in invasive bladder carcinoma. Br J Urol 78: 197-200, 1996 (Level 3)
10) Jinzaki M et al: Detection of bladder tumors with dynamic contrast-enhanced MDCT. AJR 189: 913-918, 2007 (No applicable level)
11) Kim JK et al: Bladder cancer: analysis of multi-detector row helical CT enhancement pattern and accuracy in tumor detection and perivesical
staging. Radiology 237: 725-731, 2004 (Level 3)
12) Tekes A et al: Dynamic MRI of bladder cancer: evaluation of staging accuracy. AJR 184: 121-127, 2005 (No applicable level)
13) Takeuchi M et al: Urinary bladder cancer: Diffusion-weighted MR imaging-accuracy for diagnosing T stage and estimating histologic grade.
Radiology 251: 112-121, 2009 (No applicable level)
14) Jinzaki M et al: Comparison of CT urography and excretory urography in the detection and localization of urothelial carcinoma of the upper urinary tract. AJR 196: 1102-1109, 2011 (No applicable level)
20
The Japanese imaging guideline 2013
CQ 127
127
Is MRI appropriate for the evaluation of T-stage of
bladder cancer?
Recommendation
grade
B
There is a moderate level of evidence that, MRI is useful for T-staging of bladder
cancer. We recommend to use MRI when the tumor shows a sessile non-papillary
appearance on cystoscopy.
Background/objective
The therapeutic strategy and prognosis of bladder cancer vary with its T-stage. Particularly, to diagnose the presence
or absence of muscle layer invasion is essential to identify an appropriate candidate for total cystectomy. MRI with a
higher contrast resolution than CT is expected to be useful for T-staging of bladder cancer.
Comments
The diagnostic accuracy of MRI (30-98%, median: 68%)1-16) is slightly higher than that of CT (47-55%, median: 52%)
in T-staging of bladder cancer9,12,14). CT is usually performed before MRI to identify metastasis or upper urinary tract
lesions. If an obvious invasion of the tumor into the perivesical fat or the prostate is observed on the CT, bladder MRI
may be omitted. MRI may also be skipped when the tumor shows a superficial appearance (pedunculated/papillary
tumor) on cystoscopy.
T2-weighted, dynamic contrast-enhanced, and diffusion-weighted imaging are useful for the evaluation of the T-stage.
The image plane perpendicular to the bladder wall at the base of the tumor is optimal for staging because a partial
volume effect which might degrade the staging accuracy is minimal at the plane. 10) While Tekes et al. reported that
there was no difference in the diagnostic accuracy between groups in which MRI was performed within 60 days versus
after 60 days following transurethral resection of bladder tumor (TUR-BT) or biopsy, it is desirable to perform MRI
preoperatively, because the extent of the tumor may be overestimated due to edema, scar, or granulation tissue that
develops in the bladder wall after the surgery or biopsy.5,9)
Table 1 shows the diagnostic performance of MRI for detecting muscle layer invasion of bladder cancer (stage T2 or
more). Since the difference in signal intensity is small between tumors and normal muscle layer, the diagnosis of muscle
layer invasion is generally difficult when only T2-weighted imaging is used.2,5) Dynamic contrast-enhanced imaging can
improve the sensitivity for the muscle invasion because bladder cancer enhances stronger than the bladder muscle layer
in the early phase. Therefore, if the extent of the tumor unclear on T2-weighted imaging, the findings demonstrated on
dynamic contrast-enhanced imaging are recommended to be regarded as more important. Major drawback of T2-weighted
and dynamic contrast-enhanced imaging, is a low specificity for bladder muscle layer invasion; Diffusion-weighted
imaging with a high b value (e.g. b=1,000) is as an option to improve the specificity.2,3) Although the diagnostic accuracy
for muscle layer invasion has been improved by the development of new MRI techniques, it has not been completely
reliable yet. If the presence or absence of muscle layer invasion of bladder cancer cannot be determined by MRI, the
T-stage is recommended to be diagnosed pathologically by transuretheral bladder tumor biopsy before total cystectomy.
Table 2 shows the diagnostic performance of MRI for perivesical fat invasion (stage: T3 or more). While contrastenhanced imaging contributes to improve the sensitivity, of perivesical fat invasion, an attention should be paid for
the contrast enhancement of blood vessels or inflammatory reaction around the bladder which mimics bladder tumor
and results in a false positivity.5) Diffusion-weighted imaging is a useful option to depict the extent of the tumor
more accurately.3) Because of the limitation of spatial resolution, the discrimination between microscopic invasion
to the perivesical fat (stage: T3a) and deep muscle layer invasion (stage: T2b) is generally difficult. The diagnostic
performances of MRI and CT for perivesical fat invasion (T3 or more) are comparable.
Index words and secondary materials used as references
A search of PubMed was performed using “bladder”, “cancer”, “MRI”, and “staging” as key words. Papers on general
themes, those in which the diagnosis of bladder cancer staging was not the primary theme, those in which the magnetic
field intensity of the MRI device used was not 1.5T, and those in which a rectal coil was used were excluded.
21
The Japanese imaging guideline 2013
7. Urinary system
Table 1 Diagnostic ability for bladder muscle layer invasion (%) Values in ( ) are the median values.
Accuracy
Sensitivity
Specificity
Positive predictive value
Negative predictive value
6-83 (79)
73-93 (83)
71-85 (76)
77 (77)
93 (93)
Contrast-enhanced*
76-90 (83)
80-97 (96)
55-88 (73)
67-96 (74)
83-96 (93)
Total*
6-98 (79)
40-97 (90)
55-100
67-96 (77)
83-96 (93)
T2-weighted*
a
b
c
*a: By T2-weighted imaging alone
2-4,6,10,17-19)
*b: By contrast-enhanced imaging alone or in combination with T2-weighted imaging2,3,5,6,10),14)
*c: By T2-weighted, contrast-enhanced, or diffusion-weighted imaging alone or in combination2-6,10,14,17-19)
Table 2 Diagnostic ability for perivesical adipose tissue invasion (local stage: T3) (%) Values in ( ) are the median values.
Accuracy
Sensitivity
Specificity
T2-weighted*a
24-88 (82)
50-100 (77)
62-95 (86)
80-85 (83)
89-100 (95)
Contrast-enhanced*b
79-93 (85)
79-100 (88)
73-98 (88)
71-94 (79)
55-100 (85)
Total*
24-98 (85)
50-100 (81)
62-98 (86)
71-94 (79)
55-100 (90)
c
Positive predictive value
Negative predictive value
*a: By T2-weighted imaging alone3,4,6,9,10,17-19)
*b: By contrast-enhanced imaging alone or in combination with T2-weighted imaging3,5,6,9,10,13,17-19)
*c: By T2-weighted, contrast-enhanced, or diffusion-weighted imaging alone or in combination3-6,9,10,13,17-19)
References
1) Rajesh A et al: Bladder cancer: evaluation of staging accuracy using dynamic MRI. Clin Radiol 66: 1140-1145, 2011 (Level 2)
2) Watanabe H et al: Preoperative T staging of urinary bladder cancer: does diffusion-weighted MRI have supplementary value? AJR 192: 13611366, 2009 (Level 2)
3) Takeuchi M et al: Urinary bladder cancer: diffusion-weighted MR imaging--accuracy for diagnosing T stage and estimating histologic grade.
Radiology 251: 112-121, 2009 (Level 2)
4) El-Assmy A et al: Bladder tumour staging: comparison of diffusion- and T2-weighted MR imaging. Eur Radiol 19: 1575-1581, 2009 (Level 3)
5) Tekes A et al: dynamic MRI of bladder cancer: evaluation of staging accuracy. AJR 184: 121-127, 2005 (Level 3)
6) Mizuno K et al: Gadolinium-enhanced MR imaging, T2-weighted MR Imaging, and Transurethral Ultrasonography. J Jpn Radiol Soc 61: 496501, 2001 (Level 3)
7) Barentsz JO et al: Staging urinary bladder cancer after transurethral biopsy: value of fast dynamic contrast-enhanced MR imaging. Radiology
201: 185-193, 1996 (Level 2)
8) Barentsz JO et al: Staging urinary bladder cancer: value of T1-weighted three-dimensional magnetization prepared-rapid gradient-echo and
two-dimensional spin-echo sequences. AJR 164: 109-115, 1995 (Level 2)
9) Kim B et al: Bladder tumor staging: comparison of contrast-enhanced CT, T1- and T2-weighted MR imaging, dynamic gadolinium-enhanced
imaging, and late gadolinium-enhanced imaging. Radiology 193: 239-245, 1994 (Level 3)
10) Narumi Y et al: Bladder tumors: staging with gadolinium-enhanced oblique MR imaging. Radiology 187: 145-150, 1993 (Level 2)
11) Ruether U et al: Intra- and perivesical tumor growth in preoperative staging of bladder cancer: the role of transrectal ultrasonography and high
resolution magnetic resonance imaging. Urol Int 50: 141-147, 1993 (Level 3)
12) Tanimoto A et al: Bladder tumor staging: comparison of conventional and gadolinium-enhanced dynamic MR imaging and CT. Radiology 185:
741-747, 1992 (Level 2)
13) Neuerburg JM et al: Staging of urinary bladder neoplasms with MR imaging: is Gd-DTPA helpful? J Comput Assist Tomogr 15: 780-786, 1991
(Level 3)
14) Tachibana M et al: Efficacy of gadolinium-diethylenetriaminepentaacetic acid-enhanced magnetic resonance imaging for differentiation
between superficial and muscle-invasive tumor of the bladder: a comparative study with computerized tomography and transurethral ultrasonography. J Urol 145: 1169-1173, 1991 (Level 3)
15) Sohn M et al: Gadolinium-enhanced magnetic resonance imaging in the staging of urinary bladder neoplasms. Urol Int 45: 142-147, 1990
(Level 3)
16) Koelbel G et al: MR imaging of urinary bladder neoplasms. J Comput Assist Tomogr 12: 98-103, 1988 (Level 3)
17) Husband JE et al: Bladder cancer: staging with CT and MR imaging. Radiology 173: 435-440, 1989 (Level 3)
18) Nishimura K et al: Clinical application of MRI for urological malignancy. 2: Usefulness of various imaging modalities for local staging of bladder
cancer; a comparison between MRI, CT and transurethral ultrasonography. Acta Urol Jpn 34: 2091-2096, 1988 (Level 3)
19) Nishimura K et al: The validity of magnetic resonance imaging (MRI) in the staging of bladder cancer: comparison with computed tomography
(CT) and transurethral ultrasonography (US). Jpn J Clin Oncol 18: 217-226, 1988 (Level 3)
22
The Japanese imaging guideline 2013
CQ 128
128
Is MRI appropriate for detecting prostate cancer?
Recommendation
grade
C1
Since there is the possibility that highly malignant tumors can be detected efficiently,
the implementation of MRI may be considered even before biopsy to focus the area
to be biopsied or to evaluate indications for biopsy.
Background/objective
Recently, the incidence and the mortality of prostate cancer are rapidly increasing in Japan. The measurement of the
serum prostate-specific antigen (PSA) has been established as a method effective for the detection of prostate cancer,
leading to a decrease in the mortality rate.1,2) While PSA is highly sensitive, its specificity is relatively low, and problems
such as false positives in the PSA gray zone (4-10 ng/ml) have been suggested. In this setting, prostate MRI is expected
to play roles in not only staging of cancer but also the tumor detection and localization and evaluation of the tumor
aggressiveness. In this section, the usefulness of MRI for the detection of prostate cancer was evaluated by reviewing
primarily reports on T2-weighted, dynamic contrast-enhanced, and diffusion-weighted imaging using a 1.5T scanner.
Comments
Methods for detecting prostate cancer include digital rectal examination (DRE), serum PSA, transrectal
ultrasonography (TRUS), and MRI. Among these examinations, MRI using a endorectal coil (T2-weighted imaging)
has the highest tumor localization ability.3) When reports using a surface coil are included, however, the sensitivity and
specificity of T2-weighted imaging for detecting tumors have been reported to be 54-96 and 21-91%, respectively,4) with
some showing low specificities. On the other hand, both dynamic contrast-enhanced and diffusion-weighted imaging
have shown relatively high specificities,5,6) and the addition of these techniques to T2-weighted imaging improves the
sensitivity and area under the ROC curve (Az value).6-9) Evaluation methods in which multiple MRI sequences are used
in combination are called multiparametric MRI. The diagnostic ability of multiparametric MRI is high for prostate
cancers of the transitional as well as peripheral zone (Figure).10,11) However, it must be noted that hemorrhage due to
prostate biopsy interferes with the tumor detection and that MRI should be performed before biopsy. To summarize
the reports concerning patients in whom the mean serum PSA level was 20 ng/ml or less and MRI was performed
before biopsy or a mean of 8 weeks or longer after biopsy (to reduce the influence of hemorrhage12)), the sensitivity,
specificity, and Az value of multiparametric MRI using a surface coil at 1.5T were 53-95%, 69-94%, and 0.737-0.966,
respectively.6,11,13,14) The sensitivity tended to be improved by the use of an endorectal coil at 1.5T (sensitivity: 73-100%,
specificity: 63-92%, Az value: 0.76-0.94),8,9,15,16) and the specificity to be improved by the use of a surface coil at 3T
(sensitivity: 76-81%, specificity: 93-96%).7)
Recently, there have been reports that the Gleason score, which is an index of the tumor aggressiveness, and various
risk scores show significant correlations with the apparent diffusion coefficient (ADC) on diffusion-weighted imaging
and signal intensity on T2-weighted imaging in the tumor region (primarily in the peripheral zone) on prostate MRI.17-19)
Also, the detectability of tumors by MRI is higher as the tumor size is larger, and as the Gleason score is higher.5,6,14,20,21)
Therefore, there is the possibility that, by using MRI, cancers that need therapeutic intervention (significant cancer: size:
≥0.5 cm3, Gleason score: ≥7) can be efficiently detected among prostate cancers showing multicentric carcinogenesis.
An example of such instances is an increase of the cancer detection rate using targeted biopsy on the basis of MR
findings (T2-weighted imaging, dynamic contrast-enhanced imaging, and MR spectroscopy) in patientswith persistently
elevated PSA levels and prior negative random TRUS-guided biopsy.22) According to a report using diffusion-weighted
imaging and T2-weighted imaging from another group, in patients without findings indicative of cancer who underwent
only systematic biopsy, as compared with patients who underwent targeted biopsy based on MR imaging findings, tumor
detectability was low, and about 80% of the detected tumors were insignificant cancer .23) Moreover, in the targeted
biopsy group, even in patients with a PSA of 4-20 ng/ml, detection was significantly better .23)
These results suggest the usefulness of targeted biopsy based on MR imaging findings, and in patients with prior
negative biopsy, or those with gray zone PSA levels, such findings may serve as a guide to determine the indications for
biopsy. However, many tumors can be detected by DRE or TRUS, and there is no ground for recommending MRI for all
high-PSA patients. For the future, optimization of imaging techniques of prostate MRI (coil, combination of sequences,
imaging parameters) and evaluation methods of MR images must be advanced further.
Finally, the ESUR guidelines 201224) proposed a method called the Prostate Imaging Reporting and Data System (PIRADS), by which findings obtained by various imaging techniques of multiparametric MRI are scored to objectively
detect tumors and evaluate extracapsular extension. It is a novel attempt, but as appropriate scoring is difficult, an
23
The Japanese imaging guideline 2013
7. Urinary system
A
B
Figure: Prostate cancer in the transition zone
A Transverse T2-weighted image B Transverse diffusion-weighted image (b value=1000)
In the T2-weighted image, there is little difference in signal intensity between the tumor and
surrounding normal transition zone, and the tumor is difficult to detect. However, lesion with a focal
hyperintensity is depicted clearly in the diffusion-weighted image ( → ).
attitude to utilize this method while simultaneously evaluating it is considered necessary.
Index words and secondary materials used as references
A search of PubMed was performed using “prostate cancer”, “detection”, and “MRI” as key words. The ESUR prostate
MR guidelines 2012 were also used as a reference.
References
1) Schröder FH et al: Screening and prostate-cancer mortality in a randomized European study. N Engl J Med 360: 1320-1328, 2009 (Level 1b)
2) Hugosson J et al: Mortality results from the Göteborg randomised population-based prostate-cancer screening trial. Lancet Oncol 11: 725-732,
2010 (Level 1b)
3) Mullerad M et al: Comparison of endorectal magnetic resonance imaging, guided prostate biopsy and digital rectal examination in the preoperative anatomical localization of prostate cancer. J Urol 174: 2158-2163, 2005 (Level 3)
4) Hoeks CM et al: Prostate cancer: multiparametric MR imaging for detection, localization, and staging. Radiology 261: 46-66, 2011 (Level 4)
5) Turkbey B et al: Prostate cancer: value of multiparametric MR imaging at 3 T for detection--histopathologic correlation. Radiology 255: 89-99,
2010 (Level 2)
6) Tamada T et al: Prostate cancer detection in patients with total serum prostate-specific antigen levels of 4-10 ng/ml: diagnostic efficacy of
diffusion-weighted imaging, dynamic contrast-enhanced MRI, and T2-weighted imaging. AJR 197: 664-670, 2011 (Level 3)
7) Kitajima K et al: Prostate cancer detection with 3 T MRI: comparison of diffusion-weighted imaging and dynamic contrast-enhanced MRI in
combination with T2-weighted imaging. J Magn Reson Imaging 31: 625-631, 2010 (Level 3)
8) Haider MA et al: Combined T2-weighted and diffusion-weighted MRI for localization of prostate cancer. AJR 189: 323-328, 2007 (Level 3)
9) Lim HK et al: Prostate cancer: apparent diffusion coefficient map with T2-weighted images for detection: a multireader study. Radiology 250:
145-151, 2009 (Level 3)
10) Oto A et al: Prostate cancer: differentiation of central gland cancer from benign prostatic hyperplasia by using diffusion-weighted and dynamic
contrast-enhanced MR imaging. Radiology 257: 715-723, 2010 (Level 3)
11) Yoshizako T et al: Usefulness of diffusion-weighted imaging and dynamic contrast-enhanced magnetic resonance imaging in the diagnosis of
prostate transition-zone cancer. Acta Radiol 49: 1207-1213, 2008 (Level 3)
12) Qayyum A et al: Organ-confined prostate cancer: effect of prior transrectal biopsy on endorectal MRI and MR spectroscopic imaging. AJR 183:
1079-1083, 2004 (Level 3)
13) Tanimoto A et al: Prostate cancer screening: the clinical value of diffusion-weighted imaging and dynamic MR imaging in combination with
T2-weighted imaging. J Magn Reson Imaging 25: 146-152, 2007 (Level 3)
14) Villers A et al: Dynamic contrast enhanced, pelvic phased array magnetic resonance imaging of localized prostate cancer for predicting tumor
volume: correlation with radical prostatectomy findings. J Urol 176: 2432-2437, 2006 (Level 3)
15) Vilanova JC et al: Usefulness of prebiopsy multifunctional and morphologic MRI combined with free-to-total prostate-specific antigen ratio in
the detection of prostate cancer. AJR 196: W715-W722, 2011 (Level 4)
16) Riches SF et al: MRI in the detection of prostate cancer: combined apparent diffusion coefficient, metabolite ratio, and vascular parameters.
AJR 193: 1583-1591, 2009 (Level 3)
17) Turkbey B et al: Is apparent diffusion coefficient associated with clinical risk scores for prostate cancers that are visible on 3-T MR images?
24
The Japanese imaging guideline 2013
CQ 128
Radiology 258: 488-495, 2011 (Level 3)
18) Tamada T et al: Apparent diffusion coefficient values in peripheral and transition zones of the prostate: comparison between normal and malignant prostatic tissues and correlation with histologic grade. J Magn Reson Imaging 28: 720-726, 2008 (Level 4)
19) Wang L et al: Assessment of biologic aggressiveness of prostate cancer: correlation of MR signal intensity with Gleason grade after radical
prostatectomy. Radiology 246: 168-176, 2008 (Level 3)
20) Shimizu T et al: Prostate cancer detection: the value of performing an MRI before a biopsy. Acta Radiol 50: 1080-1088, 2009 (Level 3)
21) Ikonen S et al: Magnetic resonance imaging of prostatic cancer: does detection vary between high and low gleason score tumors? Prostate
43: 43-48, 2000 (Level 3)
22) Sciarra A et al: Value of magnetic resonance spectroscopy imaging and dynamic contrast-enhanced imaging for detecting prostate cancer foci
in men with prior negative biopsy. Clin Cancer Res 16: 1875-1883, 2010 (Level 3)
23) Watanabe Y et al: Detection and localization of prostate cancer with the targeted biopsy strategy based on ADC map: a prospective largescale cohort study. J Magn Reson Imaging 35: 1414-1421, 2012 (Level 3)
24) Barentsz JO et al: ESUR prostate MR guidelines 2012. Eur Radiol 22: 746-757, 2012 (Level 4)
25
The Japanese imaging guideline 2013
7. Urinary system
129
Is MRI appropriate for the local staging of prostate
cancer?
Recommendation
grade
B
MRI is useful for the evaluation of extraprostatic extension and seminal vesicle
invasion of medium- to high-risk prostate cancer and is recommended.note)
note) A endorectal coil was used in most studies. With a surface coil, it is necessary to use a scanner at 1.5T or higher
magnetic field strength and to optimize scanning parameters related to spatial resolution such as the slice thickness.
Background/objective
Prostate cancer is increasing rapidly, and the standardization of diagnostic imaging techniques for prostate cancer
is important. While MRI is regarded as a reliable imaging modality in the local staging of prostate cancer, it is not
performed in all patients. In this section, whether or not MRI is useful for the local staging (extraprostatic extension,
seminal vesicle invasion) of prostate cancer and under what circumstances its usefulness is augmented are evaluated.
Comments
MRI is regarded as the most reliable imaging modality for the local staging of prostate cancer (Figure). A endorectal
coil was used in most reports evaluating extraprostatic extension using a 1.5T MRI system. Concerning the diagnostic
ability of T2-weighted imaging for extraprostatic extension, the sensitivity, specificity, and accuracy were 22-82, 70-100,
and 61-84%, respectively, showing wide variations among reports.1-16) Multivariate analysis suggested that asymmetry
of the neurovascular bundle and obliteration of the rectoprostatic angle are reliable findings suggestive of extraprostatic
extension.1) As for the diagnostic ability of MRI for seminal vesicle invasion, the sensitivity, specificity, and accuracy
have been reported to be 23-100, 75-100, and 76-97%, respectively.2-5,7-9,13-16) While there have been few studies using
dynamic contrast-enhanced imaging, the procedure has been reported to be superior to T2-weighted imaging in detecting
not only prostate cancer but also extraprostatic extension (diagnostic accuracy: 87%) and seminal vesicle invasion
(98%).6,12) There is also a report that the diagnostic ability of less experienced readers was improved by the addition of
dynamic contrast-enhanced imaging.12)
For the management of prostate cancer, appropriate treatment is selected according to risk classification based on
the clinical stage, PSA level, Gleason score, and percentage of the biopsy core occupied by cancer tissue. In Western
countries, the selection of imaging modalities in consideration of the risk of tumor is widely recognized, and is also
mentioned in guidelines (EAU guidelines 2010,17) and ACR guidelines 200918)). However, the risk classification based
on the clinical stage is inappropriate as the grounds for the application of MRI to stage prostate cancers. In retrospective
evaluations, the diagnostic ability of MRI for extra-prostate spread was low in low-risk patients but was higher in
medium- to high-risk patients. On the other hand, the specificity showed little difference among the risk levels.7) When
a patient shows a PSA level of 10 ng/ml or higher, or a biopsy Gleason score of 7 or greater, he is judged to be moderate
or higher risk, and the evaluation of extraprostatic extension and seminal vesicle invasion by MRI is beneficial.
In Japan, most of prostate MR images are acquired by using a surface coil such as a pelvic phased array coil. While
the staging ability is improved by using an integrated system of both surface and endorectal coils, compared with a
surface coil alone,13) endorectal coils are unlikely to become popular in Japan at present. If a surface coil is used alone,
a comparable staging ability is considered to be secured by using an MRI system at 1.5T or higher magnetic field
strength, eliminating rectal gas, which deteriorates the image quality, and maintaining spatial resolution by the use of a
thin slice thickness of about 4 mm.16) Local staging of prostate cancer using a 3T MRI system has also been attempted,
and the procedure is expected to provide high-spatial resolution images and improve the staging ability. No marked
improvement in the staging ability has been reported to date.
Finally, there were no papers suggesting contribution of diffusion-weighted imaging to the local staging.
Index words and secondary materials used as references
A search of PubMed was performed using “prostate cancer”, “staging”, and “MRI” as key words. Also, the JRS/JCR
Joint Guideline Committee eds: Guidelines for Diagnostic Imaging of Prostate Cancer 200719) were used as a basic
reference, and the EAU17) and ACR18) prostate cancer guidelines were used as references.
References
1) Yu KK et al: Detection of extracapsular extension of prostate carcinoma with endorectal and phased-array coil MR imaging: multivariate fea-
26
The Japanese imaging guideline 2013
CQ 129
A
B
Figure: Prostate cancer PSA 22 ng/ml
C
A T2-weighted image B T1-weighted image
C ADC map (b value: 0, 1,000s/mm2)
On T2-weighted imaging, as the left peripheral
zone became hypointense, and as the hypointensity
also extended to the transitional zone, cancer is
suspected. The left dorsal contour shows fine fingers
and presents signals similar to those of the primary
focus. Extraprostatic extension is suspected ( → ). In
the T1-weighted image, the irregularity of the contour
is clearly observed. In the ADC map, the distribution
of the tumor in the prostate is clearly visualized, but
small extraprostatic spread cannot be discussed.
ture analysis. Radiology 202: 697-702, 1997 (Level 2)
2) Sanchez-Chapado M et al: Comparison of digital rectal examination, transrectal ultrasonography, and multicoil magnetic resonance imaging
for preoperative evaluation of prostate cancer. Eur Urol 32: 140-149, 1997 (Level 3)
3) Presti JC Jr et al: Local staging of prostatic carcinoma: comparison of transrectal sonography and endorectal MR imaging. AJR 166: 103-108,
1996 (Level 3)
4) Cornud F et al: Local staging of prostate cancer by endorectal MRI using fast spin-echo sequences: prospective correlation with pathological
findings after radical prostatectomy. Br J Urol 77: 843-850, 1996 (Level 2)
5) Perrotti M et al: Endo-rectal coil magnetic resonance imaging in clinically localized prostate cancer: is it accurate? J Urol 156: 106-109, 1996
(Level 3)
6) Ogura K et al: Dynamic endorectal magnetic resonance imaging for local staging and detection of neurovascular bundle involvement of prostate cancer: correlation with histopathologic results. Urology 57: 721-726, 2001 (Level 2)
7) Allen DJ et al: Does body-coil magnetic-resonance imaging have a role in the preoperative staging of patients with clinically localized prostate
cancer? BJU Int 94: 534-538, 2004 (Level 3)
8) Nakashima J et al: Endorectal MRI for prediction of tumor site, tumor size, and local extension of prostate cancer. Urology 64: 101-105, 2004
(Level 3)
9) Chelsky MJ et al: Use of endorectal surface coil magnetic resonance imaging for local staging of prostate cancer. J Urol 150: 391-395, 1993
(Level 2)
10) Wang L et al: Prostate cancer: incremental value of endorectal MR imaging findings for prediction of extracapsular extension. Radiology 232:
133-139, 2004 (Level 2)
11) Brassell SA et al: Correlation of endorectal coil magnetic resonance imaging of the prostate with pathologic stage. World J Urol 22: 289-292,
2004 (Level 2)
12) Fütterer JJ et al: Staging prostate cancer with dynamic contrast-enhanced endorectal MR imaging prior to radical prostatectomy: experienced
versus less experienced readers. Radiology 237: 541-549, 2005 (Level 2)
13) Fütterer JJ et al: Prostate cancer: comparison of local staging accuracy of pelvic phased-array coil alone versus integrated endorectal-pelvic
phased-array coils Local staging accuracy of prostate cancer using endorectal coil MR imaging. Eur Radiol 17: 1055-1065, 2007 (Level 2)
14) Chandra RV et al: Endorectal magnetic resonance imaging staging of prostate cancer. ANZ J Surg 7: 860-865, 2007 (Level 3)
15) Park BK et al: Comparison of phased-array 3.0-T and endorectal 1.5-T magnetic resonance imaging in the evaluation of local staging accuracy
for prostate cancer. J Comput Assist Tomogr 31: 534-538, 2007 (Level 3)
16) Lee SH et al: Is endorectal coil necessary for the staging of clinically localized prostate cancer? Comparison of non-endorectal versus
endorectal MR imaging. World J Urol 28: 667-672, 2010 (Level 2)
17) Heidenreich A et al: EAU Guidelines on Prostate Cancer 2010. European Association of Urology, 2010 (Level 4) (http://www.uroweb.org/gls/
pdf/Prostate%20Cancer%202010.pdf)
18) Israel GM et al: American College of Radiology. ACR appropriateness criteria: pretreatment staging prostate cancer. Reston, VA: American
College of Radiology, 2009 (Level 4) (http://guideline.gov/content.aspx?id=15768)
19) Kaji Y et al: Guidelines for Diagnostic Imaging of Prostate Cancer, JRS/JCR Joint Guidelines Committee eds: Evidence-based Guidelines for
Diagnostic Imaging 2007, 2007 (Level 4) (http://www.jcr.or.jp/guideline/2007/pdf/418.pdf)
27
The Japanese imaging guideline 2013
7. Urinary system
130
Which imaging modalities are appropriate for the
staging of testicular tumors?
Recommendation
grade
A
C1
A CT
C1 PET
CT has strong evidence for the usefulness and is recommended. PET lacks sufficient
scientific evidence, but its implementation may be considered.
Background/objective
Presently, the cure rate of testicular tumors is very high, being 99% or higher in the early stage. In the advanced stage
with metastasis, also, it is 90% in the good risk group, 75-80% in the intermediate risk group, and 50% in the poor risk
group by the International Germ Cell Cancer Collaborative Group Classification. One of the most important factors of a
high cure rate is accurate staging, and the stage is determined according to the site and size of metastasis. With these in
mind, imaging modalities, particularly CT and PET, for the staging of testicular tumors were evaluated.
Comments
Testicular tumors most often metastasize to the retroperitoneal and mediastinal lymph nodes. CT is mentioned as
essential for the staging of testicular tumors in multiple guidelines including the latest editions of the American College
of Radiology (ACR) and European Association of Urology (EAU) guidelines, and in most cases contrast-enhanced CT
is recommended. For patients with contraindications for the contrast agent, MRI with excellent contrast resolution is
suggested as an alternative, but scanning of a wide area is impossible. Therefore, non-contrast CT is considered useful in
patients with contraindications for the contrast agent in clinical practice. In detecting lung metastases, chest CT is more
sensitive than plain chest radiography, and scanning from the thoracic to pelvic regions is useful. However, caution is
necessary as false positive results are often obtained in lung lesions 1 cm or less in diameter. Chest CT may be omitted,
particularly, in stage I seminoma if no abnormality is noted on plain chest radiography.1)
No firm conclusion has been reached concerning the usefulness of PET for the staging. According to a prospective
multicenter study reported in 2008, PET was performed for the staging in 72 patients with stage I or IIA/B nonseminomatous germ cell tumors, and the results were confirmed histologically by retroperitoneal lymph node dissection.
As a result, the sensitivity, specificity, accuracy, positive predictive value (PPV), and negative predictive value (NPV)
were 41, 95, 71, 87, and 67%, respectively, for CT and 66, 98, 83, 95, and 78%, respectively, for PET. While both CT
and PET showed a high specificity, PET was significantly superior in the sensitivity and NPV.2) However, it must be
noted that the NPV was less than 80% even by the use of PET.
In another study, PET was performed for the staging of 46 patients with stage I non-seminomatous germ cell tumors,
and the patients were followed up by examination of tumor markers and CT. The sensitivity, specificity, accuracy, PPV,
and NPV of PET were 70, 100, 93, 100, and 92%, respectively, and the modality was suggested to be superior in NPV
(78%) to conventional tumor marker measurement and CT alone.3) On the basis of these results, a multicenter study was
organized, and 87 PET-negative patients out of the 111 patients with stage I non-seminomatous germ cell tumor positive
for vascular invasion were followed up without treatment. The study was discontinued as recurrence was observed in 33
patients at a median observation period of 12 months. Considering that the disease recurred within 1 year in 37% of the
PET-negative patients, being PET-negative does not warrant observation without treatment.4)
Reasons for false negatives on PET in the initial staging include the smallness of the lesion (≤0.5 or 1 cm) and the
presence of mature teratoma.5)
From these observations, it is concluded that PET may improve the sensitivity and NPV compared with CT in the
staging of non-seminomatous testicular tumors but that its diagnostic ability is still deficient to warrant observation of
stage I patients without treatment on the basis of a negative PET result.
The literature on PET used for the staging of seminoma is insufficient. However, as PET is more useful for the
assessment of residual masses after chemotherapy in seminomas than in non-seminomatous lesions (discussed in detail
in CQ131), at present, its implementation in patients with seminoma as well as non-seminomatous testicular tumors may
be considered.
28
The Japanese imaging guideline 2013
CQ 130
Figure: Non-seminomatous testicular tumor
Paraaotic lymph node metastasis
Multiple lymph nodes in the paraaotic region are enlarged
( → ), suggesting metastasis.
Index words and secondary materials used as references
A search of PubMed was performed using “testicular”, “testis”, “germ cell tumor”, “tumor”, “cancer”, “carcinoma”,
“seminoma”, “nonseminoma”, “CT”, and “PET” as key words. The ACR Appropriateness Criteria 2012, EAU
guidelines 2011, SIU/ICUD Consensus Meeting on Germ Cell Tumors 2009, Report of the European Germ Cell Cancer
Consensus Group (EGCCCG) 2004, and the literature related to them were also used as references.
References
1) Horan G et al: CT of the chest can hinder the management of seminoma of the testis: it detects irrelevant abnormalities. Br J Cancer 96: 882885, 2007 (Level 3)
2) de Wit M et al: [18F]-FDG-PET in clinical stage I/II non-seminomatous germ cell tumours: results of the German multicentre trial. Ann Oncol 19:
1619-1623, 2008 (Level 3)
3) Lassen U et al: Whole-body FDG-PET in patients with stage I non-seminomatous germ cell tumours. Eur J Nucl Med Mol Imaging 30: 396-402,
2003 (Level 3)
4) Huddart RA et al: 18fluorodeoxyglucose positron emission tomography in the prediction of relapse in patients with high-risk, clinical stage I nonseminomatous germ cell tumors: preliminary report of MRC Trial TE22--the NCRI Testis Tumour Clinical Study Group. J Clin Oncol 25: 30903095, 2007 (Level 3)
5) De Santis M et al: The role of positron emission tomography in germ cell cancer. World J Urol 22: 41-46, 2004 (Level 3)
29
The Japanese imaging guideline 2013
7. Urinary system
131
Which imaging modalities are appropriate for the
post-treatment assessment of testicular tumors?
Recommendation
grade
A
B
C2
A CT
B PET (for seminoma)
C2 PET (for non-seminoma)
CT has strong evidence for the usefulness and is recommended.
PET is useful for the viability assessment of post-chemotherapy residual tumors
of seminoma (particularly ≥3 cm) and is recommended but not for post-treatment
assessment of non-seminomas due to the lack of sufficient scientific evidence.
Background/objective
Due to the recent development of chemotherapy, there have been marked improvements in the cure rate of even
advanced testicular tumors with metastasis, but the therapeutic approach remains controversial if residual tumors are
observed after chemotherapy. Residual tumors often consist of necrotic/scar tissues not containing viable tumor cells,
and as retroperitoneal lymph node dissection (RPLND) in particular is highly invasive, expectations for the assessment
using imaging modalities are high.
In this setting, post-chemotherapy imaging evaluation of testicular tumors with metastasis, particularly by CT and PET,
is discussed separately concerning seminoma and non-seminoma.
Comments
For testicular tumors without metastasis, radical high orchitectomy is performed, and chemotherapy and radiation
therapy are added if necessary. Periodic follow-up (surveillance) for recurrence by tumor marker monitoring and
abdominal CT is strongly recommended by multiple guidelines abroad.
For seminoma with metastasis, chemotherapy is performed in addition to high orchitectomy. The post-chemotherapy
assessment by tumor marker monitoring and abdominal CT is also strongly recommended. While residual tumors are
observed in 55-80% of the patients after chemotherapy, many of them are necrotic or fibrotic tissue. Conventionally,
a maximum tumor diameter of 3 cm or greater on CT was used as a cutoff value. Actually, however, only 11-37% of
residual tumors 3 cm or greater are viable.1)
Concerning the viability assessment of post-chemotherapy residual masses of seminoma, PET has been reported
to show a high ability, particularly, when the tumor diameter is 3 cm or greater.2,3) According to a multicenter study
reported in 2004, PET showed very high sensitivity, specificity, positive predictive value (PPV), and negative predictive
value (NPV) of 80, 100, 100, and 96%, respectively.4) Because of this report, PET began to be recommended for the
assessment of post-chemotherapy residual masses of seminoma by multiple international guidelines. Thereafter, as there
have been sporadic reports of a high false positive rate by PET,5) the largest ever retrospective study was conducted for
the reevaluation, and the results were released in 2011.1) According to this report, the sensitivity, specificity, PPV, and
NPV of PET were 67, 82, 42, and 93%, respectively, and although they were superior to the values with a tumor size of
3 cm as a cutoff value, they were slightly lower than those reported previously.
From these observations, PET is considered to be superior to CT in the assessment of seminoma after chemotherapy
with a particularly high NPV (93-100%).1,2,4,5) If a residual tumor 3 cm or greater in diameter is PET-negative 6 or more
weeks after chemotherapy, it is unlikely to be viable.
Concerning non-seminomatous testicular tumor, according to a prospective multicenter study in 641 patients reported
in 2000, the percentage of postoperative masses consisting of necrotic tissue alone was higher as the residual tumor
size on CT was small, and as the tumor volume reduction rate was higher.6) However, viable tumor cells (teratoma or
carcinoma) persisted in 28% of residual masses 9 mm or less in diameter and 20% of those with a volume reduction rate
of 85% or higher. Moreover, in 2003, when RPLND was performed in 87 patients with residual lesions 20 mm or less
in diameter after BEP therapy, viable tumors were reported to have been detected in 33%.7) From these results, in nonseminomatous tumors, the possibility that an even post-chemotherapy small residual tumor is viable is considered to be
relatively high.
Regarding PET, a prospective multicenter study was performed in patients with histologically confirmed results in 2008,
and the sensitivity, specificity, PPV, and NPV were 70, 48, 59, and 51% respectively, with an accuracy of 56%. Since
30
The Japanese imaging guideline 2013
CQ 131
the accuracy was 55% by CT and 56% by tumor marker monitoring, the addition of PET to CT and the tumor marker
did not provide additional information for the prediction of postoperative histological results.8) Other studies have also
suggested that residual mature teratomas may give false negative results,9) and the use of PET is not recommended also
by international guidelines.
As observed above, PET is recommended for seminoma patients with post-chemotherapy residual masses. With a
negative result, the possibility of viable residual tumor is low, and additional treatments may be spared. Presently, PET
is not recommended as a routine examination for the postoperative assessment of non-seminomatous tumors.
Index words and secondary materials used as references
A search of PubMed was performed using “testicular”, “testis”, “germ cell tumor”, “tumor”, “cancer”, “carcinoma”,
“seminoma”, “nonseminoma”, “CT”, and “PET” as key words. The EAU guidelines 2011, ESMO Clinical Practice
Guidelines 2010, NCCN clinical practice guidelines 2009, Report of the European Germ Cell Cancer Consensus Group
(EGCCCG) 2004, and the literature cited in these guidelines were also used as references.
References
1) Bachner M et al: 2-18fluoro-deoxy-D-glucose positron emission tomography (FDG-PET) for postchemotherapy seminoma residual lesions: a
retrospective validation of the SEMPET trial. Ann Oncol 23: 59-64, 2012 (Level 3)
2) De Santis M et al: Predictive impact of 2-18fluoro-2-deoxy-D-glucose positron emission tomography for residual postchemotherapy masses in
patients with bulky seminoma. J Clin Oncol 19: 3740-3744, 2001 (Level 4)
3) Becherer A et al: FDG PET is superior to CT in the prediction of viable tumour in post-chemotherapy seminoma residuals. Eur J Radiol 54:
284-288, 2005 (Level 4)
4) De Santis M et al: 2-18fluoro-deoxy-D-glucose positron emission tomography is a reliable predictor for viable tumor in postchemotherapy seminoma: an update of the prospective multicentric SEMPET trial. J Clin Oncol 22: 1034-1039, 2004 (Level 3)
5) Hinz S et al: The role of positron emission tomography in the evaluation of residual masses after chemotherapy for advanced stage seminoma.
J Urol 179: 936-940, 2008 (Level 3)
6) Steyerberg EW et al: Retroperitoneal metastases in testicular cancer: role of CT measurements of residual masses in decision making for
resection after chemotherapy. Radiology 215: 437-444, 2000 (Level 3)
7) Oldenburg J et al: Postchemotherapy retroperitoneal surgery remains necessary in patients with nonseminomatous testicular cancer and minimal residual tumor masses. J Clin Oncol 21: 3310-3317, 2003 (Level 3)
8) Oechsle K et al: [18F] Fluorodeoxyglucose positron emission tomography in nonseminomatous germ cell tumors after chemotherapy: the
German multicenter positron emission tomography study group. J Clin Oncol 26: 5930-5935, 2008 (Level 3)
9) De Santis M et al: The role of positron emission tomography in germ cell cancer. World J Urol 22: 41-46, 2004 (Level 3)
31
The Japanese imaging guideline 2013
08
Breast region
1
The Japanese imaging guideline 2013
8. Breast region
132
Is MRI appropriate for the qualitative diagnosis
of calcified breast lesions without corresponding
abnormalities on ultrasonography?
Recommendation
grade
C1
While scientific evidence is insufficient, implementing MRI as a means for the
selection of the therapeutic approach may be considered.
Background/objective
With the increase in the screening rate using mammography, patients in whom calcified lesions requiring further
evaluation are detected have been increasing. In Japan, if no abnormality is noted by ultrasonography, stereotactic
vacuum-assisted breast biopsy (SVAB) is performed, but its indications are unclear, and as the availability of the device
remains insufficient as it can only be performed at limited facilities. Also, the usefulness of MRI for the evaluation of
calcified lesions is controversial, and the position of MRI in the diagnosis and treatment of calcified lesions has not been
established (Figure). The usefulness of MRI for the evaluation of calcified lesions was evaluated.
Comments
Reports on the usefulness of MRI for the evaluation of calcified lesions began to appear in the late 1990s, but as the
ability of MRI in the qualitative diagnosis of calcified lesions was insufficient, the benefit of MRI was refuted.1) In the
2000s, the diagnostic ability of MRI was improved due to technical developments, and the recent changes in the clinical
procedures associated with the introduction of SVAB have led to increases in reports recommending MRI.2-4)
According to major reports on the ability of MRI for the qualitative diagnosis of calcified lesions published after 2000,
the sensitivity was 73-90%, specificity was 76-100%, positive predictive value was 73-92%, negative predictive value
was 71-97%, and the accuracy was 74.5-96%.2-6) Only 3 reports from Japan clearly mentioned that no abnormality was
noted on ultrasonography,2-4) and ultrasonography was not mentioned, or was not performed, in the other reports. The
categories of target calcification and diagnostic criteria by MRI also varied among reports.
Among the possible roles of MRI in the diagnosis of calcified lesions, it is expected to be most useful for the selection
between SVAB and observation for calcified lesions with no abnormality on ultrasonography. While there have been
positive reports that observation is possible if there are no malignant findings on MRI,3,4) a recent meta-analysis7)
presented a negative view that the negative predictive value of MRI is not sufficiently high to justify avoidance of
SVAB.
In conclusion, MRI is not a modality that can replace SVAB, but as it may help with the selection of the therapeutic
approach, its implementation may be considered.
Index words and secondary materials used as references
A search of PubMed was performed using “MRI”, “breast”, “screening mammography”, and “microcalcification” as
key words.
References
1) Westerhof JP et al: MR imaging of mammographically detected clustered microcalcifications: is there any value? Radiology 207: 675-681,
1998 (Level 3)
2) Nakahara H et al: Three-dimensional MR imaging of mammographically detected suspicious microcalcifications. Breast Cancer 8: 116-124,
2001 (Level 3)
3) Uematsu T et al: Dynamic contrast-enhanced MR imaging in screening detected microcalcification lesions of the breast: is there any value?
Breast Cancer Res Treat 103: 269-281, 2007 (Level 3)
4) Akita A et al: The clinical value of bilateral breast MR imaging: is it worth performing on patients showing suspicious microcalcifications on
mammography? Eur Radiol 19: 2089-2096, 2009 (Level 3)
5) Cilotti A et al: Contrast-enhanced MR imaging in patients with BI-RADS 3-5 microcalcifications. Radiol Med 112: 272-286, 2007 (Level 3)
6) Bazzocchi M et al: Contrast-enhanced breast MRI in patients with suspicious microcalcifications on mammography: results of a multicenter
trial. AJR 186: 1723-1732, 2006 (Level 3)
7) Dorrius MD et al: Breast magnetic resonance imaging as a problem-solving modality in mammographic BI-RADS 3 lesions. Cancer Imaging
10: S54-58, 2010 (Level 3)
2
The Japanese imaging guideline 2013
CQ 132
A
B
Figure: Calcified lesions of microinvasive carcinoma and MRI
Microcalcification was noted in the L region on screening mammography (A). No
abnormality was noted on ultrasonography, but MRI (B) showed enhancement in the
area of calcification ( → ). Surgery was performed after SVAB, and a diagnosis of
microvascular carcinoma was made.
3
The Japanese imaging guideline 2013
8. Breast region
133
Which imaging modalities are appropriate for the
discrimination of benign and malignant mass lesions
of the breast?
Recommendation
grade
B
C1
D
C2
B
C1
D
C2
Ultrasonography
MRI
CT
PET (including PET/CT)
Ultrasonography is useful and recommended. While there is no sufficient scientific
evidence, performing MRI with utmost caution may be considered. However, as
there is no sufficient scientific evidence supporting the usefulness of CT for the
differentiation of benign and malignant tumors, it should not be performed. PET
(including PET/CT) also lacks sufficient scientific evidence and is not recommended.
Background/objective
Breast cancers undetectable by inspection, palpation, or mammography may be detected by ultrasonography, and
this modality is excellent particularly in diagnosing solid tumors. Moreover, the standardization of the terminology
for ultrasound findings and preparation of criteria for the discrimination of benign and malignant diseases have also
been advanced. MRI is sensitive for breast cancer, but its specificity is relatively low (Figure). Guidelines have been
proposed to standardize the terminology for findings and imaging procedures, and improvements in the specificity
are expected. PET is excellent in detecting malignant tumors, and PET/CT has recently become more available. The
usefulness of ultrasonography, CT, MRI, and PET (PET/CT) for the discrimination of benign and malignant tumoral
lesions of the breast was evaluated.
Comments
1) Ultrasonography
The precision of ultrasonography has been markedly improved due to the recent improvements in ultrasonographic
devices and development of software, 1,2) and analysis of the morphology (shape, margin, depth-width ratio) of
solid masses and evaluation of their mobility and deformability have been reported to be useful for the diagnosis
and discrimination of benign and malignant lesions. To the present, the precision of ultrasonography (B-mode) in
discriminating benign and malignant lesions has varied with the tumor size and has been reported at 75.6-88.4%.3-5)
The diagnostic accuracy of ultrasonography has been affected by the examiner’s skill, performance of the device, and
examination conditions, the standardization of the terminology has been insufficient, and the ability to differentially
diagnose benign and malignant lesions has been rated poorly. However, as the Breast Imaging Reporting and Data
System (BI-RADS)-Ultrasound similar to that for mammography has been prepared, the standardization of the
terminology for findings and quality of diagnosis has been advanced,6) and, in the discrimination of benign and
malignant solid tumors, the accuracy and positive and negative predictive values have been reported to be 71.3, 67.8,
and 92.3%, respectively.7,8) In Japan, also, the Guidelines for Breast Ultrasound were published in July, 2004, and a
major revision was made in 2008 by including the breast ultrasound diagnostic tree. In this version, also, ultrasound is
shown to be useful for the discrimination of benign and malignant tumoral lesions and is recommended.
2) MRI
As for the diagnostic performance of MRI for breast cancer, the sensitivity and specificity were 90 (52-100) and 72
(21-100)%, respectively, according to a meta-analysis,9) with the specificity being low compared to the sensitivity. While
the positive predictive value of MRI has been reported to be higher than that of mammography, the negative predictive
value has been reported to be insufficient for omitting biopsy.10) Since the lack of standardization of the imaging method
and diagnostic criteria was considered to be a cause of the relatively low specificity of MRI, the BI-RADS-MRI was
prepared to standardize the terminology for, and interpretation of, findings and final diagnosis. According to a singlefacility study in which tumoral lesions were evaluated on the basis of the BI-RADS-MRI, high diagnostic performance
with sensitivity, specificity, and positive and negative predictive values of 99, 89, 96, and 98%, respectively, was
reported.11) Also, the frequency of malignant lesions among BI-RADS category 3 lesions, which are considered to
be probably benign on contrast-enhanced MRI, was 0.9%, which consisted of non-tumoral lesions alone, and none
4
The Japanese imaging guideline 2013
CQ 133
B
A
C
D
Figure: Mucinous carcinoma
A Mammography B Ultrasonography C T2-weighted MRI D Dynamic MRI (subtraction)
Mammographically, a clear-bordered mass is noted in the AC region of the left mammary glands
( → ). Ultrasonography also shows a clear-bordered mass with heterogeneous interior. On
T2-weighted MRI, a mass with a hypointense margin and hyperintense interior ( → ) is observed,
and another mass is noted on the nipple side ( ▲ ). On dynamic MRI, the mass is densely stained
( → ).
of the tumoral lesions was malignant.12,13) Thus, MRI shows a high negative predictive value in tumoral lesions with
assessment based on the BI-RADS-MRI. While the specificity is still unsatisfactory, there is the possibility that invasive
examinations such as surgical biopsy may be avoided by performing MRI for tumoral lesions.
3) CT
Although there has been no report on the diagnostic ability of CT in tumoral lesions, the sensitivity, specificity, positive
and negative predictive values, and accuracy of the diagnosis of mammary gland diseases at a single facility were
reported to be 89.6, 54.5, 93.2, 39.3, and 84.7%, respectively,14) with the specificity and negative predictive value being
lower than those of ultrasonography or MRI. There is also a report that the diagnostic performance of CT was high
with sensitivity, specificity, positive predictive value, negative predictive value, and accuracy of 92.6, 100, 100, 100,
and 95.7%, respectively,15) but the number of patients was small, and the evidence that CT is useful for the differential
diagnosis of tumoral lesions is insufficient. In addition, CT has the defect that the exposure increases if multiphasic
imaging is performed for the assessment of the hemodynamics, and it is not recommended to perform CT exclusively
for the differential diagnosis of benign and malignant tumoral lesions of the mammary glands.
4) PET
Concerning the diagnostic ability of PET for breast cancer, the sensitivity varies widely from 48-95.7%, but the
specificity is relatively high at 73.3-100%.16) Its sensitivity for small breast cancers 1 cm or less in diameter is low at
48-76.2%, and the false negative rate is high for lesions with low histological malignancy, invasive lobular carcinoma,
and non-invasive ductal carcinoma.16-18) According to reports comparing the sensitivity of PET with those of existing
modalities, it was 83.3-96% for PET, 58.3-78.9% for mammography, 86.6-88% for ultrasound, and 89-100% for MRI.19-25)
However, the comparison was not performed in patients including a sufficient number of those with small tumors, so
5
The Japanese imaging guideline 2013
8. Breast region
134
Is MRI appropriate for patients with abnormal nipple
discharge showing no mammographic or ultrasound
abnormalities?
Recommendation
grade
C1
While scientific evidence is insufficient, MRI may be considered.
Background/objective
Abnormal nipple discharge suggestive of breast cancer is often from a single opening, and close evaluation is usually
not indicated if discharge is from multiple openings or bilateral. Generally, slightly less than 15% of discharge from a
single opening is malignant, and slightly less than 10% of malignant discharge shows no abnormality on inspection,
palpation, mammography, or ultrasonography, occasionally making the diagnosis difficult.
Comments
As mentioned above, the cause of slightly less than 10% of malignant abnormal nipple discharge cannot be identified
by diagnostic imaging, but, including latent cases, about twice this percentage is unexplained and is followed up by
nipple discharge cytology.
According to the recommendations compiled in 2010 by the European Society of Mastology (EUSOMA) concerning
MRI of mammary glands, (1) there is no sufficient scientific evidence for the clinical benefit of MRI as an examination
of abnormal nipple discharge, and, (2) in countries where ductography is regarded as a routine examination for patients
with abnormal nipple discharge, T2-weighted imaging and contrast-enhanced MRI are considered when ductography is
technically difficult or is rejected by the patient.1)
In most of the other literature, MRI is suggested to have a very high ability to detect lesions (sensitivity: 89-100%) and
to be useful also when no lesion can be detected by mammography or ultrasonography (Figure).2-7)
In Japan, ductography is not yet established as a routine diagnostic procedure for patients with abnormal nipple
discharge. In many of the references shown below, the definitive diagnosis could be made by 2nd look ultrasonography
after MRI, so MRI may be considered in patients with abnormal nipple discharge showing no abnormality by other
modalities.
A
B
Figure: Non-invasive ductal carcinoma MRI
A Non-contrast T1-weighted MIP image: Dendritic hyperintensities
suggestive of bloody discharge are observed on the medial side of the
right breast. B Contrast-enhanced T1-weighted MIP image: Clumped
enhancement is noted on the caudal side of the dendritic hyperintensities.
Biopsy was performed under 2nd look ultrasonography, leading to a
diagnosis of non-invasive ductal carcinoma.
6
The Japanese imaging guideline 2013
CQ 134
Index words and secondary materials used as references
A search of PubMed was performed using “breast”, “MRI”, and “nipple discharge” as key words. Also, Magnetic
resonance imaging of the breast: recommendations from the EUSOMA working group. (1) was used as a reference.
References
1) Sardanelli F et al: Magnetic resonance imaging of the breast: recommendations from the EUSOMA working group. Eur J Cancer 46: 12961316, 2010 (Level 5)
2) Lorenzon M et al: Magnetic resonance imaging in patients with nipple discharge: should we recommend it? Eur Radiol 21: 899-907, 2011
(Level 4)
3) Ballesio L et al: Role of breast magnetic resonance imaging (MRI) in patients with unilateral nipple discharge: preliminary study. Radiol Med
113: 249-264, 2008 (Level 4)
4) Hirose M et al: MR ductography: comparison with conventional ductography as a diagnostic method in patients with nipple discharge.
Radiographics 27: 183-196, 2007 (Level 4)
5) Morrogh M et al: The predictive value of ductography and magnetic resonance imaging in the management of nipple discharge. Ann Surg
Oncol 14: 3369-3377, 2007 (Level 4)
6) Nakahara H et al: A comparison of MR imaging, galactography and ultrasonography in patients with nipple discharge. Breast Cancer 10: 320329, 2003 (Level 4)
7) Orel SG et al: MR imaging in patients with nipple discharge: initial experience. Radiology 216: 248-254, 2000 (Level 4)
7
The Japanese imaging guideline 2013
8. Breast region
135
Are MRI and CT appropriate for the evaluation of the
extent of breast cancer?
Recommendation
grade
B
C1
B MRI
C1 CT
MRI is recommended. If MRI cannot be performed, CT may be considered as it
may be more effective than conventional clinical examinations, mammography, or
ultrasonography.
Background/objective
In breast cancer, the intraductal extent and presence of multiple foci are known as risk factors of local recurrence after
breast-conserving surgery, and it is extremely important to make the resection stump negative for the prevention of local
recurrence.1) Breast MRI, which has become prevalent in Western countries since the 1980s, has higher sensitivity than
other imaging modalities in the delineation of breast cancer and is expected to be useful for the preoperative evaluation
of the disease extent. Also, in Japan, helical CT has been used since early on for the preoperative evaluation of the
extent of breast cancer, and there have recently been reports on the evaluation of the disease extent using multislice CT.
Comments
Local extension including the intraductal spread and the presence or absence of separate foci in the ipsilateral breast
are often evaluated together as the “extent” in the staging of breast cancer. This evaluation is important as it affects
the choice of surgical procedure. It is difficult to clearly distinguish intraductal spread and ipsilateral foci, and these
ipsilateral multiple foci are included in the evaluation of the local extent in some reports.
Breast MRI has been shown by a number of reports to have higher diagnostic precision than mammography or
ultrasonography concerning the extent of breast cancer.2-4) In comparison with pathological findings in patients who
underwent mastectomy, the tumor diameter was significantly underestimated by mammography and ultrasonography,
but MRI showed no significant errors.2) Also, in detailed comparison with pathological findings in patients including
those who underwent breast-conserving surgery, the correlation coefficients of mammography, ultrasonography,
and MRI were 0.63, 0.55, and 0.78, respectively, and the diagnostic ability by a combination of mammography and
ultrasonography (correlation coefficient: 0.69) was still lower than that of MRI.3) As for the effects of the preoperative
assessment of the spread of breast cancer by MRI on the surgical procedure, the surgical procedure was reported to have
been changed appropriately by preoperative MRI in 19-28% of the patients.5-7) On the other hand, a recent multicenter
randomized controlled trial (COMICE trial) reported that no significant difference was noted in the reoperation rate
between the groups that underwent (816 patients) and did not undergo (807 patients) MRI before surgery for breast
cancer.8) In this study, also, unnecessary mastectomy was reportedly performed due to overestimation in 2% of the
patients who underwent MRI.
In the evaluation of intraductal involvement including non-invasive ductal carcinoma in situ, the sensitivity, specificity,
and accuracy of contrast-enhanced multislice CT have been reported to be 71.8-88.2, 67.8-85.7, and 72.2-97.3%,
respectively.9-12) When compared with groups in which the evaluation was made by mammography and ultrasonography
alone, multislice


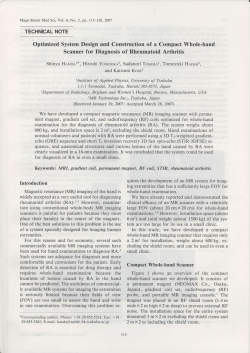
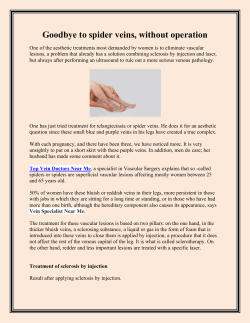

© Copyright 2026